Global
High-temperature Disaster Risk of Rice Dataset
Su, P.1,3 Wang, J. A.1,2* Zhang, A. Y.1 Wang, R.1
1. Faculty
of Geographical Science, Beijing Normal University, Beijing 100875, China;
2. Key
Laboratory of Tibetan Plateau Land Surface Processes and Ecological
Conservation (Ministry of Education), Xining 810008, China;
3. China
School of Geographic Science, Qinghai Normal University, Xining 810008, China
Abstract: Under
the background of climate change and population expansion, the food supply
pressure increased. Rice is a temperature-sensitive crop, thus its future yield
and growth environment will also undergo significant changes with climate
changes. This paper used the MaxEnt model and the redistribution method to
project the planting areas under rice. Through combining the planting area and extreme
high temperature disasters, we obtained the high?Ctemperature exposure
to rice. The
EPIC model was used to generate the vulnerability curve
of rice yield loss responding to high-temperature stress. In addition, the
yield loss rate under different scenarios obtained by high-temperature
intensity and vulnerability curves. It was treated as the rice yield loss data.
The dataset was divided into three parts, rice potential cultivation area data,
rice high?Ctemperature exposure data, and rice high-temperature
yield loss data. The spatial resolution of the
rice potential cultivation area data and rice high-temperature exposure data is
0.25????0.25??
, and the spatial resolution of rice high-temperature yield loss data is 0.5????0.5??.
The dataset consisted of 21 files in total, and the data size was about 46.8MB.
Keywords: global change; rice; crop potential distribution; exposure; vulnerability
DOI: https://doi.org/10.3974/geodp.2022.04.05
CSTR: https://cstr.escience.org.cn/CSTR:20146.14.2022.04.05
Dataset Availability Statement:
The dataset supporting this paper
was published and is accessible through the Digital Journal of Global Change Data Repository
at: https://doi.org/10.3974/geodb.2022.06.04.V1 or https://cstr.escience.org.cn/CSTR:20146.112022.06.04.V1.
1 Introduction
The
latest IPCC special report pointed out that according to the current global
warming rate, the global temperature will rise by 1.5 ?? by 2040[1], which will change the growth environment of rice in the future.
Without considering the improvement of crops varieties, the cultivation area of
rice in the future should be adjusted to the environment. Similarly, the global
high?Ctemperature disasters on rice will also undergo
spatial and temporal changes in the future, which necessitate crop
distribution, exposure and yield loss data ?Cfor rice. Therefore, we can
intuitively recognize the distribution of rice planting area and the yield loss
induced by extreme high?Ctemperature under different scenarios, which helps to
formulate measures to reduce losses according to local conditions[2], and it is of great significance to world food security.
2 Metadata of the Dataset
The metadata of the Global rice high-temperature disaster
risk simulating dataset (2030s, 2050s)[3] is summarized in Table 1.
It includes the dataset full name, short name, authors, year of the dataset, temporal
resolution, spatial resolution, data format, data size, data files, data
publisher, and data sharing policy, etc.
Table 1
Metadata summary of
the Global rice high-temperature disaster risk simulating dataset (2030s,
2050s)
|
Items
|
Description
|
|
Dataset full name
|
Global rice
high-temperature disaster risk simulating dataset (2030s, 2050s)
|
|
Dataset short
name
|
GlobalRiceRisk
|
|
Authors
|
Wang, J. A.
AAA?C6406?C2022, Faculty of Geographical Science, Beijing Normal University,
and Key Laboratory of Tibetan Plateau Land Surface Processes and Ecological
Conservation (Ministry of Education), jwang@bnu.edu.cn
Su, P.
ABH?C3399?C2021, School of Geographic Science, Qinghai Normal University,
201947331031@stu.qhnu.edu.cn
Zhang, A. Y. AAA?C6787?C2022,
Faculty of Geographical Science, Beijing Normal University, zay@mail.bnu.edu.cn
Wang, R.
AAE?C1120?C2019, Faculty of Geographical Science, Beijing Normal University, wangr0225@163.com
|
|
Geographical region
|
Global
|
|
Year
|
2000s, 2030s and
2050s
|
|
Temporal resolution
|
1970?C2000
(2000s), 2016?C2035 (2030s) and 2046?C2065 (2050s)??
|
|
Spatial
resolution
|
The spatial
resolution of rice distribution and exposure data is 0.25??´0.25??, and the spatial
resolution of rice vulnerability data is 0.5??´0.5??
|
|
Data format
|
.tif
|
|
|
|
Data size
|
46.8 MB
|
|
|
|
Data files
|
Rice cultivation
area data, rice high-temperature exposure data, and rice high?Ctemperature
vulnerability data
|
|
Foundation
|
Ministry of
Science and Technology of P. R. China (2016YFA0602402)
|
|
Data publisher
|
Global Change Research Data Publishing & Repository,
http://www.geodoi.ac.cn
|
|
Address
|
No. 11A, Datun
Road, Chaoyang District, Beijing 100101, China
|
|
Data sharing
policy
|
Data from the Global
Change Research Data Publishing & Repository includes metadata, datasets (in the Digital Journal of Global Change Data Repository), and publications
(in the Journal of Global Change Data & Discovery). Data sharing policy includes: (1) Data are openly
available and can be free downloaded via the Internet; (2) End users are
encouraged to use Data subject to citation; (3) Users, who are by definition also
value?Cadded service providers, are welcome to redistribute Data
subject to written permission from the GCdataPR Editorial Office and the
issuance of a Data redistribution license; and (4) If Data are used to
compile new datasets, the ??ten per cent principal?? should be followed such
that Data records utilized should not surpass 10% of the new
dataset contents, while sources should be clearly noted in suitable places in
the new dataset[4]
|
|
Communication and
searchable system
|
DOI, CSTR, Crossref, DCI, CSCD,
CNKI, SciEngine, WDS/ISC, GEOSS
|
3 Methods
3.1 Data Collection or Processing
The
original data used in this study, including environment data (topographic and
soil properties data), crop data (historical rice planting area data) and
scenarios data (climate data). This paper selected the global digital elevation model (DEM) from USGS and the global
surface slope data of GAEZ as topographic data. This paper selected global soil
properties data from ISRIC. The historical rice harvested area data came from
EARTHSTAT, SPAM 2005 v2.0, and MIRCA2000. The climate data in this paper were
from NASA, including precipitation, the highest temperature and the lowest
temperature. And the multi-mode data results are averaged to get the
comprehensive results. The detailed data list is shown in Table 2.
Table
2 Database information
|
Category
|
Name
|
Year
|
Temporal Resolution
|
Sources
|
|
Environ-
ment data
|
Global Multi?Cresolution
Terrain Elevation Data (GMTED2010)
|
2010
|
1 km??1 km
|
United States Geological
Survey (USGS)
https://topotools.cr.usgs.gov/gmted_viewer/
|
|
WISE derived soil
properties on a 30 by 30 arc?Cseconds global grid
|
2012
|
30????30??
|
International Soil
Reference and Information Centre (ISRIC)
http://www.isric.org
|
|
Crop data
|
??Harvested Area and Yield for 175 Crops year 2000
??SPAM 2005 v2.0
??MIRCA2000
|
2000 or 2005
|
5????5??
|
??http://www.earthstat.org/harvested?Carea?C yield?C175?Ccrops/
??http://mapspam.info/maps/
??http://www.uni?Cfrankfurt.de/45218031/data_ download?
|
|
FAO rice production
statistics
|
1960-2015
|
Country unit and subnational
unit
|
http://www.fao.org/faostat/en/#data/QC;
http://kids.fao.org/agromaps/
|
|
FAO rice demand statistics
|
1960-2015
|
Country unit
|
http://www.fao.org/faostat/en/#data/FBS
|
|
FAO demographic data
|
1960-2015
|
Country unit
|
http://www.fao.org/faostat/en/#data/OA
|
|
FAO GDP statistics
|
1960-2015
|
Country unit
|
http://www.fao.org/faostat/en/?#data/MK
|
|
Rice growth period
|
1961-1990
|
5????5??
|
https://nelson.wisc.edu/sage/data?Cand?Cmodels/crop?Ccalendar?Cdataset/index.php
|
|
Scenarios data
|
NASA??s Climate Data
Services
|
1960-2099
|
0.25????0.25??
|
https://cds.nccs.nasa.gov/nex?Cgddp/
|
|
Global dataset of gridded
population and GDP scenarios
|
2005-2099
|
0.25????0.25??
|
http://www.cger.nies.go.jp/gcp/population?Cand?Cgdp.html
|
|
Land?CUse Harmonization 2 (LUH2)
|
1970-2100
|
0.25????0.25??
|
http://luh.umd.edu/data.shtml
|
|
Historical wind speed
(WorldClim V1.4)
|
1970-2000
|
5????5??
|
http://www.worldclim.com/version1
|
|
Wind speed under different
scenarios
|
1970-2099
|
0.5????0.5??
|
https://www.isimip.org/gettingstarted/input?Cdata?Cbias?Ccorrection/
|
3.2 Methodology
3.2.1 Estimated
Rice Cultivation Distribution
3.2.1.1
Estimated Potential Distribution of Rice
This
dataset used the MaxEnt model to estimate rice potential distributions. This
model is based on the maximum entropy method to simulate the species niche and
distribution. The input data of the model were the crop distribution samples
and the environmental variables. Refer to the previous work[5], the selection of samples and environmental variables in this paper
showed as follows.
First, we
calculated the ratio of historical crop cultivation area. Secondly, we divided
the ratio into four groups, and the fourth group (ratio??66%) determined the
number of samples selected in the other three groups according to the
proportion of the cultivation area and the number of samples. Besides, we used
the randperm function in MATLAB to randomly select the specified number of
samples in each group. The number of samples was 559 (ratio
<10%), 768 (10%??ratio <33%), 541 (33%??ratio <66%) and 360 (66%??ratio).
In order to
reduce the impact of random selection of samples, this paper chose 30 sets of samples. We calculated rice suitability
by these 30 sets of samples, and took the averaged results as the final rice
suitability.
This study
believed that terrain, climate[6?C8] and soil[9?C11], topography
were the factors that affected rice growth. Hence, we chose elevation, climate
indicators (22 indicators) and soil indicators (20 indicators) as candidate
indicators[12]. In order to extract indicators with a significant impact on the
growth range of rice, we screened the indicators three times. See Table 3 for the indicators used in the model.
Table
3 The indicators used in MaxEnt model
|
Data
|
Indicators
|
Meaning of indicators
|
|
Climate
|
BIO1
|
Annual mean temperature
|
|
|
BIO2
|
Mean diurnal range
|
|
|
BIO3
|
Isothermality
|
|
|
BIO5
|
Max temperature of warmest month
|
|
|
BIO8
|
Mean temperature of wettest quarter
|
|
|
BIO12
|
Annual precipitation
|
|
|
BIO18
|
Precipitation of warmest quarter
|
|
|
Solar
radiation
|
Solar radiation
|
|
|
Wind
speed
|
Wind speed
|
|
Soil
|
CECS
|
Cation exchange capacity
|
|
|
CFRAG
|
Coarse fragments % (> 2 mm)
|
|
|
CNrt
|
C/N ratio
|
|
|
GYPS
|
Gypsum content
|
|
|
ORGC
|
Organic carbon content
|
|
|
TAWC
|
Volumetric water content
|
|
|
TEB
|
Total exchangeable bases
|
|
Topography
|
DEM
|
digital elevation model (DEM)
|
3.2.1.2
Estimated Rice Yield Redistribution
(1) Rice yield estimation
The
relationship between per capita rice demand and per capita GDP was used to
calculate the amount of rice consumption under different SSP scenario. The
fitting function referred to previous research mainly including power function
linear model[13] and logarithmic linear model[14] (see Figure 1 for fitting examples). An example of curve fitting of
per capita GDP and per capita rice demand was shown in the figure 1.
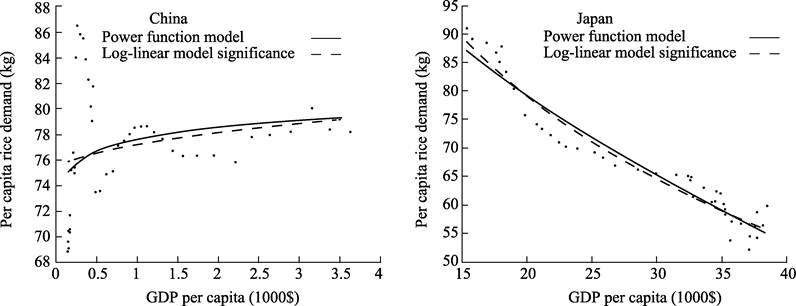
Figure 1 Curve
fitting of GDP per capita and per capita annual rice demand
(2) Rice yield redistribution
The
overall idea of redistribution of rice yield can be expressed as a multi-objective
optimization model where equations 1?C4 are established at the same time.
 (1)
(1)
where,
D, S and I represent the country??s rice demand, supply and net import
respectively.
 (2)
(2)
where,
 and
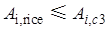
and  represent the
rice harvest area and C3 crop harvest area of the i?Cth grid, respectively.
represent the
rice harvest area and C3 crop harvest area of the i?Cth grid, respectively.
 (3)
(3)
where,
n represents the number of iterations, n=1 represents the initial situation
inferred from the change in the suitable zone, and Su represents the suitability.
 (4)
(4)
where,
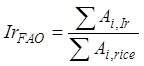
 represents the
national rice irrigation rate predicted by FAO, and
represents the
national rice irrigation rate predicted by FAO, and  and
and  represent the
rice irrigation area and rice harvest area in grid i, respectively.
represent the
rice irrigation area and rice harvest area in grid i, respectively.
When adjusting
the rice harvest area, we followed the following three principles: (1) make the
country??s rice supply and demand balance; (2) make the country??s rice
irrigation ratio as close as possible to the FAO forecast value; (3) when
increasing (or decreasing) the planting area, start from the high suitable area
(or start to decrease from the low suitable area), until the rice is planted to
all the cultivated land in the suitable area (or there is no rice planted).
Since it is impossible to determine the irrigation ratio within the increase
range, it is assumed that the irrigation ratio for all the increased areas is the
same. Figure 2 showed the process in detail.
3.2.2 Exposure
and Vulnerability Estimation Methods
3.2.2.1
Calculation of Hazard
The rice exposure to
high?Ctemperature was calculated by the high temperature days and the
accumulated temperature exceeding the rice growth
threshold. The rice growth threshold was defined as the maximum
temperature suitable for rice growth during the rice growth period[15] (the growth threshold of rice is 38 ??). We defined a single-day
average
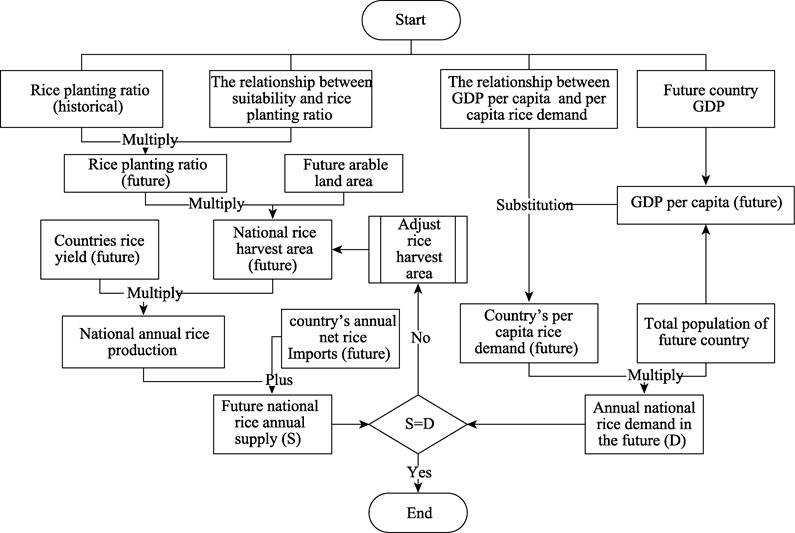
Figure 2 The future
rice harvest area and yield estimation framework
temperature
exceeding 38 ?? (??38 ??) as a high-temperature event for rice, and used the cumulative
stress value (GHTS) of the high-temperature event during the growth period as
the high?Ctemperature intensity.
3.2.2.2
Calculation of Rice Exposure
The
exposure of rice is the spatial superposition of the rice potential
distribution area and the hazard area. The exposure indicators used in this
dataset were the rice harvest area.
3.2.2.3
Calculation of Rice Vulnerability
The
vulnerability curve is established through binary relationship between the
intensity of the hazard and the loss of the crop. In this study, the EPIC model
was used to construct the vulnerability curve of rice through the high-temperature
intensity and yield loss rate. According to the vulnerability curve and the
high-temperature intensity under different scenarios, the loss rate of rice
under each scenario was obtained.
The EPIC model is
a dynamic model that integrates factors such as climate, soil, moisture, and
field management, and is often used for crop yield simulation. This paper used
the EPIC model to calculate the vulnerability curve between the high-temperature
intensity and the rice yield loss rate. The equations are as follows.
The high
temperature disaster intensity index (HSI)
in this study was defined as
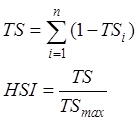 (5)
(5)
where,
TSi represents the
temperature stress value on the i?Cth
day, n represents the number of days
during the growth period, TS
represents the cumulative temperature stress during the growth period under a
certain scenario, and TSmax
represents the potential maximum value of the cumulative stress during the
growth period.
The yield loss
rate (YL) in this study was defined
as
 (6)
(6)
where,
Y represents the simulated output
under a certain scenario, and Ymax
represents the simulated output under the optimal scenario (TS=0).
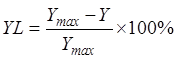
According to the
above equations, the HSI and the
corresponding YL were used to fit the
vulnerability curve through the logistics regression equation. The fitting
equation used in this study was:
 (7)
(7)
where,
a, b, c, d are curve function
parameters.
3.2.2.4
Calculation of Rice Yield Loss
In
the exposed area, the probability density curve of the high-temperature
disaster intensity was calculated by using the information diffusion theory,
and combined it with the vulnerability curve, the probability density curve of
the rice yield loss rate was obtained. Then, we calculated its loss expectation
to reflect the average state of rice yield loss induced by high temperature
disasters.
The cumulative high-temperature
stress value in a certain period was simulated by EPIC, and the annual
high-temperature disaster intensity index (HSI) was calculated (Equation 5).
Taking this data as an information diffusion sample, the probability density
distribution was estimated by using the normal diffusion method. The specific
calculation process is as follows:
Let U={u1,
u2,??,un} be the discrete universe containing the possible
values of HSI, the value range of HSI is 0 to 1, and the resolution of the
universe is 0.0001, so U={0,0.0001 ,0.0002,??,1}. The information carried by the
HSI in each grid is diffused into each ui through the information
diffusion function (Equation 8).
 (8)
(8)
where,
k is the code of each grid, h is the normal diffusion coefficient,
which can be calculated by Equation 9.
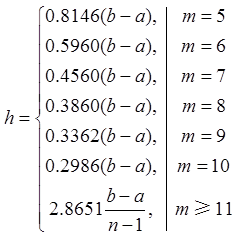 (9)
(9)
where
a and b are the minimum and maximum values of HSI, respectively, and m is the number of samples. Then the
information accumulation and normal information distribution of the sample can
be calculated by Equation 10 and Equation 11, respectively.
 (10)
(10)
 (11)
(11)
where,
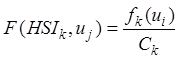
Ck is the information
accumulation of each kth
sample, F(HSIk, uj)
is the normalized information distribution of HSI, for each point uj, add all normalized
information to get the HSI from the given sample at uj information gain. The information gain is shown in
Equation 12.
 (12)
(12)
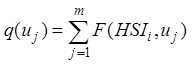
The diffusion
information of the sample was obtained by summing q(ui) (Equation
13):
 (13)
(13)
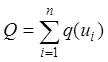
Then calculated
the probability density distribution of HSI (Equation 14):
 (14)
(14)
Defined the
probability density distribution of HSI as the expected value of the yield loss
rate of rice in a certain period (Equation 15).
 (15)
(15)
where,
p(uj)
is the estimated probability value when the high-temperature disaster intensity
is uj.
3.3 Technical Route
The
dataset was divided into three parts: rice potential cultivation area data,
rice high-temperature exposure data, and rice yield loss data. Among them, the
rice potential cultivation area data was calculated under the natural and socio-economic
scenarios, the rice high-temperature exposure data was calculated by the hazard
and the rice planting area. The rice yield loss data was calculated from the
rice vulnerability curve, which was simulated by the EPIC model. The detailed
process was shown in Figure 3.
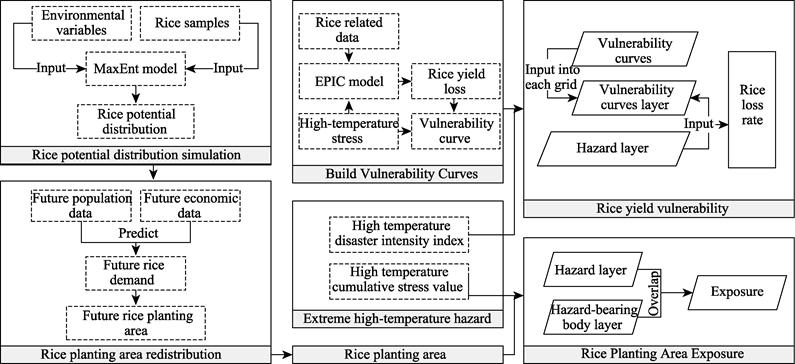
Figure 3 Data
producing technical route
4 Data Results and Validation
4.1 Data Composition
The
dataset was divided into 1970?C2000 (historical), 2016?C2035 (near-term), and
2046?C2065 (mid-term). The scenarios were divided into three combinations of
rcp2.6?Cssp1, rcp4.5?Cssp2 and rcp8.5?Cssp3.
Data spatial
resolution: The spatial resolution of rice distribution and exposure data is
0.25??´0.25??, and the spatial resolution of
rice vulnerability data is 0.5??´0.5??.
Data format:
GeoTIFF.
4.2 Data Products
4.2.1 Display of Rice Cultivation Area Data
In
this paper, the MaxEnt model was used to simulate the natural suitable areas of
rice, and on this basis, the supply and demand allocation of national units was
carried out, and finally the rice planting area under different scenarios was
obtained and mapped (Figure 4). Compared with the historical period, under the
RCP8.5?CSSP3 scenario, the planting area of rice in mid-term showed a decreasing
trend, with the most obvious decrease in planting area in South America and the
Indian peninsula.
4.2.2 Display of Rice High-temperature Exposure Data
The
rice planting area and the extreme high-temperature hazard area were
superimposed to obtain the rice exposure to high-temperature under each
scenario, and mapped (Figure 5). Compared with the historical period, under the
RCP8.5?CSSP3 scenario, the area of rice exposure to high temperature will
generally increase in the mid-term, with the most significantly in Africa and
southern China.
4.2.3 Display of Rice High-temperature Vulnerability Data
Combining
the rice vulnerability curve with the high-temperature hazard, the yield loss
ratio of rice caused by high-temperature under each scenario was obtained and
mapped (Figure 6). Compared with the historical period, under the RCP8.5?CSSP3
scenario, the loss of rice in the mid-term increased significantly.
4.3 Data Validation
This
dataset was calculated based on hazard (high temperature events) and hazard
bearing body (rice planting area). The hazard was calculated from different
climatic models from CMIP5. The availability of these data has been widely
proven[16]. The calculation processes of rice planting area were divided into rice
potential distribution and rice planting redistribution.
The process of redistribution was based on the historical rice harvest data, so
it is difficult to verify its accuracy. Therefore, the accuracy verification of
this dataset mainly focused on the verification of the rice potential
distribution. In the previous research, we verified the suitable area by remote
sensing image classification and other methods[6], which proved the rationality of the data. Here we would discuss
the random selection of samples in more details.
When the number of
random sample groups was more than 30, the uncertainty reduction was not significant.
Therefore, considering the reduction of uncertainty and efficiency, we chose to
set the number of sample groups to 30. The standard deviations of
30 random sample groups were spatially mapped, as shown in Figure 7.
(a) The historical distribution map
(b) Mid-term under RCP8.5?CSSP3 scenario map
Figure 4 Rice planting distribution
of historical period and mid-term under the RCP8.5?CSSP3 scenario
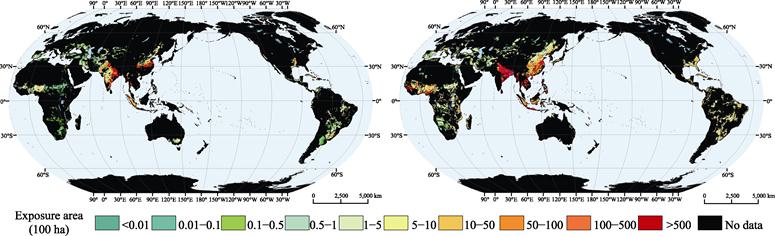
(a) The historical distribution map
(b) Mid-term under RCP8.5?CSSP3 scenario map
Figure 5 Map
of rice exposure to extreme high temperature hazard

(a) The historical distribution map
(b) Mid-term under RCP8.5?CSSP3 scenario map
Figure 6 Map
of Rice yield loss caused by high-temperature hazard
The figure showed
that the areas with large standard deviations were mainly concentrated in the
Pamirs and Asia Minor Peninsula, indicating that the simulation results of rice
distribution in these regions were quite different among the sample groups. Due
to historical rice planting area in these two regions was relatively small, so
it had little effect on the overall simulation results.
5 Discussion and Conclusion
This
dataset used the MaxEnt model and redistribution method to obtained the
distribution of rice planting. Through remote sensing classification, ROC curve
and other methods, this paper verified the validity of the rice distribution
prediction. By calculating the hazed intensity caused by future high
temperature event, and combined it with the crop distribution, we obtained rice
exposure to high-temperature data. Using the EPIC model to simulate the yield
loss rate of rice under different intensities of high temperature stress, we
obtained the vulnerability curve of rice facing high-temperature hazard, and
then we obtained the rice yield loss rate.
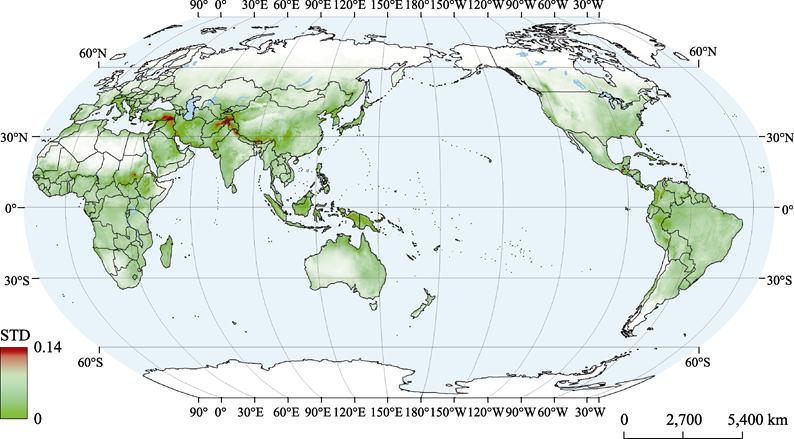
Figure 7 Map of spatial
distribution of standard deviations (30 sample groups)
This dataset
comprehensively considered the impacts of the natural and socio-economic
factors to estimate the future rice planting distribution. On this basis, we
calculated exposure and vulnerability with consideration the dual dynamic
changes of crop and hazard. On the one hand, this dataset has significance for
future rice planting and food security research. On the other hand, it also has
important value for climate change impact assessment.
Author Contributions
Wang,
J. A. designed the algorithms of dataset. Zhang, A. Y. and Wang,
R. contributed to the data processing and analysis. Su, P., Zhang,
A. Y. and Wang, R. contributed to the measures. Su, P. contributed to the data verification.
Conflicts of Interest
The
authors declare no conflicts of interest.
References
[1]
Intergovernmental
Panel on Climate Change. Global warming of 1.5 ?? [R]. Geneva, Switzerland: World Meteorological
Organization, 2018.
[2]
Fraser,
S., Wood, N., Johnston, D., et al.
Variable population exposure and distributed travel speeds in least?Ccost
tsunami evacuation modeling [J]. Natural
Hazards and Earth System Sciences, 2014, 2(6): 4163?C4200.
[3]
Su,
P., Wang, J. A., Zhang, A. Y., et al.
Global rice high-temperature disaster risk simulating dataset (2030s, 2050s)
[J/DB/OL]. Digital Journal of Global
Change Data Repository, 2022. https://doi.org/
10.3974/geodb.2022.06.04.V1. https://cstr.escience.org.cn/CSTR:20146.112022.06.04.V1.
[4]
GCdataPR
Editorial Office. GCdataPR data sharing policy [OL]. https://doi.org/10.3974/dp.policy.2014.05
(Updated 2017).
[5]
Su,
P., Zhang, A., Wang, R., et al.
Prediction of future natural suitable areas for rice under representative
concentration pathways (RCPs) [J]. Sustainability,
2021, 13(3): 1580.
[6]
Yoshida,
S., Parao, F. T. Climatic influence on yield and yield components of lowland
rice in the tropics [J]. Climate and Rice,
1976, 20: 471?C494.
[7]
Lobell,
D. B., Schlenker, W., Costa?CRoberts, J. Climate trends and global crop
production since 1980 [J]. Science,
2011, 333(6042): 616?C620.
[8]
Lobell,
D. B., Gourdji, S. M. The influence of climate change on global crop
productivity [J]. Plant
physiology, 2012,
160(4): 1686?C1697.
[9]
Azam,
F. Comparative effects of organic and inorganic nitrogen sources applied to a
flooded soil on rice yield and availability of N [J]. Plant & Soil, 1990,
125(2): 255?C262.
[10]
Kravchenko,
A. N., Bullock, D. G. Correlation of corn and soybean grain yield with
topography and soil properties [J]. Agronomy
Journal, 2000, 92(1): 75?C83.
[11]
Jiang,
X. J., Xie, D. Combining ridge with no-tillage in lowland rice-based cropping
system: long-term effect on soil and rice yield [J]. Pedosphere, 2009(4): 515?C522.
[12]
Wang,
R., Jiang, Y., Su, P., et al. Global
spatial distributions of and trends in rice exposure to high temperature [J]. Sustainability, 2019, 11: 6271.
[13]
Tilman,
D., Balzer, C., Hill, J., et al.
Global food demand and the sustainable intensification of agriculture [J]. Proceedings of the National Academy of
Sciences of the United States of America, 2011, 108(50): 20260?C20264.
[14]
Bijl,
D. L., Bogaart, P. W., Dekker, S. C., et
al. A physically-based model of long-term food demand [J]. Global Environmental Change, 2017, 45:
47?C62.
[15]
Watson,
R. T., Zinyowera, M. C., Moss, R. H., Impacts, adaptations and mitigation of
climate change: scientific-technical analyses [R]. Contribution of Working Group II to the Second Assessment Report of the
Intergovernmental Panel on Climate Change, University Press, 1996.
[16]
Taylor,
K. E., Stouffer, R. J., Meehl, G. A. an overview of CMIP5 and the experiment
design [J]. Bulletin of the American Meteorological Society, 2012,
93(4): 485?C498.