Dataset Development of the Habitat Suitability and Richness
of 285 Bird Species in China
Lu, H. Y.1,2 Zhang, R.1* Jiang, L. L.3
1. State Key Laboratory of Cryospheric Science and Frozen
Soil Engineering, Northwest Institute of Eco- Environment and Resources,
Chinese Academy of Sciences, Lanzhou 730000, China;
2. School of Geography Science and Geomatics Engineering,
Suzhou University of Science and Technology, Suzhou 215009, China;
3. School of Geography and
Tourism, Anhui Normal University, Wuhu 241002, China
Abstract: China
is one of the countries with the richest bird populations in the world. Based
on bird observation data from the eBird and GBIF platforms, along with digital
elevation model (DEM), annual precipitation, annual mean temperature, and
evapotranspiration data, the authors developed the dataset of habitat
suitability and richness of 285 bird species in China using the Biomod2
platform with GLM, MaxEnt, RF, and ensemble models. This dataset includes data
of 285 bird species, such as the Northern Goshawk, Common Starling, and
Eurasian Skylark, for the years 2000, 2005, 2010, 2015, and 2020, covering
habitat suitability and species richness. Model validation results indicate
high accuracy, with an average AUC of 0.991 and an average TSS of 0.923 for the
test set. The dataset has a spatial resolution of 0.05?? and a temporal
resolution of 5 years in .img and .tif data formats of 1,430 data files with
data size of 5.66 GB (compressed into one single file with 37 MB).
Keywords: biodiversity; species
distribution models; birds; remote sensing monitoring
DOI: https://doi.org/10.3974/geodp.2025.02.06
Dataset Availability Statement:
The
dataset supporting this paper was published and is accessible through the Digital Journal of Global
Change Data Repository at: https://doi.org/10.3974/geodb.2025.01.08.V1.
1 Introduction
As
one of the most widely distributed species in the world, birds are not only
indispensable members of ecosystems[1],
but they can also help alleviate human psychological anxiety and promote
physical and mental well-being[2].
However, The IUCN Red List of Threatened Species shows that hundreds of bird
species worldwide are either extinct or extinct in the wild, and over 15% of
bird species are categorized as Critically Endangered (CR), Endangered (EN), or
Vulnerable (VU)[3]. The process
of urbanization has converted large areas of biodiversity-rich lands, such as
forests and wetlands, into construction land, compressing the living space for birds[4,5]. At the same time, the
impacts of climate change on bird diversity are further intensifying. Since the
Industrial Revolution in the 19th century, urbanization has been continuously
advancing, and global temperatures have been steadily rising. Some bird species
have shown a declining population trend due to their inability to adapt to
climate change[6,7]. Birds are
being forced to migrate spontaneously to cooler areas, such as the poles and
high-altitude regions, to cope with climate change[8,9].
Species
Distribution Models (SDMs), also known as niche models, are methods used to simulate potential species distributions by utilizing species observation
data and environmental data[10]. SDMs can
simulate species habitat suitability using only environmental data and a small
number of species observation samples, making them an indispensable method for
bird conservation[11,12]. Biomod2, a mainstream species distribution
modeling platform, integrates several mainstream SDMs, such as GLM (Generalized
Linear Model), MaxEnt (Maximum Entropy Model), and RF
(Random Forest) models, and provides ensemble models (EM) to improve prediction
accuracy by integrating different models[13].
For SDMs, the
higher the quality of species observation data, the more accurate the
simulation results tend to be. eBird provides bird observation data with a
large number of records, broad spatial coverage, and long time-series data,
making it the most widely used bird observation platform among citizen science
platforms[14,15]. The Global Biodiversity Information Facility
(GBIF) website, as the leading species observation record platform globally,
collects species observation data from eBird. Therefore, this study uses bird
observation data from eBird and GBIF to construct 3 single-species distribution
models and ensemble models using Biomod2, to simulate bird distributions.
This study is
based on bird observation data from the eBird and GBIF platforms and has
developed a large-scale distribution dataset covering 285 bird species. The
purposes of this dataset are: (1) to provide a basis for studying the spatial
distribution patterns of birds; (2) to offer a reference for assessing changes
in bird habitats under global climate change; and (3) to supply data support
for the formulation of ecological conservation policies and the delineation of
ecological redline areas.
2 Metadata of the Dataset
The
metadata of the
Dataset of habitat suitability and richness of 285 bird
species in China[16] includes information on geographical region,
data period, temporal resolution, spatial resolution, dataset composition, data
publication and sharing platform, and data sharing policy, as shown in Table
1.
3 Methods
The study first processed bird observation data by
time series, splitting the data into different years based on observation
dates. Then, the data for each year were further divided by species. Finally,
spatial filtering was applied to remove records that were spatially close,
ensuring relative spatial independence of bird observations. To improve model
reliability and accuracy, only species with more than 5 available records each
year during the study period were selected. Ultimately, 285 bird species were
included.
Table 1 Metadata summary of the Dataset of habitat suitability
and richness of 285 bird species in China
|
Item
|
Description
|
|
Dataset full
name
|
Dataset of
habitat suitability and richness of 285 bird species in China
|
|
Dataset short name
|
HabitatSuitability&Richness2000-2020
|
|
Authors
|
Lu, H. Y.,
Northwest Institute of Eco-Environment and Resources, Chinese Academy of
Sciences, 19200214139@post.usts.edu.cn
Zhang, R.,
Northwest Institute of Eco-Environment and Resources, Chinese Academy of
Sciences, zhangrui@radi.ac.cn
Jiang, L. L.,
Anhui Normal University, jiangll@ahnu.edu.cn
|
|
Geographical
region
|
China (excluding
smaller islands and reefs)
|
|
Year
|
2000?C2020
|
|
Temporal
resolution
|
One phase every 5
years
|
|
Spatial
resolution
|
0.05??
|
|
Data format
|
.img, .tif
|
|
Data size
|
37 MB
(compressed)
|
|
Data files
|
Habitat
suitability and species richness of 285 bird species for 2000, 2005, 2010,
2015, and 2020
|
|
Foundation
|
Jiangsu
Education Department (202210332083Y)
|
|
Data publisher
|
Global Change
Research Data Publishing & Repository, http://www.geodoi.ac.cn
|
|
Address
|
No. 11A, Datun Road, Chaoyang District, Beijing 100101, China
|
|
Data sharing
policy
|
(1) Data
are openly available and can be free downloaded via the Internet; (2) End
users are encouraged to use Data subject to citation; (3) Users, who
are by definition also value-added service providers, are welcome to
redistribute Data subject to written permission from the GCdataPR
Editorial Office and the issuance of a Data redistribution license;
and (4) If Data are used to compile new datasets, the ??ten percent
principal?? should be followed such that Data records utilized should
not surpass 10% of the new dataset contents, while sources should be clearly
noted in suitable places in the new dataset[17]
|
|
Communication and searchable system
|
DOI, CSTR, Crossref, DCI, CSCD, CNKI, SciEngine,
WDS, GEOSS, PubScholar, CKRSC
|
|
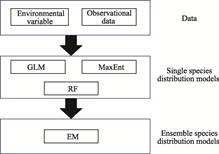
Figure 1 Technical workflow
|
Species distributions were analyzed using the
Biomod2 platform in R language, which integrates multiple single-species
distribution models and builds ensemble models based on them. 3 single
models??GLM, MaxEnt, and RF??were used and combined to construct an EM (Figure 1).
GLM handles various data types and offers good interpretability. MaxEnt, based
on information entropy, is among the most popular SDMs. RF is a machine
learning method that builds multiple decision trees and aggregates predictions
to improve accuracy and robustness, effectively capturing complex predictor
relationships. During modeling,
pseudo-absence points equal in number to presence points were generated. For
each run, 80% of the data were randomly selected as training data and 20% as
testing data. Each model run was repeated 5 times. 3 sets of pseudo-absence
points were created, and models were run on each.
This study
selected 4 environmental variables that may influence species distribution,
including elevation, temperature, precipitation, and evapotranspiration
intensity (Table 2). The elevation data were sourced from the WorldClim dataset
version 2.1. The temperature, precipitation, and evapotranspiration data were
sourced from the National Tibetan Plateau Data Center, with the dataset being
derived from meteorological station data through interpolation and downscaling
techniques[18].
Table
2 Data sources of environmental
variables
|
Data name
|
Data source
|
|
Elevation
|
WorldClim
dataset[19]
|
|
Average temperature
|
China 1-km
monthly average temperature dataset (1901?C2023)[20]
|
|
Average precipitation
|
China 1-km
monthly precipitation dataset (1901?C2023)[21]
|
|
Evapotranspiration intensity
|
China 1-km
monthly potential evapotranspiration dataset (1901?C2023)[22]
|
4 Data Results and Validation
4.1 Dataset Composition
The
Dataset of habitat suitability and richness of 285 bird
species in China containing 285 .img files. The
files are named as ??XXXX.img,?? where XXXX represents the species name.
Additionally, each year contains one .tif file representing species richness,
which is derived from the overlay of habitat suitability for all 285 bird
species. The .img and .tif files, where XXXX denotes the species name, can be
processed in GIS software and relevant programming environments. The dataset
has a temporal resolution of 5 years per period, comprising a total of 5
periods, with each period consisting of 285 .img files and one .tif file,
amounting to 286 files per period.
4.2 Data Products
The
species richness of 285 bird species exhibited significant spatial
heterogeneity, generally showing a decreasing gradient from the southeastern
coastal areas to the northwestern inland regions (Figure 2). This distribution
pattern is closely related to regional ecological and environmental
differences. The coastal areas, characterized by a warm and humid monsoon
climate, provide favorable conditions for vegetation growth and abundant food
resources for birds. Additionally, coastal regions contain diverse ecosystems
such as tidal flats, wetlands, and mangroves, offering rich habitats for many
bird species. Due to its unique geographic location, the Qinghai-Xizang Plateau
shows large internal variation in bird species richness. The southern part of
the plateau benefits from better hydrothermal conditions, richer vegetation
cover, and abundant food resources, which are more conducive to bird survival
and reproduction. In contrast, the northern part of the plateau is hindered by
topography and has less favorable hydrothermal conditions, resulting in lower
bird species richness. Regions such as Xinjiang and Qinghai are dominated by
deserts and semi-arid grasslands with low vegetation coverage and dry climates
lacking water resources. The combined influence of vegetation and climate leads
to low bird species richness in these areas. The northeastern region,
especially Heilongjiang Province, experiences low temperatures and prolonged
cold periods. This climate not only directly limits bird survival but also indirectly
reduces food availability by affecting vegetation growth and insect activity,
resulting in low bird species richness.
4.3 Data Validation
The Area Under the Curve
(AUC) is an important metric for evaluating the performance of species
distribution models, ranging from 0 to 1. A higher AUC value indicates better
predictive ability of the model[23]. The True Skill Statistic (TSS= Sensitivity+Specificity ?C1) is also frequently used to
assess model performance, ranging from ?C1 to 1, with higher values indicating
better model accuracy[24]. Since using AUC alone may lead to
overfitting
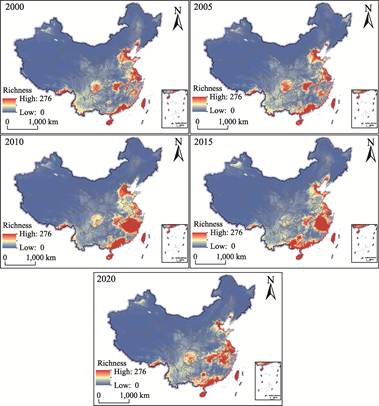
Figure
2 Maps of bird species
diversity in China
|
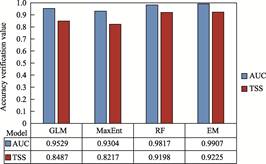
Figure 3 Comparison of the accuracy of Species
Distribution Models
|
and inaccurate assessment of model accuracy, this
study employed both AUC and TSS to evaluate the predictive performance of
species distribution models[25,26].
As shown in
Figure 3, the mean AUC for the test set was 0.953 and the average TSS was 0.849
for the GLM model. For MaxEnt, the test set mean AUC was 0.930 and average TSS
was 0.822. For RF, the test set mean AUC reached 0.982 with an average TSS of
0.920. The EM achieved the highest performance with a test set mean AUC of
0.991 and average TSS of 0.923. All 4 models had mean AUC values above 0.9 and
average TSS values above 0.8, indicating excellent predictive performance.
Among the single-species models, RF showed higher accuracy than MaxEnt and GLM,
and the EM outperformed all individual models. Therefore, the EM model was used
as the final predictive model in this study.
5 Discussion and Conclusion
The
rapid advancement of urbanization has led to a decline in ecological
environmental quality, global climate change, and the destruction of biological
habitats, resulting in threats to bird survival[7,27]. The Dataset
of habitat suitability and richness of 285 bird species in China utilizes bird
observation data from the eBird and GBIF platforms, sampled using R language
and ArcGIS software. Based on climate data and the Biomod2 programming
platform, this dataset calculates the suitable habitat data for 285 bird
species across the country from 2000 to 2020. The dataset reveals that the
habitat suitability and species richness of 285 bird species in China exhibit
significant spatial heterogeneity, generally showing a decreasing spatial
distribution pattern from the southeastern coastal areas to the northwestern
inland regions. Although the accuracy of the dataset meets the requirements for
species distribution modeling, the following issues should still be noted
during its use: The spatial distribution of species observation data from
citizen science platforms is not uniform, and observation locations are not
fixed, which inevitably affects the results of species distribution modeling.
Furthermore, although the dataset employs ensemble models to improve accuracy,
species distribution models simulate the potential distribution range of
species rather than their actual distribution range, leading to discrepancies
with real-world scenarios.
Author Contributions
Zhang, R. contributed to the overall design of the
dataset development; Lu, H. Y. and Jiang, L. L. collected and processed the
bird distribution data; Lu, H. Y. designed the models and algorithms, conducted
data validation; Lu, H. Y. and Zhang, R. wrote the data paper.
Conflict of Interest Statement
The
authors declare no conflicts of interest.
References
[1]
Ding, Z. H., Cao, J. J., Wang,
Y. The construction and optimization of habitat networks for urban-natural
symbiosis: a case study of the main urban area of Nanjing [J]. Forests,
2023, 14(1): 18.
[2]
Buxton, R. T., Pearson, A. L.,
Lin, H. Y., et al. Exploring the relationship between bird diversity and
anxiety and mood disorder hospitalisation rates [J]. Geo-Geography and
Environment, 2023, 10(2): 8.
[3]
Lees, A. C., Haskell, L.,
Allinson, T., et al. State of the world??s birds [J]. Annual Review of
Environment and Resources, 2022, 47: 231‒260.
[4]
Xu, C. L., Yu, Q., Wang, F., et
al. Identifying and optimizing ecological spatial patterns based on the
bird distribution in the Yellow River Basin, China [J]. Journal of
Environmental Management, 2023, 348: 13.
[5]
Lu, H. Y., Shang, Z. Y., Ruan,
Y. L., et al. Study on urban expansion and population density changes
based on the inverse S-shaped function [J]. Sustainability, 2023,
15(13): 19.
[6]
Moller, A. P., Rubolini, D.,
Lehikoinen, E. Populations of migratory bird species that did not show a
phenological response to climate change are declining [J]. Proceedings of
the National Academy of Sciences of the United States of America, 2008,
105(42): 16195‒16200.
[7]
Liu, Z. X., Zhang, W. W., Lu,
H. Y., et al. Exploring evolution characteristics of eco-environment
quality in the Yangtze River Basin based on remote sensing ecological index
[J]. Heliyon, 2023, 9(12): 14.
[8]
Zhu, B. R., Verhoeven, M. A.,
Velasco, N., et al. Current breeding distributions and predicted range
shifts under climate change in two subspecies of Black-tailed Godwits in Asia
[J]. Global Change Biology, 2022, 28(18): 5416‒5426.
[9]
Virkkala, R., Rajasärkkä, A.,
Heikkinen, R. K., et al. Birds in boreal protected areas shift
northwards in the warming climate but show different rates of population
decline [J]. Biological Conservation, 2018, 226: 271‒279.
[10]
Rousseau, J. S., Betts, M. G.
Factors influencing transferability in species distribution models [J]. Ecography,
2022, 2022(7): 13. DOI: 10.1111/ecog.06060.
[11]
Gaul, W., Sadykova, D., White,
H. J., et al. Data quantity is more important than its spatial bias for
predictive species distribution modelling [J]. Peerj, 2020, 8: 27.
[12]
Yu, H., Cooper, A. R., Infante,
D. M. Improving species distribution model predictive accuracy using species
abundance: application with boosted regression trees [J]. Ecological
Modelling, 2020, 432: 11.
[13]
Thuiller, W., Lafourcade, B.,
Engler, R., et al. BIOMOD??a platform for ensemble forecasting of species
distributions [J]. Ecography, 2009, 32(3): 369‒373.
[14]
Neate-Clegg, M. H. C., Horns,
J. J., Adler, F. R., et al. Monitoring the world??s bird populations with
community science data [J]. Biological Conservation, 2020, 248: 7.
[15]
Tejeda, I., Medrano, F. eBird
as a tool to improve the knowledge of Chilean birds [J]. Revista Chilena de
Ornitologia, 2018, 24(2): 85‒94.
[16]
Lu, H. Y., Zhang, R., Jiang, L.
L. Dataset of habitat suitability and richness of 285 bird species inChina [J/DB/OL]. Digital
Journal of Global Change Data Repository, 2025. https://doi.org/10.3974/geodb.2025.01.08.V1.
[17]
GCdataPR Editorial Office. GCdataPR data sharing
policy [OL]. https://doi.org/10.3974/dp.policy.2014.05 (Updated 2017).
[18]
Peng, S. Z., Ding, Y. X., Wen,
Z. M., et al. Spatiotemporal change and trend analysis of potential
evapotranspiration over the Loess Plateau of China during 2011‒2100 [J]. Agricultural
and Forest Meteorology, 2017, 233: 183‒194.
[19]
Fick,
S. E., Hijmans, R. J. WorldClim 2: new 1-km spatial resolution climate surfaces
for global land areas [J]. International Journal of
Climatology, 2017, 37(12): 4302‒4315.
[20]
Peng, S. Z. 1-km monthly mean
temperature dataset for china (1901‒2023) [DB/OL]. National Tibetan
Plateau/Third Pole Environment Data Center, 2024. https://doi.org/10.11888/Meteoro.tpdc.270961.
[21]
Peng, S. Z. 1-km monthly
precipitation dataset for China (1901‒2023) [DB/OL]. National Tibetan Plateau/
Third Pole Environment Data Center, 2024. https://doi.org/10.5281/zenodo.3114194.
[22]
Peng, S. Z. 1-km monthly
potential evapotranspiration dataset for China (1901‒2023) [DB/OL]. National
Tibetan Plateau/Third Pole Environment Data Center, 2024. https://doi.org/10.11866/db.loess.2021.
001.
[23]
Phillips, S. J., Anderson, R.
P., Schapire, R. E. Maximum entropy modeling of species geographic
distributions [J]. Ecological Modelling, 2006, 190(3‒4): 231‒259.
[24]
Xu, L., Fan, Y., Zheng, J. H., et
al. Impacts of climate change and human activity on the potential
distribution of Aconitum leucostomum in China [J]. Science of the Total
Environment, 2024, 912: 12.
[25]
Adeyemo, S. M., Granger, J. J.
Habitat suitability model and range shift analysis for American Chestnut (Castanea
dentata) in the United States [J]. Trees Forests and People, 2023,
11: 13.
[26]
Lobo, J. M., Jim??nez-Valverde,
A., Real, R. AUC: a misleading measure of the performance of predictive
distribution models [J]. Global Ecology and Biogeography, 2008, 17(2):
145‒151.
[27]
Zhang, W. W., Liu, Z. X., Qin,
K., et al. Long-term dynamic monitoring and driving force analysis of
eco-environmental quality in China [J]. Remote Sensing, 2024, 16(6): 22.