In Situ Dataset Development of Soil Nutrients in the Urban Green
Belts of Dezhou City
Hu,
H. Y.
Wang, Z.
B. Li, B.
B.* Fan, Z.
X.*
Institute of Geographic Sciences and Natural Resources,
Chinese Academy of Sciences, Beijing 100101, China
Abstract: To investigate the soil-related causes of poor vegetation growth in
the urban green belts of Dezhou
City, a systematic soil sampling survey of the green belts in the urban core
area was conducted in
June 2024, including Tianqu Road, Dongfeng
Road, East and West Chahe Avenue, Changhe Avenue, and Hubin Avenue. A total of
23 multi-profile soil samples were collected at different depths (0−20, 20−40, 40−60,
60−80, and 80−100
cm). The study systematically determined the
6 key soil parameters
of pH, salinity, organic matter, available nitrogen, available phosphorus, and available potassium using standardized analytical methods, including a
pH meter, the
oven-drying gravimetric method, and the
externally heated dichromate oxidation method. The dataset includes: (1) the geographical
locations and surface vegetation data of the sampling sites; (2) measured soil
nutrient data from the greenbelt, including stratified values of 6 fertility
indicators: pH, salinity, organic matter, available N, available P, and
available K; (3) statistical characteristics of soil nutrient data; (4) mean
membership values of different soil indicators across soil layers and roads;
(5) soil fertility evaluation index across different layers and roads; (6) data
used for calculation. The dataset is archived in .shp and .xlsx formats, and
consists of 8 data files with data size of 191 KB (Compressed into one file
with 160 KB).
Keywords: soil properties; IFI;
membership function; green belt
DOI: https://doi.org/10.3974/geodp.2025.02.11
Dataset Availability Statement:
The dataset supporting this paper
was published and is accessible through the Digital
Journal of Global Change Data Repository at: https://doi.org/10.3974/geodb.2025.03.07.V1.
1 Introduction
In
recent years, the rapid acceleration of urbanization has exacerbated urban
environmental problems[1], and the ecological service function of
urban green space has become particularly important. As a key component of
urban green space, green belts can not only alleviate the visual monotony of
the urban landscape and enhance the city??s aesthetic appeal[2], but
they also help to reduce road dust and air pollution[3], and play a
crucial role in improving the urban ecological environment, enhancing
resident??s quality of life, and mitigating the effects of climate change in
urban areas.
As the core
component of green belts, the growth status of plants directly determines the
effectiveness of ecological services. Soil quality is a key factor that
restricts the healthy growth of green plants[4?C9], studies in many
cities in China have revealed common problems in various green belts, such as
soil compaction, lack of organic matter, nutrient imbalances, and heavy metal
pollution[10?C15], which seriously restricts the ecological functions
of vegetation. The soil nutrient supply capacity can be quantified through soil
fertility evaluation[16], and commonly used methods such as the
Nemero index method, the membership function method, and principal component
analysis[17?C19]have been used to determine the fertility
characteristics of greenbelts in different cities. It has subsequently been
reported that green areas in the central urban area of Jianyang are limited by
a lack of organic matter and total nitrogen[20], Changchun is
limited by total phosphorus and nitrogen as well as by nutrient supply capacity
constraints[13], and the Nansha district of Guangzhou is constrained
by nutrient supply capacity and available P[14]. These findings
highlight the unique soil characteristics and fertility profiles of each city.
Therefore, it is necessary to accurately understand the soil quality status in
urban green areas. This will help to formulate appropriate measures to improve the
greening effect of the city, and is of great significance in the construction
of green spaces.
In recent years,
Dezhou City has actively promoted the development of an ecological garden city;
however, the frequent instances of poor plant growth and mortality in green
belts have exposed shortcomings in soil quality management. Previous studies
have focused on developed cities in the east of China, while there have been
few systematic soil surveys in cities in the northern plains, making it
difficult to establish a solid foundation for localized improvement. In this
study, we selected a typical green belt in Dezhou City and measured pH,
salinity, organic matter, and available nutrient indexes through stratified
sampling, combined with the affiliation function method, to comprehensively
evaluate soil fertility and analyze the spatial differentiation of nutrients.
The aim was to determine the causes of the soil degradation that affects plant
growth and provide data support for optimizing green space management
strategies. The results of this study will supplement the soil quality database
for northern urban green belts, providing practical support for the
construction of ecological cities in the Huanghuaihai Plain.
2 Metadata of the Dataset
The
metadata of the In situ dataset of soil nutrients
in urban green belts of Dezhou City, China (2024)[21] is summarized in Table 1. It includes the dataset full name, short
name, authors, year of the dataset, data format, data size, data files, and
data sharing policy, etc.
3 Methods
3.1 Study Area
Dezhou City is located in
the northwestern part of Shandong Province, with a longitude of 115??45???C117??36??E, latitude of 115??45???C117??36??N, elevation of 21 m above sea level, and a
Table
1 Metadata summary of the dataset
|
Items
|
Description
|
|
Dataset full name
|
In situ dataset of soil
nutrients in urban green belts of Dezhou City, China (2024)
|
|
Dataset short
name
|
SoilNutrientsUrbanGreenBeltsDezhou
|
|
Authors
|
Hu, H. Y., Institute of Geographic Sciences and Natural Resources,
Chinese Academy of Sciences, huhongyu449@foxmail.com
Li, B. B., Institute of Geographic Sciences and Natural Resources,
Chinese Academy of Sciences, libinbin@igsnrr.ac.cn
|
|
Geographical
region
|
Decheng District,
Dezhou City, China
|
|
Year
|
June 2024
|
|
Data format
|
.xlsx, .shp
|
|
|
|
Data size
|
191 KB
(compressed into a 160 KB file)
|
|
|
|
Data files
|
(1) The
geographical locations and surface vegetation data of the sampling sites; (2)
measured soil nutrient data from the greenbelt; (3) statistical
characteristics of soil nutrient data; (4) mean membership values of
different soil indicators across soil layers and roads; (5) soil fertility
evaluation index across different layers and roads; (6) data used for
calculation
|
|
Foundation
|
National Natural
Science Foundation of China (42130713)
|
|
Data publisher
|
Global Change Research Data Publishing & Repository,
http://www.geodoi.ac.cn
|
|
Address
|
No. 11A, Datun
Road, Chaoyang District, Beijing 100101, China
|
|
Data sharing
policy
|
(1) Data
are openly available and can be freely downloaded via the Internet. (2) End
users are encouraged to use Data subject to citation. (3)
Users, who are by definition also value-added service providers, are welcome
to redistribute Data subject to written permission from the GCdataPR
Editorial Office and the issuance of a Data redistribution license. (4)
If Data are used to compile new datasets, the ??ten percent
principle?? should be followed, such that the Data records
utilized should not surpass 10% of the new dataset contents, while sources
should be clearly noted in suitable places in the new dataset[22]
|
|
Communication and searchable system
|
DOI, CSTR, Crossref, DCI, CSCD, CNKI,
SciEngine, WDS, GEOSS, PubScholar, CKRSC
|
total area of 10,356 km2. The area belongs to the alluvial
plain of northwestern Shandong in the lower
reaches of the Yellow River, with a flat terrain, and the general trend of the
area slopes gently from the southwest to northeast. The soil parent material is
Yellow River alluvial deposits, which are dominated by saline tidal soils, and
the topsoil texture is a light-medium loam. The region has a warm-temperate
semi-humid monsoon climate, with a multiyear average temperature of 13.2 ??
and average rainfall of 538 mm.
 3.2 Data Collection
The green areas in the main part of Dezhou
City are relatively concentrated and are mainly distributed in the areas of
Tianqu Road, Dongfeng Road, Chahe East Avenue, Chahe West Avenue, Changhe
Avenue, and Hubin Avenue. They contain a wide variety of green plants, mainly
trees, shrubs, and herbaceous plants, such as ash, tamarisk, acacia, moon
season, begonias, forsythia, maitake, and iris. Soil samples were collected
from depths of 0−20, 20−40, 40−60, 60−80, and 80−100 cm, respectively. The
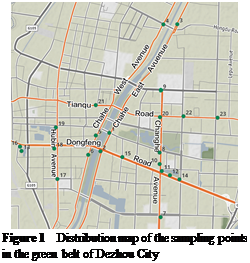
spatial distribution of the soil sample collection points is shown in Figure 1.
Air-dried soil samples were ground and sieved (pore sizes of 2 and 0.25
mm, respectively, to determine the physicochemical properties of the soil. The
soil indicators analyzed in this study were pH, salinity (g/kg), organic matter
(g/kg), available N (mg/kg), available P (mg/kg), and available K (mg/kg). The
soil pH was determined using a pH meter (PB-10). Soil salinity was measured by
the oven-drying method. Soil organic matter content was analyzed via the
potassium dichromate oxidation-external heating method. Available N was
quantified using the alkali hydrolysis diffusion method. Available P was
determined by flow injection analysis and available K was assessed via flame
photometry[23].
3.3 Soil Fertility Evaluation Methods
3.3.1
Evaluation of Single Indicators of Soil Properties
The 6 indicators of soil pH,
salinity (g/kg), organic matter (g/kg), available P (mg/kg), available N (mg/kg),
and available K (mg/kg) were evaluated and graded according to The second national
soil survey: soil nutrient grading standards[24].
Using the grading standards, the 6 indices were
evaluated and graded. Differences in the indices were compared between
different soil layers and roads.
3.3.2
Soil Fertility Evaluation
(1)
Calculation of weights
The correlation between the
soil indicators was calculated, and the weight value was calculated through the
correlation coefficient with the following formula:
Wi= (1)
(1)
where, Wi is the
weight of an indicator, and riAvg is the average value of the
correlation coefficient between indicator i and other indicators.
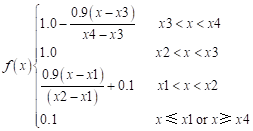
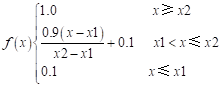
(2) Membership function
model
Based on The second national
soil survey: soil nutrient grading standards[24], the corresponding turning point value
intervals of the membership function were calculated according to the content
of each indicator. The formula for calculating the membership function based on
these intervals was established, enabling the membership value of each
indicator to be calculated. The membership function of soil pH was the
parabolic type, and therefore the formula used was Equation 2. The membership
function of soil salinity (g/kg), organic matter (g/kg), available N (mg/kg),
available P (mg/kg), and available K (mg/kg) was the S-type, and therefore
formula used was Equation 3.
 (2)
(2)
 (3)
(3)
where, x represents the measured values of various soil
nutrient indicators at the sampling point, while x1, x2, x3,
and x4 denote the graded standard values of nutrients from the Second
National Soil Survey.
(3) Calculation of
the fertility evaluation index
The soil fertility
evaluation index can characterize the fertility level of the soil, the specific
formula is as follows:
IFI= (4)
(4)
where, n is the measured sample size
of an index, Wi is the weight value of the ith index, Fi
is the membership degree value of the ith index, and IFI is
the fertility evaluation index. The range of the interval is 0−1, and the
closer the value is to 1, the better the quality of the soil.
3.4 Data Processing
The SPSS20.0
software was used for the statistical descriptions and to conduct an analysis
of variance (ANOVA) of soil pH, salinity (g/kg), organic matter (g/kg),
available N (mg/kg), available P (mg/kg), and available K (mg/kg) content of
green belts in the layers-dimension and road-dimension. Origin8.0 was used to
construct graphs of these 6 indicators.
4 Data Results
4.1 Dataset Composition
The In situ dataset
of soil nutrients in urban green belts of Dezhou City, China (2024) includes: (1) the geographical locations and
surface vegetation data of the sampling sites; (2) measured soil nutrient data
from the greenbelt, including stratified values of six fertility indicators:
pH, salinity, organic matter, available N, available P, and available K; (3)
statistical characteristics of soil nutrient data; (4) mean membership values
of different soil indicators across soil layers and roads; (5) soil fertility
evaluation index across different layers and roads; (6) data used for
calculation. The descriptions for each field are shown in Table 2.
Table 2 The descriptions for each field of the
dataset
|
Field names
|
Data content
|
Data description
|
|
Sampling Point ID
|
Sampling point ID
|
A unique identifier for each soil sampling point
|
|
Road name-CN
|
Road name (Chinese)
|
The Chinese name of the road
|
|
Road name-EN
|
Road name (English)
|
The English name of the road
|
|
Landscape plants-CN
|
Landscape plants (Chinese)
|
The Chinese name of the landscape plants
|
|
Landscape plants-EN
|
Landscape plants (English)
|
The English name of the landscape plants
|
|
Longitude
|
Longitude
|
The geographical longitude coordinate
|
|
Latitude
|
Latitude
|
The geographical latitude coordinate
|
|
Depth
|
Sampling depth
|
The soil sampling depth (cm)
|
|
pH
|
pH
|
The pH of the sampled soil
|
|
Salinity (g/kg)
|
Soluble salt content
|
The soluble salt content in the sampled soil (g/kg)
|
|
Organic matter (g/kg)
|
Organic matter content
|
The organic matter content in the sampled soil
(g/kg)
|
|
Available N (mg/kg)
|
Available N content
|
The available N content in the sampled soil (mg/kg)
|
|
Available P (mg/kg)
|
Available P content
|
The available P content in the sampled soil (mg/kg)
|
|
Available K (mg/kg)
|
Available K content
|
The available K content in the sampled soil (mg/kg)
|
4.2 Data Results
4.2.1 Properties of the Different Soil Layers within Green Belts
As
shown in Figure 2, the pH of the green belt soils (0−100 cm) in the urban area
of Dezhou ranged from 7.8 to 9.5, and the mean values of soil pH in the
different soil layers exceeded 8.5, indicating that the green belt soils were
strongly alkaline. Soil salinity (0−100 cm) was in the range of 0.4−14.02 g/kg,
with an average value of 1.84−4.06 g/kg, indicating that the green belt soil
was moderately saline. Dezhou City is located in the northwestern part of
Shandong Province, which has long been affected by the changes in the water
systems of the Yellow River, Huaihe River, and Haihe River. Frequent flooding,
river diversions, and seawater inversions have led to the formation of saline
soils[25]. In general, the pH range of soil suitable for plant
growth is 6.5−7.5, and the salt content needs to be <0.1%[26], while
the soil in the green belts of downtown Dezhou clearly exceeds this range, which
may lead to plant root damage and affect the absorption of water and nutrients.
Therefore, measures such as freshwater leaching for desalination and gypsum
application should be implemented to regulate soil pH and salinity, thereby
improving the soil environment.
The soil organic
matter content in the green belt in the urban area of Dezhou City was classed
as extremely poor[24].
Studies have shown that salinization destroys soil aggregate structure, reduces
soil water holding capacity and nutrient retention capacity, and accelerates
organic matter degradation and loss[27]. Furthermore, in the
management of urban green belts, the infrequent application of organic
fertilizers and prompt removal of dead leaves and branches results in a reduced
input of organic matter. This explains the low organic matter content of soils
in the urban green belts in Dezhou City[6,28]. To improve this
situation, the input of organic fertilizer and green manure should be increased
appropriately, while management measures to improve the soil organic matter
level should be optimized.
The mean available N in the 0−20 cm soil
layer in the urban green belt of Dezhou City was 69.47 mg/kg, which was classed
as moderate, while the mean available N in the rest of the soil layer was
classed as poor or below. It therefore needs to be enhanced to improve the
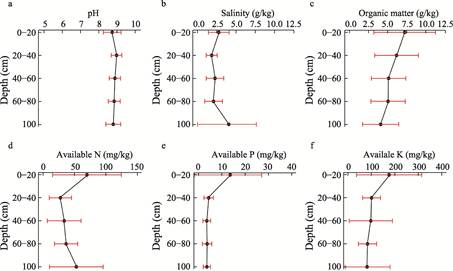
Figure 2 Variations in soil properties across different
soil depth layers
soil fertility[29].
However, the low soil organic matter content in the green belts of urban areas
in Dezhou City leads to an insufficient nitrogen supply capacity. The mean soil
available P at 0−20 cm was 13.66 mg/kg, which was classed as moderate, while
the remaining soil layers had only 3.62−4.43 mg/kg of available P, which was
classed as poor. Phosphorus is an important nutrient for plant growth. It is
involved in photosynthesis, energy transfer, and antioxidant synthesis,
especially in saline soils, where salinity further reduces the P uptake
capacity of plants[30?C32]. Therefore, the lack of available N and P
in green belt soils in Dezhou City should be increased by applying more organic
fertilizers and deeper applications of chemical fertilizers. The average
available K in the 0−20 cm soil layer was 175.73 mg/kg, which was classed as
abundant, and the average value of 101 mg/kg in the 20−40 cm soil layer was
classed as rich. Compared with the available N and P, the available K was
relatively abundant. The focus should therefore be on the supplementation of N
and P.
4.2.2
Soil Properties of Green Belts Along Different Roads
As shown in Table
3, the mean soil pH in green belts along different roads ranged from 8.7 to
9.05, with the highest mean soil pH occurring in Chahe West Avenue (9.05)
followed by Dongfeng Road (8.9), Tianqu Road and Changhe Avenue (both 8.82),
and Chahe East Avenue and Hubin Avenue (both 8.7). There were no significant
differences in soil pH among the different roads. The ANOVA results showed that
the soil salt content of Chahe East Avenue was significantly different from
that of Changhe Avenue and Hubin Avenue.
According to The Second National Soil Survey: Soil
Nutrient Grading Standards,
the soil organic matter content in the green belt in the urban area of Dezhou
City was poor overall (4.19−6.43 g/kg), and there were no significant
differences among the roads. The available N was poor (23.3−52.9 mg/kg), with
significant differences only between East and West Chahe Avenue. The available
P decreased in the order of Dongfeng Road (8 mg/kg, moderate) > Tianqu Road
(7.55 mg/kg, moderate) > Chahe West Avenue > Hubin Avenue > Changhe
Avenue > Chahe East Avenue (all poor). The available K was highest on Tianqu
Road (170 mg/kg, rich), followed by Dongfeng Road (124.87 mg/kg), Chahe West
Avenue (121.11 mg/kg). Tianqu Road differed significantly from Chahe East Avenue
and Changhe Avenue.
Because the plants
in the green belts of urban areas in Dezhou City are mainly trees and shrubs
with deep root systems, and the soil available N and P levels are low in deep
soils, this may impose limitations on the long-term growth of plants.
Therefore, organic fertilizers and deep-applications of chemical fertilizers should
be targeted in combination with road differentiation to improve soil fertility
and optimize the greening effect.
Table 3 Differences in the chemical properties of
soil in the green belts of different roads
|
|
pH
|
Salinilty
(g/kg)
|
Organic matter
(g/kg)
|
Available N
(mg/kg)
|
Available P
(mg/kg)
|
Available K
(mg/kg)
|
|
Chahe East Avenue
|
(8.7??0.45)b
|
(3.2??0.85)a
|
(4.19??3.33)a
|
(52.9??35.41)a
|
(3.27??1.52)ab
|
(104.3??52.51)bc
|
|
Chahe West Avenue
|
(9.05??0.34)a
|
(2.92??1.17)ab
|
(5.63??2.08)a
|
(23.2??8.33)b
|
(4.9??2.13)ab
|
(121.11??51.88)abc
|
|
Dongfeng Road
|
(8.9??0.34)ab
|
(2.61??3.15)ab
|
(5.98??2.77)a
|
(47.11??47.45)a
|
(8??11.14)a
|
(124.87??95.33)ab
|
|
Hubin Avenue
|
(8.7??0.21)b
|
(1.92??0.89)b
|
(6.43??1.61)a
|
(33.82??20.68)ab
|
(4.5??1.53)ab
|
(114.75??57.66)abc
|
|
Tianqu Road
|
(8.82??0.33)ab
|
(2.93??1.71)ab
|
(5.82??3.33)a
|
(43.91??30.15)ab
|
(7.55??13.79)ab
|
(170??110.02)a
|
|
Changhe Avenue
|
(8.82??0.31)ab
|
(1.94??0.58)b
|
(6.22??2.29)a
|
(31.93??17.37)ab
|
(3.64??1.68)ab
|
(81.52??24.27)bc
|
Note: a, b,
and c indicate significant differences at the 0.05 level.
4.2.3 Comprehensive Evaluation of Soil Fertility
The
fertility composite index of the top soil layer (0−20 cm) of the green belt in
the urban area of Dezhou was 0.54, which was classed as relatively poor (Table 4).
The average membership degree values of soil pH and organic matter were 0.1 and
0.17, respectively (Table 5). These values were significantly smaller than the
membership degree values of the other indexes, which indicates that soil pH and
organic matter were the limiting factors of soil fertility. The composite index
of fertility of the lower soil layers (20−40, 40−60, 60−80, and 80−100 cm)
ranged from 0.1 to 0.3, which was classed as poor (Table 4). The limiting
factors of soil fertility were different for the different soil layers (Table 5),
with soil pH and organic matter being the main limiting factors.
The soil fertility
index of different roadside green belt soils was in the range of 0.12−0.35,
which was classed as poor (Table 6). The fertility-limiting factors of
different roadside green belt soils were slightly different (Table 7). Soil pH
and organic matter, with an average membership value of 0.1, were the main
limiting factors for soil fertility for all roadside green belts.
Table 4 Soil fertility evaluation index in
different soil layers
|
Soil
layer (cm)
|
0−20
|
20−40
|
40−60
|
60−80
|
80−100
|
0−100
|
|
IFI
|
0.54
|
0.10
|
0.12
|
0.12
|
0.30
|
0.24
|
|
Level
|
Relatively poor
|
Poor
|
Poor
|
Poor
|
Poor
|
Poor
|
Table 5 Average membership degree of soil
indicators in different soil layers
|
Soil layer
(cm)
|
Average
membership degree
|
|
pH
|
Salinity
|
Organic matter
|
Available N
|
Available P
|
Available K
|
|
0−20
|
0.10
|
0.33
|
0.18
|
1.00
|
0.88
|
0.78
|
|
20−40
|
0.10
|
0.10
|
0.11
|
0.10
|
0.10
|
0.11
|
|
40−60
|
0.10
|
0.18
|
0.10
|
0.19
|
0.10
|
0.10
|
|
60−80
|
0.10
|
0.12
|
0.10
|
0.28
|
0.10
|
0.10
|
|
80−100
|
0.10
|
0.72
|
0.10
|
0.77
|
0.10
|
0.10
|
|
0−100
|
0.10
|
0.28
|
0.10
|
0.51
|
0.17
|
0.17
|
Table 6 Soil fertility evaluation index in
different roads
|
|
Chahe East
Avenue
|
Chahe West
Avenue
|
Dongfeng
Road
|
Hubin Avenue
|
Tianqu Road
|
Changhe
Avenue
|
|
IFI
|
0.26
|
0.18
|
0.32
|
0.15
|
0.35
|
0.12
|
|
Level
|
Poor
|
Poor
|
Poor
|
Poor
|
Poor
|
Poor
|
Table 7 Average membership degree of soil
indicators in different roads
|
Road
|
Average
membership degree
|
|
pH
|
Salinity
|
Organic matter
|
Available N
|
Available P
|
Available K
|
|
Chahe East Avenue
|
0.10
|
0.46
|
0.10
|
0.79
|
0.10
|
0.14
|
|
Chahe West Avenue
|
0.10
|
0.38
|
0.10
|
0.10
|
0.10
|
0.29
|
|
Dongfeng Road
|
0.10
|
0.28
|
0.10
|
0.61
|
0.37
|
0.32
|
|
Hubin Avenue
|
0.10
|
0.10
|
0.13
|
0.21
|
0.10
|
0.23
|
|
Tianqu Road
|
0.10
|
0.38
|
0.10
|
0.52
|
0.33
|
0.73
|
|
Changhe Avenue
|
0.10
|
0.10
|
0.11
|
0.16
|
0.10
|
0.10
|
5 Conclusion
Based
on measured data, this dataset systematically compiled the main nutrient
indicators of green belt soils in the urban area of Dezhou City, including pH,
salinity, organic matter, available N, available P, and available K. Through a
statistical analysis and evaluation of the membership function of the measured
data, the soil nutrient status of the soil in the urban green belts of Dezhou
City was determined for different soil layers and roads. The following
conclusions were drawn.
(1) The pH of
the soil in the green belt in the urban area of Dezhou City was >8.5,
indicating a strongly alkaline soil. The mean soil salinity was 2.6 g/kg, and
the salinization level of the different roads was classed as mild to moderate.
(2) The mean
organic matter content was 5.53 g/kg, which was classed as poor. The overall
soil available N and P were classed as poor, and soil available K was classed
as relatively rich. Soil organic matter and the available N, P, and K were
significantly lower in the lower soil layers than in the surface soil.
(3) The
fertility level of the green belt soil (0−100 cm) in the urban area of Dezhou
City was poor. Both soil pH and organic matter were limiting factors for soil
fertility. It was therefore recommended to implement targeted measures, such as
salt leaching, the application of chemical amendments (e.g., gypsum), and the
increased deep placement of organic and chemical fertilizers.
Author Contributions
Hu, H. Y. conducted the overall design of the dataset. Wang,
Z. B. and Li, B. B. collected and processed the soil nutrient data from the
greenbelts in urban areas of Dezhou. Hu, H. Y. designed the evaluation model. Fan,
Z. X. and Li, B. B. verified the accuracy and authenticity of the data. Hu, H.
Y. and Wang, Z. B. wrote the data paper.
Conflicts of Interest
The
authors declare no conflicts of interest.
References
[1]
Feng, J.,
Qiao, Z. H., Yan, Q. B., et al. Effects
of urbanization and green space types on soil springtail communities and
functional traits [J]. Acta Ecologica Sinica, 2024, 44(6): 2582?C2596.
[2]
Casado-Arzuaga, I., Madariaga, I., Onaindia, M. Perception, demand and
user contribution to ecosystem services in the bilbao metropolitan greenbelt
[J]. Journal of Environmental Management, 2013, 129: 33?C43.
[3]
Arif, M.,
Qi, Y., Dong, Z., et al. Rapid
retrieval of cadmium and lead content from urban greenbelt zones using
hyperspectral characteristic bands [J]. Journal of Cleaner Production,
2022, 374: 133922.
[4]
Ao, G.,
Qin, W., Wang, X., et al. Linking the
rhizosphere effects of 12 woody species on soil microbial activities with soil
and root nitrogen status [J]. Rhizosphere, 2023, 28: 100809.
[5]
Bai, L. Z.
Comprehensive evaluation of soil fertility in road greenbelts of Miyun
District, Beijing [J]. Modern Horticulture, 2024, 47(8): 39?C40.
[6]
Ge, Y.,
Liu, Y. Q., Cong, Y. P., et al.
Evaluation of surface soil fertility quality in the Summer Palace green space
[J]. Journal of Nanjing Forestry University (Natural Science Edition),
2023, 47(3): 182?C190.
[7]
Jia, L. M.,
An, W. Y., Meng, Q. X. Causes and control strategies of pests and diseases in
highway greenbelts of Baoding City [J]. Hebei Forestry, 2021(1): 31?C32.
[8]
Li, M.,
Zheng, L. X. Impacts of winery wastewater irrigation on soil microbial
communities in urban greenbelts [J]. Jiangsu Agricultural Sciences,
2021, 49(22): 228?C235.
[9]
Liu, D. X.
Investigation and control strategies of major pests and diseases in Fuzhou
highway greenbelts [J]. Fujian Transportation Science and Technology,
2020(3): 50?C51.
[10]
Hu, Y. P.,
Zhao, Y. Y., Luo, Y. K., et al.
Analysis of tea tree mortality in the greenbelt of Chayuan Road, Simao District
[J]. Yunnan Agricultural Science and Technology, 2021(4): 45?C46.
[11]
Ni, H. M.
Analysis of soil improvement effects in road greenbelts of Pudong New Area,
Shanghai [J]. Agricultural Science-Technology and Information (Modern
Landscape Architecture), 2014(12): 31?C34.
[12]
Tang, J. F.,
Sun, L. M., Li, C. B., et al. Soil
nutrient status and obstacle factors in highway greenbelts of Xinyang City [J].
Journal of Anhui Agricultural Sciences, 2006, 34(16): 4045?C4046.
[13]
Zhou, W., Wang, W. J., Zhang, B., et
al. Soil fertility evaluation of urban forest green spaces in Changchun
[J]. Acta Ecologica Sinica,
2017, 37(4): 1211?C1220.
[14]
Zhang, J. T.,
Li, T., Xian, Z. H., et al. Soil quality
evaluation and characteristics of different green space types in Nansha District,
Guangzhou [J]. Acta Agriculturae Jiangxi, 2020, 32(9): 85?C90.
[15]
Zhao, M. X.,
Cao, Y. Y., Jiao, J. B., et al. Soil
fertility quality evaluation of road green spaces in Yan??an New District (North
Zone) [J]. Chinese Agricultural Science Bulletin, 2018, 34(27): 130?C136.
[16]
An, K.,
Xie, X. P., Zhang, H. Z., et al.
Spatial patterns of soil fertility and their influencing factors in the West Lake
Scenic Area [J]. Chinese Journal of Ecology, 2015, 34(4): 1091?C1096.
[17]
Li, J.,
Yang, M. Y., Yang, N. Comprehensive evaluation of soil quality under different
land use patterns in purple soil hill restoration areas [J]. Acta Agrestia
Sinica, 2024, 32 (9): 2875?C2883.
[18]
Wang, X. X.,
Gou, J. Y., Liu, J., et al.
Comprehensive evaluation and spatial distribution of tobacco-growing soil
fertility in Zunyi City [J]. Soil and Fertilizer Sciences in China,
2024(2): 1?C9.
[19]
Yu, S. P.,
Xiong, Y. B., Liao, T., et al.
Comprehensive evaluation of tobacco soil fertility improvement through
continuous fertilizer reduction combined with organic fertilizer application
[J]. Soil and Fertilizer Sciences in China, 2024(1): 70?C78.
[20]
Chen, J., Li, Y. F., Wu, C. H. Basic physicochemical characteristics
and fertility evaluation of green space soils in Jianyang central urban area
[J]. Journal of Yichun University, 2024, 46(3): 72?C77.
[21]
Hu, H. Y., Li, B. B. In situ dataset of soil nutrients in urban green belts of Dezhou City, China (2024) [J/DB/OL]. Digital Journal of Global Change Data
Repository, 2025. https://doi.org/10.3974/geodb.
2025.03.07.V1.
[22]
GCdataPR Editorial Ofice. GCdataPR data sharing
policy [OL]. https://doi.org/10.3974/dp.policy.2014.05
(Updated
2017).
[23]
Bao, S. D. Soil
Agro-chemical Analysis (3rd Edition) [M]. Beijing: China Agricultural Press,
2022.
[24]
Zhang, Z. Q.,
Jiao, J. Y., Chen, T. D., et al. Soil
nutrient evaluation of alluvial fans in the middle-lower reaches of Lhasa River
Basin [J]. Journal of Plant Nutrition and Fertilizers, 2022, 28(11):
2082?C2096.
[25] Zhang, L., Zhang, S.
Effects of soil pH on the growth of greening trees [J]. Jiangxi Agriculture,
2018(16): 92, 97.
[26]
Han, D.
Soil organic carbon changes of croplands in the north China plain in recent 30
years and its management strategy analysis [D]. Beijing: University of Chinese
Academy of Sciences, 2018.
[27]
Lim, S.,
Yang, H. I., Park, H., et al.
Land-use management for sustainable rice production and carbon sequestration in
reclaimed coastal tideland soils of South Korea: a review [J]. Soil Science
and Plant Nutrition, 2020, 66(1): 60?C75.
[28]
Wang, H. D.
Evaluation of green space soil quality in Lingang New Area, Shanghai [J]. Urban
Roads Bridges & Flood Control, 2023(7): 314?C318.
[29]
George, E.,
Seith, B. Long-term effects of a high nitrogen supply to soil on the growth and
nutritional status of young Norway spruce trees [J]. Environmental Pollution,
1998, 102(2): 301?C306.
[30]
Sahin, U.,
Ekinci, M., Ors, S., et al. Effects
of individual and combined effects of salinity and drought on physiological,
nutritional and biochemical properties of cabbage (Brassica oleracea var.
capitata) [J]. Scientia Horticulturae, 2018, 240: 196?C204.
[31]
Tang, H., Niu, L., Wei, J., et al. Phosphorus limitation improved
salt tolerance in maize through tissue mass density increase, osmolytes
accumulation, and Na+ uptake inhibition [J]. Frontiers in Plant Science,
2019(10): 856.
[32]
von
Tucher, S., Hörndl, D., Schmidhalter, U. Interaction of soil ph and phosphorus
efficacy: long-term effects of p fertilizer and lime applications on wheat,
barley, and sugar beet [J]. Ambio, 2018, 47(1): 41?C49.