Monthly Mean Surface Air Temperature 2??´2?? Grid Dataset in
China (1961-2015)
Wen, K. M.1 Ren, G. Y.2, 3* Li, J.4 Ren, Y. Y.3 Zheng, X. L.1 Sun, X. B.5 Zhou, Y. Q.6
1. Fuzhou Meteorological Bureau, Fuzhou 350000, China;
2. Department of Atmospheric Science, School of
Environmental Studies, China University of Geosciences, Wuhan 430074, China;
3. Laboratory for Climate Studies, National Climate Center,
China Meteorological Administration, Beijing 100081, China;
4. Tieling Meteorological Bureau, Liaoning Province,
Tieling 112000, China;
5. South China Sea Institute of Oceanology, Chinese Academy
of Sciences, Guangzhou 510000, China;
6. Jinzhong Meteorological Bureau of Shanxi Province,
Jinzhong 030600, China
Abstract: Based on the national surface meteorological station homogenized
monthly temperature dataset provided by the National Meteorological Information
Center of China Meteorological Administration, the 684 meteorological stations
were selected as the target stations. First, establish a reference sequence for
each target station. Then, use the difference between the target station
sequence trend and the reference sequence trend as the correction value to
linearly correct the temperature series of target station, using the corrected
684 target stations plus 79 rural stations for a total of 763 stations.
Finally, the inverse distance weight interpolation method was used to
interpolate the temperature data of 763 stations nationwide into 2??x 2?? grid
point data. The research results shows that taking Beijing, Wuhan, Yinchuan,
and Shenzhen as representative stations of large cities in North China, Central
China, Northwest China, and South China, it was found that their relative
urbanization bias in the past 55 years were 67.0%, 75.4%, 32.7%, and 50.3%,
respectively. This matched the results of assessing of the impact of
urbanization on a single station by predecessors basically. The dataset was archived
in .txt format. Each file name was titled according to the year and month. Each
file consisted of a header file and 18 rows and 32 columns of average
temperature (ºC) data. The first 6 rows were header files,
which were the number of columns and rows, the longitude of the bottom left
grid point, the latitude of the bottom left grid point, the grid size, and the
missing value. The dataset consisted of 660 data files with data size of 2.75
MB (compressed into 1 file, 895 KB).
Keywords: national
stations; surface air temperature; monthly mean temperature; urbanization;
1961‒2015
Dataset Availability Statement:
The
dataset supporting this paper was published and is accessible through the Digital Journal of Global Change Data Repository at: https://doi.org/10.3974/geodb.2019.06.08.V1.
1 Introduction
Climate
change monitoring and detection require reliable long-series surface air temperature
observation data as basic data. However, the impact of urbanization has become
one of the most important sources of systematic errors in the surface air temperature
observation data of global terrestrial regions[1?C4].
After the reform and opening up, on the one hand, China has gradually loosened
its original control over population mobility. Urban construction has created a
large number of jobs in construction and industry. The number of migrant
workers entering the city has increased year by year. With the popularization
of private cars, this has promoted. The rapid development of highways, on the
other hand, people??s requirements for environmental quality has gradually
increased, and infrastructure in rural areas and small towns has gradually
improved, all of which have intensified the process of urbanization in rural
areas. With the development of urbanization, the monitoring environment around
the national stations has also changed a lot. The surrounding environment of
many stations has gradually evolved from remote villages to towns or suburbs.
Therefore, most of the basic surface air temperature data used in climate
change research in China have been affected by urbanization. For example, since
1961 at the Beijing Station, the urbanization bias in the national station surface
air temperature observation data has reached 71.0%[5].
In the field of climate change research in China, the basic data used generally
come from the national reference climate and basic meteorological stations
(referred to as the national station in this article). The regional studies have
shown that the surface air temperature data sequence of this observation
network was largely affected by the strengthening factors of the urban heat
island effect, and exits a large system bias. Therefore, the dataset used the
homogenized monthly surface air temperature data from 763 national meteorological
stations and 143 villages stations as the main data
source. Based on the assumption that the influence of urbanization on the
average surface air temperature trend of the target station was linearly increasing,
a method of iterative correction from east to west was proposed[6],
which gave specific reference station (rural station) for each national station
and its urbanization bias, and evaluate the distribution and changes of the
urbanization bias from 1961 to 2015 of national stations in China on this
basis, developed the grid dataset of monthly mean surface air temperature in
China from 1961 to 2015 based on adjusting urbanization-bias.
2 Metadata of the Dataset
The metadata of the Adjusted urbanization bias monthly
temperature dataset based on the records from the national meteorological
stations of China (1961?C2015)[7]
is summarized in Table 1. It includes the dataset full name, short name,
authors, year of the dataset, temporal resolution, spatial resolution, data
format, data size, data files, data publisher, and data sharing policy, etc.
Table 1 Metadata
summary of the Adjusted urbanization bias monthly temperature dataset based on
the records from the national meteorological stations of China (1961?C2015)
|
Item
|
Description
|
|
Dataset name
|
Adjusted urbanization bias
monthly temperature dataset based on the records from the national
meteorological stations of China (1961?C2015)
|
|
Dataset short name
|
AdjustedUrbanBiasMonTemChina_1961-2015
|
|
Author information
|
Wen, K. M. E-8903-2019,
Fuzhou Meteorological Bureau, Wenkangmin@126.com
Ren, G. Y. J-9953-2012, School
of Environmental Studies, China University of Geosciences, National Climate
Center, Guoyoo@cma.gov.cn
Li, J. Aac-5450-2021, Tieling
Meteorological Bureau, Lijiaostu@163.com
Zhang, A. Y. AAW-6017-2021, Beijing Meteorological
Bureau, zhangay66@sohu.com
Ren, Y. Y. Aac-3663-2021,
National Climate Center, Renyuyu@126.com
Sun, X. B. Aac-3839-2021,
South China Sea Institute of Oceanology, Chinese Academy of Sciences, 165546192@qq.com
Zhou, Y. Q. AAC-3645-2021, Jinzhong
Meteorological Bureau, Zhouyqsx@126.Com
|
|
Geographic area
|
Chinese Mainland
Year 1961‒2015
|
|
Time resolution
|
Month
Spatial resolution 2??´2??
Data format .txt
|
|
Data volume
|
The data volume is 2.75MB
(compressed into a file, 895KB)
|
|
Data file
|
Grid data of surface air
temperature corrected for urbanization bias from January 1961 to December
2015
|
|
Foudations
|
Ministry of Science and
Technology of P. R. China (2018YFA0605603); National Natural Science
Foundation of China (41575003)
|
|
Data
computing environment
|
ArcGIS
|
|
Publishing and sharing service
platform
|
Global Change Scientific
Research Data Publishing System http://www.geodoi.ac.cn
|
|
Address
|
No. 11, Datun Road, Chaoyang
District, Beijing 100101, Institute of Geographic Sciences and Natural
Resources Research, Chinese Academy of Sciences
|
|
Data sharing policy
|
Data from
the Global Change Research Data Publishing & Repository includes metadata, datasets (in the Digital Journal of Global Change Data Repository), and
publications (in the Journal of Global Change Data & Discovery). Data sharing policy
includes: (1) Data are openly available and can be free downloaded via the
Internet; (2) End users are encouraged to use Data subject to
citation; (3) Users, who are by definition also value-added service providers,
are welcome to redistribute Data subject to written permission
from the GCdataPR Editorial Office and the issuance of a Data redistribution
license; and (4) If Data are used to compile new
datasets, the ??ten per cent principal?? should be followed such that Data
records utilized should not surpass 10% of the new dataset contents, while
sources should be clearly noted in suitable places in the new dataset8]
|
|
Communication and searchable system
|
DOI, DCI, CSCD, WDS/ISC,
GEOSS, China GEOSS, Crossref
|
3 Data development Method
3.1 Introduction and Data Preprocessing
3.1.1 Basic Data from the National Meteorological Stations
The
National Meteorological Information Center of the China Meteorological Administration
provides the National Ground Meteorological Stations homogenized monthly temperature
dataset[9], which Contains 2,419
national-level stations in China from 1951 to 2016 homogenized monthly mean
temperature, mean maximum and mean minimum temperature. Due to the lack of data
before 1961 and 2016, the period from 1961 to 2015 was regarded as the research
period. Then, ensure that the data missing rate from 1961 to 2015 was not more
than 2%, and a total of 763 national stations meet the requirements. The missing
values in the national station were replaced by the average value of the five
years before and after dating, and a total of 10 years. For 79 national
stations among the 143 reference stations, we excluded them from the selected
763 national stations. Therefore, a total of 685 national stations were used
for urbanization bias correction in this study.
3.1.2 Data of Reference Station
The
network of 143 rural stations in China established by Ren et al. (2010) and Ren et al.
(2015)[10?C11] was selected
from 2,400 long-sequence observation stations across the country. The
information such as the beginning and ending years of station data and the
continuity of observation, the population of the settlement, the relocation of
the station, the distance between the station and the nearby town center, and
the ratio of artificial buildings within a 12 km2 area around the
observation site were considered. The monthly mean surface air temperature data
of rural stations also comes from the National Meteorological Information
Center of the China Meteorological Administration. For the missing data in a
few stations, it was also replaced by the 10-year average value of 5 years
before and after the missing year.
3.2 Technical Route
3.2.1 Determination of the Corresponding Reference Station for the City
Station
When
constructing the reference stations of each national station, we took example
from the neighbor station selection method of the spatial consistency check of
climate data quality control[12?C14].
Taking a station as the center and a reference station within a certain fixed radius
as the reference station of the national station, the distance between the two
was calculated as:
 (1)
(1)
where and
and were the longitude and latitude of the point
  (national
station) respectively;
(national
station) respectively;  and
and  were the
longitude and latitude of the point
were the
longitude and latitude of the point  (country station)
respectively;
(country station)
respectively;  represented the radius of the earth, and the average value
was about 6,371 km.
represented the radius of the earth, and the average value
was about 6,371 km.
First of all, ensure that the distance between the
rural station and the national station was no more than 300 km. Secondly, in
order to ensure appropriate rural stations could be selected for national
stations in Northeast China and the central and western regions of the
Qinghai-Tibet Plateau where rural stations were scarce, we used the correction
method of iterating from east to west by longitude to correct the urbanization
bias in the national stations. The adjusted national station could be used as a
subsequent adjusting rural station.
The detrended temperature series mainly represents the
variability of surface air temperature on interannual and interdecadal scales.
After detrending, the correlation coefficient of the annual mean temperature of
the national station and the rural station was used as a judgment index to
ensure that the candidate rural station and the national station were at the
same subregion of natural climate. Calculate the correlation coefficients
between the detrended annual and monthly mean temperatures of each national
station and its candidate rural stations. If the correlation coefficient passed
the significance test with a confidence level of 0.005 (t0.005 = 0.364), the rural station could be used as a reference
station of national station.
3.2.2 Establishment of
Reference Sequence of City Station
This paper stipulated that
when the number of reference stations of the target station was more than 4,
the 4 stations with the highest correlation would be the final reference stations
according to the correlation coefficient of the detrended annual mean
temperature; when the number of reference stations was less than or equal to 4,
all will be retained. For each target station, the detrending correlation
coefficient of the monthly mean temperature series of each reference station
and the target station was used as the weight, and the weighted average of the
monthly mean surface air temperature of all reference stations was calculated
to obtain the reference sequence of monthly mean surface air temperature of
each target station from 1961 to 2015.
3.2.3 Correction Method
of Urbanization Bias
This method was based on two
assumptions: (1) the linear trend of the established reference temperature
series of a target station represented the large-scale background temperature
change trend of the region; (2) the influence of urbanization on the average
surface air temperature trend of the target station was linearly increased,
namely this influence was similar in different years and decades. Taking the
last year of the target station sequence (here, 2015) as the benchmark, the
annual mean urbanization bias was sequentially added forwards. The correcting
sequence took the current temperature of the station and the next few years as
fixed values, and the new temperature data would have better scalability in the
next few years (Equation (3)).
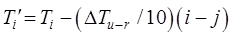 (2)
(2)
 (3)
(3)
where was the corrected temperature,
  was the
temperature before correction,
was the
temperature before correction,  was the difference of the climate trend between the target
station and the reference station during the entire period, namely the
urbanization bias (ºC/10a), i represented the
corrected year, j and k represened the start and end year of
temperature series respectively.
was the difference of the climate trend between the target
station and the reference station during the entire period, namely the
urbanization bias (ºC/10a), i represented the
corrected year, j and k represened the start and end year of
temperature series respectively.
4 Data Results and
Verification
4.1 Dataset Composition
The grid dataset of monthly
mean surface air temperature in Mainland China based on the correction of
urbanization bias was a grid dataset of the corrected urbanization bias of
monthly surface air temperature in Mainland China from January 1961 to December
2015, with a spatial resolution of 2????2??, the unit was ºC, the total compressed
data size was 895 KB, and there were 660 files after the data was decompressed.
The file 196201 represented January 1962. This data was used in ArcGIS
software.
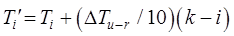
Figure 1 showed the spatial distribution of surface
air temperature corrected for urbanization bias at 2????2?? resolution in Mainland
China in January 1962. There were differences in regional climate,
the spatial distribution of surface air temperature was quite different. On the
whole, the spatial distribution of surface air temperature (January 1962) had
the characteristics of high in the south and low in the north, and their value
are between ?C26.46 ºC and 15.84 ºC. The surface air temperature in
South China was the highest, followed by the region of Southwest to North
China, and the lowest surface air temperature occurs in northern Northeast
China.
4.2 Data Results
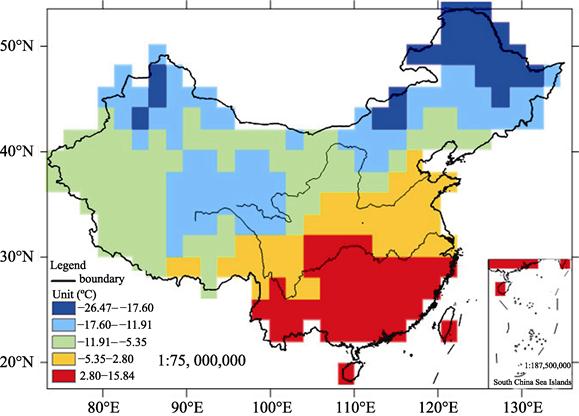
The spatial distribution of
the grid annual mean temperature trend in China from 1961 to 2015 is shown in Figure 2. In the past 55 years, parts of central China and parts of Southwest Chinahad
grown at a rate of 0?C0.1 ºC/10a,
making it the weakest warming area in China; North China except Inner Mongolia,
Southwest China except Tibet, and most of South China, the annual mean
temperature increased at a rate of 0.1?C0.2 ºC/10a;
Figure
1 Spatial
distribution of grid mean temperature in China in January 1962
|
Figure 2 The
spatial distribution of the grid annual mean temperature trend in China
|
In
northern Northeast China, eastern Inner Mongolia, northwestern Liaoning,
Qinghai, southern and western Xinjiang, and northern Tibet, the annual mean
temperature increased at a rate of 0.3?C0.4 ºC/10a. Most of
the remaining areas, including most of East China,
most of Northeast China, Inner Mongolia, parts of Shaanxi, most of Xinjiang,
and southern Tibet, annual mean temperature increased at a rate of 0.2?C0.3 ºC/10a, while parts of western Tibet
showed the greatest warming trend, which was 0.4?C0.51 ºC/10a.
From the perspective of seasonal changes (Figure 3),
from 1961 to 2015, the spring mean temperature increased only 0?C0.1 ºC/10a in parts of Southwest China. In most Southwest China
except for Tibet, central China, Guangdong, Hainan, the warming rate was
0.1?C0.2 ºC/10a; while in Jiangsu,
Zhejiang, Inner Mongolia, central Northeast China, northern and southwestern
Xinjiang, the warming rate was 0.3?C0.4 ºC/10a; the largest
rates were occurred in northern Northeast China, parts of eastern and western
Inner Mongolia, it reached 0.4?C0.5 ºC/10a; the largest
warming area was western Tibet, above 0.5 ºC/10a; in the rest areas, it was between 0.2?C0.3 ºC/10a.
The summer mean temperature in China had an obvious
feature, that is, most of central China decreased at a rate of ?C0.1?C0 ºC/10a. Most parts of South China, North China except Inner
Mongolia and Shaanxi, parts of Southwest China, parts of east China, and parts
of western Xinjiang increased at a rate of 0?C0.1 ºC/10a; In Hainan, southeast coast area, Jiangsu and Zhejiang, southern Inner
Mongolia, eastern and southern Northeast China, parts of Southwest China and
parts of western Xinjiang, summer mean temperature increased at a rate of
0.1?C0.2 ºC/10a; the regions with a warming
rate above 0.3 ºC/10a included the
northern part of the Northeast China, the eastern part of Inner Mongolia,
Qinghai, and the northwestern part of Tibet; the remaining areas included the
most Northeast China, most Northwest China and most Inner Mongolia, it
increased at a rate of 0.2?C0.3 ºC/10a.
The autumn mean temperature in Northeast China, most
of East China, Inner Mongolia, Xinjiang, southern Tibet, Shaanxi, and Hainan
increased at a rate of 0.2?C0.3 ºC/10a; in northern
Tibet, central Qinghai, southeastern and northwestern Xinjiang, it increased at
a rate of 0.3?C0.4 ºC/10a, and the weakest warming of
0?C0.1 ºC/10a occurred in parts of the
Southwest China extend to parts of North China; In Southwest China except Tibet,
most of South China, parts of central and North China, northern Northeast China
and a few areas of North China, the warming rates were 0.1?C0.2 ºC/10a, and the warming trend greater than 0.3?C0.4 ºC/10a appeared in Qinghai, northern Tibet, and parts of northern Xinjiang; the
warming trend greater than 0.4 ºC/10a appeared in
western Tibet.
The winter mean temperature increased by
0.1?C0.2 ºC/10a in parts of central China,
parts of South China and Southwest China, and a few areas in central and
northern Xinjiang, which was the weakest warming area in winter, and in some
areas it increased by 0?C0.1 ºC/10a; In southeast coastal
areas, parts of Jiangsu, most Northeast China, northern North China, and
central Tibet, it increased by 0.3?C0.4 ºC/10a; winter warming
rates of 0.4?C0.61 ºC/10a appeared in the central and
parts of northern Northeast China, eastern and western Tibet, Qinghai and parts
of Gansu, the rest included most of East China, South China, southern Northeast
China, eastern Inner Mongolia, North China and parts of Southwest China, and
most of Xinjiang with an increased trend of 0.2?C0.3 ºC/10a.
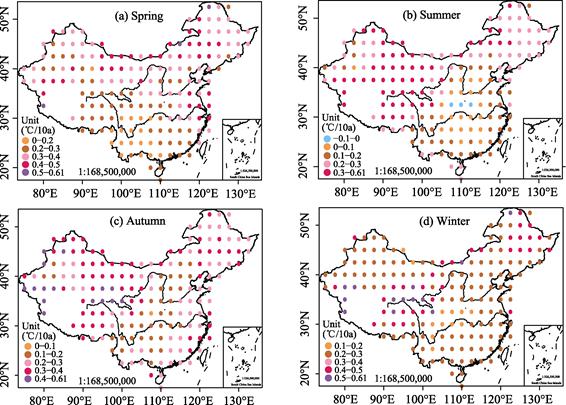
Figure
3 Spatial
distribution of grid seasonal mean temperature trends in China
Figure 4 indicates the annual
mean anomaly curve in China calculated using 763 national stations removed urbanization
bias. The regional anomaly decreased before 1969. The temperature anomaly from
1969 to 1987 did not change much, and it was a stable period. After 1987, there
was a period of rapid increase, and larger
temperature anomalies appeared during this period. The late 1980s was a
period of interdecadal transition when the regional average anomaly changed
from negative to positive.
From the perspective of the
interdecadal variation of the seasonal mean anomaly (Figure 5), it was not
difficult to find that the average anomaly curve of each season showed a relatively
obvious downward trend before the mid to late 1970s; it gradually entered a
relatively warm period in the mid to late 1990s, the seasonal anomaly values
were greater than 0 in the
|
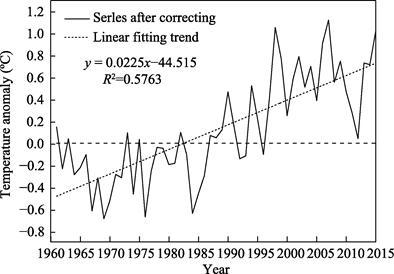
Figure 4 Annual anomaly sequence curve removed urbanization bias in
China
|
majority. Spring temperature anomaly
basically fluctuated around the zero value line before the mid to late 1990s.
From the end of the 1990s, the spring mean temperature anomaly was above the
zero value line, and the anomaly values fluctuated within a large positive range.
Summer mean anomaly had similar evolution characteristics to that in spring.
Before the mid-1990s, most of the regional anomalies were close to 0, and then
until 2015, the regional anomalies were all greater than 0, and their values
were larger. Before the mid-1970s, the summer temperature anomaly showed a
slight downward trend. From the mid-to-late 1970s to the mid-1990s, the summer
temperature anomaly fluctuated very little. Autumn temperature anomalies were
mostly less than 0 before the mid-1990s. After the mid-1990s, autumn
temperature anomalies were mostly greater than 0, and the anomalies were
relatively large. Most winter temperature anomalies were less than 0 before the
end of the 1980s, and the values were relatively small, and after the end of
the 1980s, most of the temperature anomalies were greater than 0.
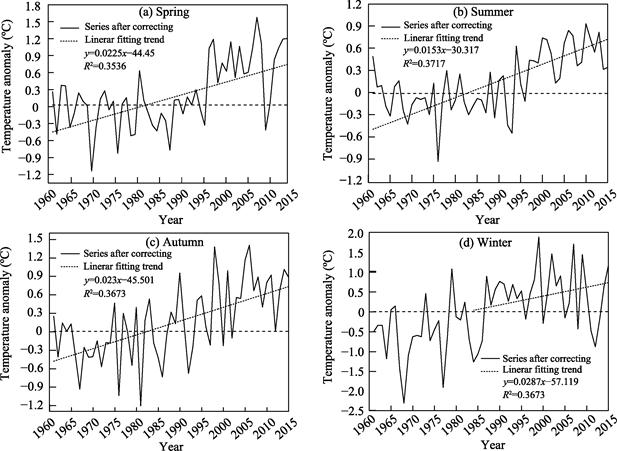
Figure
5 The seasonal
anomalies sequence curve removed urbanization bias in China
4.3 Data Validation
By comparing with the
methods of evaluating the urbanization bias in single station developed by
previous scholars, it verified the rationality of the method of correcting
urbanization bias and the results obtained in this article. Considering the
availability of data and the uniformity of station distribution, Beijing,
Wuhan, Yinchuan and Shenzhen were selected as representative metropolitan
stations in North China, Central China, Northwest China, and South China to
test the corrected results.
The analysis results of this
paper were very consistent with those of Chu et al.[15] corrected
1961?C2000 and Yan et al.[16]
estimated that the urbanization bias from 1977 to 2006 in Beijing Station;and
compared with the results of Ren et al.
and Chen et al.[17?C18] corrected Wuhan Station, Li et al.[19] corrected Yinchuan
station, and Chen et al., Zhang et al., and Si et al.[20?C22] corrected Shenzhen station. Due to the difference of reference stations,
the method of selecting reference stations, the length of reference sequence,
and the study time range, it was found that the corrected conclusions obtained
in this paper were consistent with those obtained by predecessors.
5 Discussion and Summary
Based
on the assumption that the influence of urbanization on the trend of surface
air temperature of national stations was linearly increasing, by using the
dataset of ?? Adjusted
urbanization bias monthly temperature dataset based on the records from the national
meteorological stations of China (1961-2015)??
provided by the National Meteorological Information Center of the China
Meteorological Administration, and the 143 rural stations developed by the
research group, using the method of comparing cities and villages, and correction
from east to west by longitude, corrected the urbanization bias in the temperature
series for more than half a century in China, and obtained some benefits
discoveries. The results showed that, compared with the scattered distribution
of surface air temperature changes in China before the correction of
urbanization bias, the temperature evolution trend was relatively concentrated
after the correction, showing a belt shape, which was more consistent with the
actual climate change and the distribution of climate zones in China. In addition,
the warming trend in China had been widely and significantly reduced after
correcting urbanization bias, indicating that the surface air temperature
records of national stations in China contained obvious urbanization bias.
Larger bias were distributed in North China, Central China, northern Northeast
China, parts of Southwest China, Xinjiang and parts of Tibet, with the values
of 0.1?C0.3 ºC/10a;
by using the grid area weighting method[23], the relative
urbanization bias in surface air temperature series in China was estimated to
be 19.6%.
This dataset was
to correct the urbanization bias in the surface air temperature of the national
stations on the basis of the station, and basically eliminate the impact of the
urbanization bias. Analysis of modern climate change based on this dataset, the
temporal and spatial change trends characteristics of the countrywide and
regional surface air temperature obtained were relatively realistic. Therefore,
on the one hand, this dataset had significant significance for climate change
monitoring, detection and simulation research. On the other hand, it also had
important value for climate change impact assessment. The informations of
regional background climate change required for climate change impact
assessment in the field of water resources and agriculture, this dataset could
meet the requirements.
Author Contributions
Ren, G. Y. made an overall design for the
development of the dataset. Li, J. and Zhou, Y. Q. designed the algorithms of
dataset. Wen, K. M. contributed to the data processing and analysis. Ren, Y. Y.
did the data verification. Wen, K. M., Zheng, X. L. and Sun, X. B. wrote the
data paper.
Conflicts of Interest
The authors
declare no conflicts of interest.
References
[1]
Ren, G. Y.,
Zhou, Y. Q., Chu, Z. Y., et al. Urbanization
effect on observed surface air temperature trends in North China [J]. Journal of Climate, 2008, 21: 1333‒1348.
[2]
Zhang, A. Y, Ren, G. Y., Zhou, J. X.,
et al. Urbanization effect on surface
air temperature trends over China [J]. Acta
Meteor Sinica, 2010, 68(6): 957?C966.
[3]
Yang, X. C.,
Hou, Y. L., Chen, B. D. Observed surface
warming induced by urbanization in east China [J]. Journal of Geophysical Research, 2011, 116: D14113.
[4]
Wang, J., Tett,
S. F. B., Yan, Z. W. Correcting urban bias in large-scale temperature records
in China, 1980?C2009 [J]. Geophysical
Research Letters, 2017, 44: 401?C408.
[5]
Chu, Z. Y., Ren, G. Y. Change in
urban heat island magnitude and its effect on mean air temperature record in
Beijing region [J]. Acta Meteor Sinica,
2005, 63(4): 534?C540.
[6]
Wen, K. M., Ren, G. Y., Li, J., et al. Adjustment of urbanization bias
in surface air temperature over mainland China [J]. Advance in Geographical Sciences, 2019, 38(4): 600‒611.
[7] Wen, K. M., Ren, G. Y., Li, J., et
al. Adjusted urbanization bias monthly temperature
dataset based on the records from the national meteorological stations of China
(1961?C2015) [J/DB/OL]. Digital Journal of
Global Change Data Repository,
2019. https://doi.org/10.3974/geodb.2019.06.08.V1.
[8]
GCdataPR Editorial Office.
GCdataPR Data Sharing Policy [OL]. https://doi.org/10.3974/dp.policy.
2014.05 (Updated 2017).
[9]
National Meteorological Information
Center. Monthly Dataset of Homogenized Temperature for National Ground
Meteorological Station (V1.0) Assessment Report [M]. Beijing: National
Meteorological Information Center, 2013.
[10]
Ren, G. Y., Zhang, A. Y., Chu, Z. Y.,
et al. Principles and procedures for
selecting reference surface air temperature stations in China [J]. Meteorological Science and Technology,
2010, 38(1): 78‒85.
[11]
Ren, G. Y.,
Li, J., Ren, Y. Y., et al. An
integrated procedure to determine a reference station network for evaluating
and adjusting urban bias in surface air temperature data [J]. Journal of Applied Meteorology and Climate,
2015, 54: 1248?C1266.
[12]
Karl, T. R.,
Williams, C. N. An approach to adjusting climatological time series for
discontinuous inhomogeneities [J]. Journal
of Climate and Applied Meteorology, 1987, 26: 1744‒1763.
[13]
Mitchell, T.
D., Jones, P. D., et al. An improved method of constructing a database of monthly climate observations
and associated high-resolution grids [J]. International Journal of Climatology, 2005, 25: 693‒712.
[14]
Li, Q. X. Introductory Study of
Historic Climate Data Homogeneity [M]. Beijing: China Meteorological Press,
2011: 43‒44.
[15]
Chu, Z. Y., Ren, G. Y. Change in
urban heat island magnitude and its effect on mean air temperature record in
Beijing region [J]. Acta Meteor Sinica,
2005, 63(4): 534‒540.
[16]
Yan, Z. W.,
Li, Z., Li, Q. X., et al. Effects of
site change and urbanisation in the Beijing temperature series 1977‒2006 [J]. International
Journal of Climatology, 2010, 30:
1226‒1234.
[17]
Chen, Z. H., Wang, H. J., Ren, G. Y., et al. Change of urban heat island
intensity and its effect on regional temperature series: a case study in Hubei
province [J]. Climatic Environmental
Research, 2005, 10(4): 771‒779.
[18]
Ren, G. Y.,
Chu, Z. Y., Chen, Z. H., et al. Implications
of temporal change in urban heat island intensity observed at Beijing and Wuhan
stations[J]. Geophysical Research Letters,
2007, 34: L05711.
[19]
Li, F. Q., Tan, H. Urbanization
effects on local climate in Yinchuan in recent 50 Years [J]. Ningxia Engineering Technology, 2009, 8(4):
303‒309.
[20]
Si, P., Li, Q. X., Li, W., et al. Urbanization-induced surface air
temperature change at Shenzhen [J]. Transactions
of Atmospheric Sciences, 2010, 33(1): 110‒116.
[21]
Zhang, E. J., Zhao, X. Y., Zhang, J.
J. Climate change in Shenzhen during 1953‒2004
[J]. Acta Scientiarum Naturalium
Universitatis Pekinensis, 2007, 43(4): 535‒541.
[22]
Chen, X. L.,
Zhao, H. M., Li, P. X., et al. Remote
sensing image-based analysis of the relationship between urban heat island and
land use/cover changes [J]. Remote
Sensing of Environment, 2006, 104: 133‒146.
[23]
Jones, P.
D., Hulme, M. Calculating regional climatic time series for temperature and
precipitation: methods and illustrations [J]. International Journal of Climatology, 1996, 16: 361‒377.