Spatiotemporal
Dataset Development of the Spread and Mortality of the Pneumonic Plague in
Northeast China (1910?C1911)
Liu, X. Z.1,3 Gong, S. S.1,2*
1. School of Urban and Environmental Sciences, Central China Normal
University, Wuhan 430079, China;
2. Center for Sustainable Development Research, Central China Normal
University, Wuhan 430079, China;
3. Faculty of Arts and Social Sciences, National University of Singapore,
Singapore 119260, Singapore
Abstract:
Primarily, the systematic integration of spatiotemporal modeling for
epidemic diffusion and mortality geodemographics constitutes a central research
focus in historical medical geography with numerous documented epidemic cases
as evidence. The 1910?C1911 pneumonic plague outbreak in Northeast China stands
as a paradigmatic cautionary case in the history of epidemic control and public
health. Therefore, this study formulates a spatiotemporal dataset for the
spread and mortality of the plague, using day and county as the temporal and
spatial units, respectively. To ensure the authenticity of the dataset,
extensive information is extracted from historical documents such as Reports on
epidemic affairs in the three northeastern provinces, Report of the international
plague conference in Fengtian, Compilation of epidemic disasters in three thousand
years of China??s history, and Compilation of historical epidemic records from modern
China??s newspapers. This dataset provides comprehensive information, including
the geographic distribution of affected areas, the time nodes of the epidemic,
and mortality data. The dataset is archived in .shp and .xlsx formats, and
consists of 16 data files with data size of 949 KB (Compressed into one file
with 612 KB).
Keywords: Pneumonic plague in Northeast China;
transmission network; transmission pattern; mortality intensity; mortality
differentiation
DOI: https://doi.org/10.3974/geodp.2025.02.04
Dataset Availability Statement:
The dataset
supporting this paper was published and is accessible through the Digital Journal of Global Change Data
Repository at: https://doi.org/10.3974/geodb.2025.01.06.V1.
1 Introduction
Plague,
as a highly lethal infectious disease, has precipitated numerous major
epidemics throughout human history, including 3 global pandemics that
profoundly shaped human societies. Caused by Yersinia pestis, the
disease is mainly characterized by sudden onset, rapid progression, and
extremely high mortality. Plague-related general symptoms include high fever,
swollen and painful lymph nodes, coughing, chest pain, and distinctive
pulmonary inflammation[1]. Clinically, plague is categorized into 3
types: bubonic, pneumonic, and septicemic. It is designated as a Category A
infectious disease under the modern statutory classification system[2].
The 1910?C1911
pneumonic plague in Northeast China comprised a critical epidemiological node
of the third global plague pandemic. The outbreak originated in Russia and
entered China via Manzhouli[3], exhibiting a distinctive
??railway-city?? transmission pattern[4]. Within just a few months,
the epidemic caused over 60,000 deaths and induced widespread social panic or
even collapse.
Although many
scholars have examined this epidemic??with some evaluating its spread and
associated mortality data[4?C9]??systematic construction of
spatiotemporal dataset and quantitative analysis remain scarce. This study
interprets the topic from the perspective of historical medical geography,
utilizing the ??day?? as the temporal unit and the ??county?? as the spatial unit.
By employing methods from social network analysis and geographical spatial
analysis, the study quantitatively investigates the spatiotemporal transmission
network and mortality differentiation of the China??s Northeast plague.
2 Metadata of the Dataset
The metadata of the Spatial-temporal
dataset of the spread and mortality of the Northeast China plague during
1910?C1911[10] is summarized in Table 1. It includes the dataset full
name, short name, authors, year of the dataset, temporal resolution, spatial
resolution, data format, etc.
3 Data Sources and Methods
3.1 Data Sources
3.1.1 Epidemic Data
The
plague in Northeast China is a pivotal public health crisis during the late
Qing Dynasty with profound social and medical implications, and it has been
extensively recorded in historical sources. Among these sources, the Reports on epidemic affairs in the three northeastern
provinces[12] and the Report
of the international plague conference in Fengtian[13]
are considered authoritative, offering specific accounts of outbreak locations,
transmission routes, and death tolls. Drawing on these records, the dataset
spans the entire duration of the epidemic??from the initial reported case on
October 25, 1910, to the last recorded instance on April 29, 1911??effectively
representing the full temporal dynamics of the plague??s spread. In addition,
the Compilation of epidemic disasters in three
thousand years of China??s history[14] and the Compilation of historical epidemic records from modern
China??s newspapers[15] provide a wealth of supplementary
insights into the epidemic. The dataset primarily incorporates epidemic data
extracted from these 4 major categories of historical sources.
3.1.2 Population Data
To
assess plague mortality intensity and spatial heterogeneity, the study
collected demographic data across county-level administrative regions during
the epidemic. The sources of population data fall into 3 main categories:
First, contemporary historical demography works,
notably A history of China??s population[16],
The distribution of China??s population[17],
and A brief history of migration in modern
Northeast China[18]; Second, official census archives of late
Table 1 Metadata summary of the
Spatial-temporal dataset of the spread and mortality of the Northeast China plague
during 1910?C1911
|
Items
|
Description
|
|
Dataset full name
|
Spatio-temporal
dataset of the spread and mortality of the Northeast China plague during
1910?C1911
|
|
Dataset short name
|
Plague_NE_China1910?C1911
|
|
Authors
|
Liu, X. Z., School of Urban
and Environmental Sciences, Central China Normal University;Faculty of Arts and
Social Sciences, National University of Singapore, wdgz007@mails.ccnu.edu.cn
Gong, S. S., School of Urban and Environmental Sciences, Central China
Normal University, shshgong@ccnu.edu.cn
|
|
Geographical region
|
130 counties and
prefectures across 5 provinces: Heilongjiang, Jilin, Fengtian (now Liaoning),
Shandong, and Zhili (now Hebei)
|
|
Year
|
October 25,
1910?CApril 29, 1911
|
|
Temporal resolution
|
Day
|
|
Spatial resolution
|
County/Prefecture
|
|
Data format
|
.shp, .xlsx
|
|
Data size
|
612 KB (after
compression)
|
|
Data files
|
Plague-affected
areas, epidemic data, and mortality data
|
|
Foundations
|
National
Natural Science Foundation of China (42371265); National Social Science
Foundation of China (21VJXT015); Natural Science Foundation of Hubei Province
(2016CFA026)
|
|
Computing environment
|
Microsoft Excel 2019,
ArcGIS, Gephi
|
|
Data publisher
|
Global Change
Research Data Publishing & Repository, http://www.geodoi.ac.cn
|
|
Address
|
No. 11A, Datun Road,
Chaoyang District, Beijing 100101, China
|
|
Data sharing policy
|
(1) Data are
openly available and can be free downloaded via the Internet; (2) End users
are encouraged to use Data subject to citation; (3) Users, who are by
definition also value-added service providers, are welcome to redistribute Data
subject to written permission from the GCdataPR Editorial Office and the
issuance of a Data redistribution license; and (4) If Data are
used to compile new datasets, the ??ten percent principal?? should be followed
such that Data records utilized should not surpass 10% of the new
dataset contents, while sources should be clearly noted in suitable places in
the new dataset[11]
|
|
Communication and searchable system
|
DOI, CSTR, Crossref,
DCI, CSCD, CNKI, SciEngine, WDS, GEOSS, PubScholar, CKRSC
|
Qing-early Republican era, such as Agriculture and grain in Northern Manchuria
(1909)[19], Local surveys
of counties in Shandong[20], and 1911 investigation of Heilongjiang, Jilin, and
Fengtian provinces near the Chinese Eastern Railway[21];
Third, local gazetteer demographic data clusters, including those of
Heilongjiang[22], Jilin[23], Hebei[24],
Shandong[25], as well as municipal and county gazetteers from Manzhouli[26], Qing??an[27], Acheng[28],
Shuangyang[29], Ningjin[30], and Tai??an[31].
3.1.3
Geographic
Data
The
geospatial data originated from the county-level administrative boundary
dataset in the China Historical Geographic
Information System (CHGIS V6).
ArcGIS software was applied to convert administrative divisions and associated
attributes into vector formats, with population density data sourced
separately, enabling systematic spatial analysis workflows.
3.2 Data Preprocessing
3.2.1
Structuring
of Historical Textual Sources
Historical
epidemic records are largely found in unstructured textual form and must be
processed and systematized to support quantitative research. Through thorough
examination and validation of textual records, essential information was
extracted from the sources, including the timeline of infection in each county,
transmission routes, and mortality figures. The extracted information was
subsequently formatted into standardized data tables, featuring variables such
as county-level administrative units, onset and end dates of outbreaks, origin
and destination of transmission, and statistics of deaths??thus creating a
complete spatiotemporal dataset of the plague.
3.2.2
Data
Cleaning and Missing Value Treatment
(1) Temporal
Interpolation Method: Missing epidemic dates were interpolated
leveraging adjacent counties?? outbreak chronologies and historical trend
documentation. For instance, when
specific counties lacked recorded outbreak onset and end dates, these temporal
parameters were reconstructed through cross-referencing neighboring counties??
documented outbreaks.
(2) Cross-validation with multiple sources:
In cases of inconsistencies and anomalies in reported death tolls or epidemic
progression, cross-verification across archival records was conducted. This
approach ensured the dataset??s accuracy and credibility through
cross-validating data across independent sources.
3.3
Data Generation
3.3.1 Generation of Plague-affected Area Data
Plague-affected
areas are defined as the geospatial distribution of the epidemic transmission.
The dataset on plague-affected areas comprises 3 key parameters: administrative
boundary designations, geographical size, and population metrics. The 1910?C1911
plague devastatingly impacted 130 counties and prefectures across 5
provinces??Heilongjiang, Jilin, Fengtian, Zhili, and Shandong. The administrative
boundaries and county seats of these regions were sourced from the China
Historical Geographic Information System (CHGIS V6), with boundary
data??especially historical national borders??primarily based on The Historical Atlas of China edited by
Tan Qixiang[32]. Meanwhile, geographical sizes were derived using
ArcGIS from digitized, vectorized maps, while population data were obtained
from historical demographic studies, early census data, and local gazetteer
entries.
3.3.2 Generation of Plague Transmission Data
Plague
transmission refers to the temporal process of plague transmission and
diffusion. The dataset includes the date of first outbreak, termination,
epidemiological duration metric, plague network node degree, and plague
transmission speed.
(1) Generation of date of first outbreak, termination,
and duration
The dataset
defines the date of first outbreak
(Df) as the date of the initial plague-associated death in a given
county or prefecture, marking the beginning of the epidemic. The date of termination (De) denotes the time when the epidemic was completely eradicated,
indicating the end of the epidemic incident in every administrative division.
The epidemiological duration metric (Tp) is calculated as the
temporal interval between disease emergence Df and
fade-out De, providing standardized measurement of plague persistence across
spatially delineated regions. The calculation formula is as follows:
Tp =De?CDf (1)
where,
Tp represents the epidemic duration in calendar days (d);
greater values signify extended outbreaks, whereas smaller values indicate
shorter transmission periods.
(2) Construction of the plague transmission network and generation
of node degree
The spatial
diffusion of plague can be modeled as a spatial network following a sequential
evolution of ??point-line-area??. This study applies Social Network Analysis
(SNA) to construct a transmission network model of the epidemic, taking each
county as a node (Ni) within the network. In this framework, a source node (Ns)
identifies the epidemic focus from which the plague originates and expands
outward, while a target node (Nt) specifies the area into which the plague is transmitted. The link
between the 2 nodes depicts a transmission path ( ). During the plague in Northeast China, certain cities
served dual roles as both recipients and transmitters of the plague, displaying
features of both node types within the network. These cities thus served as
critical hubs in the transmission network. To capture the spatial features of
this network, the dataset defines 2 key metrics??plague network node degree (CD(Ns)) and plague network density
(Dp)??to quantitatively analyze the transmission patterns and the
geographic reach of the epidemic.
). During the plague in Northeast China, certain cities
served dual roles as both recipients and transmitters of the plague, displaying
features of both node types within the network. These cities thus served as
critical hubs in the transmission network. To capture the spatial features of
this network, the dataset defines 2 key metrics??plague network node degree (CD(Ns)) and plague network density
(Dp)??to quantitatively analyze the transmission patterns and the
geographic reach of the epidemic.
The CD(Ns) is employed
to measure the functional role of a specific city within the plague
transmission network. It quantifies the total number of incoming and outgoing
transmission connections for a given node??equivalently, the number of ??edges??
linked to that node. This metric reflects the influence of a city in the spread
of the epidemic. The mathematical formula is presented below:
CD(Ns)= (2)
(2)
where,
CD(Ns) denotes the node degree of a source node, and N
represents the total number of nodes in the network. If a transmission path
exists between epidemic-affected cities s and t, then ast =1;
otherwise, a
st =0. A higher CD(Ns) value signifies a higher
influential role in epidemic propagation, whereas a lower value suggests a
reduced involvement in disease diffusion.
Plague network density (Dp) quantifies the degree of interconnectivity among
nodes within the epidemic region, capturing the overall spatial cohesion of the
epidemic??s transmission pattern. It is calculated as the ratio of the actual
number of transmission paths to the theoretical maximum number of possible
links. The equation is defined as follows:
Dp= (3)
(3)
where,
Dp represents the plague network density, denotes the
actual number of edges (transmission paths) in the plague transmission network,
and N is the number of nodes. The value of Dp ranges
from [0,1]. A higher Dp reveals stronger connectivity between
cities, suggesting that the epidemic primarily spread through a ??contiguous
diffusion?? pattern?? gradually infecting nearby areas. Conversely, when Dp
approaches 0, the transmission tends to follow a ??leapfrogging?? pattern, in
which the epidemic spreads in a spatially dispersed and non-contiguous mode.
(3) Generation of plague transmission speed
To calculate the
plague transmission speed, this
study introduces a concept of temporal
distance from the initial outbreak, which measures the time lag of
the plague outbreak in each county in contrast to the origin point??Manzhouli.
This metric reflects the chronological order of the epidemic spread across the
infected jurisdictions. The equation is provided hereunder:
Dd=Df
?CD0 (4)
where,
Df represent the date of first outbreak in a given
plague-affected area, and D0 denote the date of first
outbreak at the origin of the epidemic (Manzhouli). The time distance from the initial outbreak,
denoted as Dd, is measured in days (d). A
larger Dd value demonstrates that the epidemic reached the
area later.
Plague transmission speed refers to the spatial distance over which the plague spreads per
unit of time. The calculation formula is formally expressed as:
 (5)
(5)
where,
V denotes the plague transmission speed (unit: km/d); n is
the number of transmission paths; Lst represents the spatial
distance between the source node and the target node (unit: km); and Dst quantifies the temporal interval between the initial outbreak timestamps at 2 geographical nodes
(unit: d). If a city demonstrates multiple transmission paths, its average
transmission speed is calculated as the ratio of the total path distance to the
total temporal difference across all
corresponding outbreak onset dates.
3.3.3
Generation
of Plague Mortality Data
Plague
mortality refers to population-level fatalities directly caused by Yersinia
pestis infection during epidemic phases. The plague mortality dataset
comprises 5 principal epidemiological metrics: Plague Mortality Count, Per Capita Plague
Mortality Rate, Per
Area Plague Mortality Rate, Average Daily Plague Mortality Rate, and Composite Plague Mortality Intensity.
(1) Plague Mortality Count (S)
Refers to cumulative deaths directly attributable to plague, as recorded
in historical sources.
(2) Per Capita Plague Mortality Rate (Dm)
Defined as the
ratio of total plague deaths to the total population (P), standardized per 100,000 individuals. It reflects the burden of
mortality relative to population size, allowing for comparative analysis across
regions with different population densities.
(3) Per Area Plague Mortality Rate (Di)
Defined as the
number of plague deaths per unit area, expressed as deaths per 10,000 km2.
It indicates the spatial density of mortality within the epidemic zone.
(4) Average Daily Plague Mortality Rate (Ds)
Calculated by
dividing the total number of plague deaths by the duration of the outbreak in
days, expressed as deaths per day. It measures the average daily death toll
during the plague outbreak.
(5) Composite Plague Mortality Intensity (Sd)
A synthesized
index combining the per capita, per area, and daily mortality rates to
comprehensively assess the overall intensity of plague mortality. The formula
is shown as:
Sd= (6)
(6)
where,
Sd represents the Composite
Plague Mortality Intensity, Di is the Per Area Plague
Mortality Rate, Ds is the Average Daily Plague Mortality Rate,
and Dm is the Per Capita Plague Mortality Rate.
4 Data Results and
Validation
4.1
Dataset Composition
The
Spatial-temporal dataset of the spread and
mortality of the Northeast China plague during 1910?C1911 covers the
period from October 25, 1910, to April 29, 1911, and includes records from 130
counties and prefectures across 5 provinces??Heilongjiang, Jilin, Fengtian,
Zhili, and Shandong. The dataset comprises boundary information, administrative
seat data, and area statistics for each plague-affected region, along with
corresponding data on pneumonic plague area, transmission patterns, and
mortality figures. The dataset is archived in .shp and .xlsx formats.
4.2
Data Results
4.2.1 Network Analysis of Plague Transmission
Analysis
of the constructed plague transmission network elucidates that the epidemic
primarily spread along major railway lines. Pivotal cities located along the
Chinese Eastern Railway, South Manchuria Railway, and Peking?CFengtian Railway
emerged as core outbreak zones. In addition to terrestrial routes, the plague
also spread through maritime routes, extending from Dalian to coastal cities
such as Yantai and Qingdao on the Shandong Peninsula. From these coastal hubs,
the epidemic further expanded inland into Shandong and Zhili provinces via the
Jiaozhou-Jinan Railway.
(1) Plague transmission nodes and paths
Social network analysis demon-
strates that in the
transmission network of the pneumonic plague in Northeast China, major cities
such as Harbin, Fengtian (now Shenyang), Changchun, Dalian, Jingshi (now
Beijing), Baoding, Yantai, and Jinan constituted the primary transmission nodes
(Figure 1). Among the 130 plague-affected counties and prefectures, 72.09%
(93) were subjected to the epidemic through these key nodes. These cities not
only functioned as critical transportation hubs, but also formed high-risk
areas for epidemic diffusion.
|
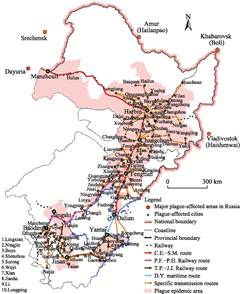
Figure 2 Map of the transmission routes[32]
|
The railway
functioned as the primary transmission
axis of the pneumonic plague in Northeast China. During the
epidemic, 3 major railway-based transmission routes and 1 maritime
transmission route were formed (Figure 2): the Chinese Eastern-South Manchuria
Railway route, the Peking-Fengtian-Peking-Hankou Railway route, the
Dalian-Yantai maritime route, and the Tianjin-Pukou-Jiaozhou-Jinan
Railway route.
|
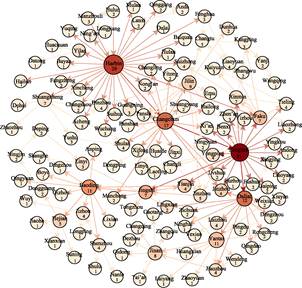
Figure 1 Transmission network of the pneumonic
plague in Northeast China
Note: Filled circles represent
network nodes; their size and color encode the node??s relative importance.
Arrows present transmission paths and the number of connections (edges)
within the plague network. The direction of an arrow indicates the direction
of plague transmission: outward arrows display source nodes (epidemic
origins), while inward arrows identify target nodes (disease recipients). The
node degree is determined by
the total number of incoming and outgoing arrows. The greater the number of
arrows, the more central the node??s role in the transmission network.
|
(2) Transmission process, modes, and speed of the
plague
Given the time distance from the initial outbreak and the epidemic duration, the pneumonic plague lasted for 197
days??approximately 6.5 months. The epidemic underwent a prolonged transmission
process from its initial outbreak to final containment. The dynamic trends in
newly affected counties, cumulative affected counties, and recovered counties
explicitly delineate distinct spatiotemporal progression patterns of the
epidemic. Accordingly, the epidemic??s progression can be divided into 3 phases:
the emergence period,
the expansion period,
and the decline period
(Figure 3).
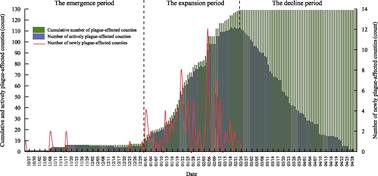
Figure 3 Daily
changes in the number of affected counties during the pneumonic plague in
Northeast China
The emergence period (October 25 to
December 31, 1910) was characterized by minimal and relatively stable increases
in the number of newly affected counties. The cumulative count of affected
counties rose slowly, with an average of fewer than 1 new county reported per
day. During this phase, the epidemic spread at a relatively slow pace and
remained geographically confined. The number of actively infected counties
fluctuated at a low level, illuminating that the epidemic was still sporadic in
nature and exhibited weak transmissibility.
The expansion period (January 1 to
February 23, 1911) witnessed a sharp and fluctuant increase in newly affected
counties, accompanied by a rapid rise in cumulative case numbers. This phase
marked the most intense stage of epidemic spread. The number of actively
infected counties surged concurrently, peaking in the mid-to-late stage of this
period, uncovering that most counties were in an active outbreak state. Both
the speed and spatial scale of transmission expanded significantly.
|
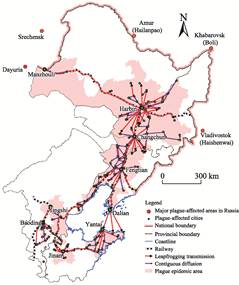
Figure 4 Map of the modes of transmission[32]
|
The decline period (February 24 to April
29, 1911) was marked by a rapid drop in new cases, eventually reaching 0, along
with a sustained decrease in the number of actively infected counties. The
cumulative count of affected counties plateaued, signaling the cessation of
geographic spread. During this phase, no new areas were infected, and the
situation in previously affected regions gradually improved. The epidemic,
overall, entered a stage of containment and resolution.
The pneumonic
plague in Northeast China manifested 2 transmission modes: leapfrogging spread and contiguous diffusion. A network
density closer to 0 indicates fewer direct links between locations, suggesting
that transmission is more likely to occur over long distances. Network analysis
shows that the network density (Dp) of the plague transmission
network is 0.01??close to 0??confirming that leapfrogging transmission was the predominant pattern
of epidemic spread (Figure 4).
The transmission
speed of the pneumonic plague in Northeast China exhibited pronounced
geographical disparities (Figure 5). The rate at which plague spread across
major node cities can be deduced from the first
outbreak date isolines: locations farther from the origin
experienced longer delays before the disease arrived. Transmission progressed
significantly faster along railway routes than in areas distant from rail
infrastructure (Figure 5a). Geospatial analytical techniques were used to
calculate plague transmission speeds across all 130 impacted counties and
prefectures, resulting in a categorized thematic map. The results reveal clear
spatial disparities. Among them, Mancheng County in Zhili recorded the fastest
transmission, with an average of 43.58
km/d. This was followed by Manzhouli, Tianjin, Jingshi (now
Beijing), and Jinan, where rates exceeded 23 km/d. Overall, during the entire 197-day epidemic
period, the average transmission speed of the pneumonic
plague in Northeast China was 8.09
km/d. During the 54-day expansion
period alone, the average speed reached 30 km/d (Figure 5b).
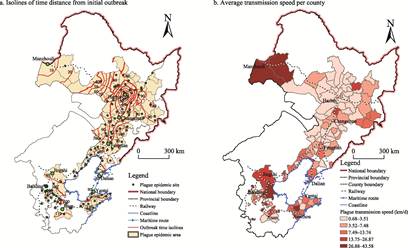
Figure 5 Maps of the transmission speed of the Northeast
China pneumonic plague[32]
4.2.2 Regional Differentiation of Plague
Mortality
(1) Provincial-level mortality differentiation
A statistical
overview of the pneumonic plague outbreak reveals the following provincial
death tolls: Heilongjiang reported 14,812 deaths, Jilin 25,418, Fengtian 6,752,
Zhili 1,299, and Shandong 8,006??amounting to a total of 56,287 deaths across
the 5 provinces. Adding 4,503 further deaths recorded along the Chinese Eastern
Railway (under Russian jurisdiction) and the South Manchuria Railway (under
Japanese jurisdiction), the overall death toll from the pneumonic plague in
Northeast China reached at least 60,790.
In terms of average daily plague
mortality, the rate ranked was as follows: Jilin > Heilongjiang > Shandong > Fengtian
> Zhili. For the per
area plague mortality rate, the order was: Jilin > Shandong > Heilongjiang > Fengtian
> Zhili.
Concerning the per capita plague mortality rate,
the ranking was: Heilongjiang >
Jilin > Shandong > Fengtian > Zhili. Regarding composite plague mortality intensity,
Jilin ranked the highest, while Zhili the lowest, with Heilongjiang, Shandong,
and Fengtian falling in between. Collectively, Jilin Province was the most severely impacted region during
the epidemic[33].
(2) County-level mortality differentiation
With the natural
breaks classification method, the plague mortality indicators for the 130
counties and prefectures were categorized into 5 levels (Figure 6). The results
show that the region along the railway corridor from Harbin to Changchun and
Fengtian (now Shenyang) experienced the most severe mortality. In this area,
the total number of deaths, as well as the per area, per capita, and daily average plague mortality rates,
along with the composite mortality intensity, were all
noticeably higher than those in other regions.
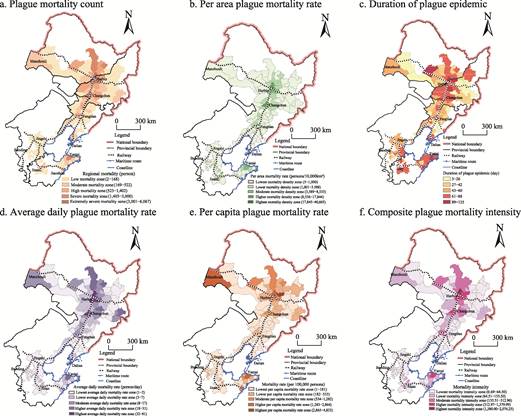
Figure 6 Maps of the county-level
differentiation of plague mortality during the pneumonic plague in Northeast
China[32]
4.3
Data Validation
The
collection and extraction of data for the spatiotemporal
dataset on the spread and mortality of the pneumonic plague in
Northeast China were meticulously carried out throughout the entire
process.
The research
findings evidence that the dataset is highly validated. Specifically, the
dataset documents 60,790 deaths
caused by the pneumonic plague in Northeast China, closely matching Wu??s
widely cited estimate of ??over 60,000?? deaths[34]. A further
validation procedure involves measuring the distance from each of the 130
affected locations to the nearest railway line and analyzing its correlation
with the same mortality indicators. The findings demonstrated a statistically
significant inverse relationship: plague mortality increased with proximity to
railways and declined with increasing distance. This quantitative pattern
supports the historical account by Minister Shi, Zhaoji, who stated that ??all
the towns through which the disease spread lay along railway lines??[35].
5 Discussion and Conclusion
From
the perspective of historical medical geography, this study collected and
processed historical documents related to the 1910?C1911 pneumonic plague in
Northeast China. By adopting social network analysis and geospatial-temporal
analysis, it effectively constructed a comprehensive spatiotemporal dataset on
the transmission and mortality of the epidemic. The data analysis yielded the
following key conclusions:
(1) The pneumonic
plague in Northeast China affected 130
counties and prefectures across 5 provinces:
Heilongjiang, Jilin, Fengtian, Zhili, and Shandong. Major transmission nodes
included Harbin, Fengtian (now
Shenyang), Changchun, Dalian, Jingshi (now Beijing), Baoding, Yantai, and Jinan.
(2) The epidemic
persisted for 197 days,
progressing through 3 phases: the emergence
period
(October 25 to December 31, 1910), the expansion
period
(January 1 to February 23, 1911), and the decline period (February 24 to April 29, 1911).
(3) Transportation lines played a critical role
in the spread of the epidemic, forming 3 major railway-based transmission routes and one maritime transmission route.
(4) The plague
predominantly expanded through a leapfrogging
transmission pattern?? characterized by rapid,
long-distance jumps??combined with contiguous
diffusion, which propagated more gradually over shorter
distances. The interplay of these 2 modes resulted in pronounced distance decay effects
and heavy reliance on transportation
networks in shaping the epidemic??s spatial dynamics. During the
expansion period, the average transmission speed reached approximately 30 km/d.
(5) The epidemic
caused at least 60,790 recorded
fatalities, with mortality severity showing prominent spatial
clustering along principle railway
corridors.
Across all metrics??cumulative deaths, mortality per unit area, per capita
mortality, daily average mortality rates, and composite mortality intensity??the
??railway pull effect?? (i.e., epidemic amplification driven by transport
connectivity) emerged as a defining feature: rail hubs and their adjacent zones
consistently functioned as disease hotspots. The region between Harbin,
Changchun, and Fengtian (now Shenyang) experienced the highest death tolls.
By leveraging social network analysis and geospatial analysis, this study
quantitatively examined and visually presented the spatiotemporal dynamics of
the pneumonic plague in Northeast China. Compared with conventional descriptive
historiography, this data-driven approach demonstrated enhanced scientific
rigor through its systematic integration of spatiotemporal analytics. The
multidimensional dataset enables not only quantifiable reconstruction of the
epidemic??s diffusion patterns across temporal and spatial dimensions but also
establishes a reproducible analytical framework??with theoretical,
methodological, and evidentiary implications??for modeling historical and
contemporary disease transmission dynamics in China and globally.
Author Contributions
Gong, S. S. conceived and designed the dataset framework, developed the core
algorithms, supervised the processing of key data, and contributed to the
review and revision of the data paper. Liu,
X. Z. spearheaded for the collection and processing of data
regarding plague-affected areas, transmission progression, and mortality data,
optimized the algorithm logic, carried out the practical development of the
dataset, drafted and revised the data paper.
Conflicts of Interest
The authors declare no conflicts of interest.
References
[1]
Li, L. J. Infectious Diseases
[M]. Beijing: Higher Education Press, 2004: 153.
[2]
Jin, W. T., Pan, J. Diagnosis,
treatment and prevention of plague [J]. Chinese Clinical Medicine, 2019,
26(6): 803?C806.
[3]
Du, L. H. Plague prevention and
traffic blockade in Northeast China during the late Qing Dynasty [J]. Historical
Research, 2014, 61(2): 73?C90+190.
[4]
Cao, S. J., Li, Y. S. Plague:
War and Peace??China??s Environmental Conditions and Social Change: 1230?C1960
[M]. Jinan: Shandong Pictorial Press, 2006: 224.
[5]
Gu, Y. Q. Modern Epidemic
Prevention in China (1840?C1937) [M]. Beijing: Guangming Daily Press, 2012.
[6]
Wang, Y. A study of the 1910?C1911 plague in Northeast
China and its prevention and control [D]. Suzhou:
Soochow University, 2005.
[7]
Chen, Y. The Northeast
pneumonic plague in late Qing and its historical implications [J]. Shandong
Social Sciences, 2020(5): 74?C79.
[8]
Jiao, R. M. The 1910?C1911
northeast plague and responses by the court and people [J]. Modern History
Studies, 2006, 28(3): 106?C124.
[9]
Shi, J. Japan??s observation and
response to the late Qing Northeast Plague [J]. Journal of Chongqing
University (Social Science Edition), 2022(1): 202?C220.
[10]
Liu, X. Z., Gong, S. S.
Spatial-temporal dataset of the spread and mortality of the Northeast China Plague
during 1910?C1911 [J/DB/OL]. Journal of Global Change Data Repository,
2025. https://doi.org/10.3974/ geodb.2025.01.06.V1.
[11]
GCdataPR
Editorial Office. GCdataPR data sharing policy [OL].
https://doi.org/10.3974/dp.policy.2014.05 (Updated 2017).
[12]
Fengtian Anti-Epidemic Bureau.
Epidemic Reports of the Three Eastern Provinces [M]. Tianjin: Tianjin Ancient
Books Press, 2010: 1?C692.
[13]
Editorial Committee of the
International Plague Conference. Report of the International Plague Conference
in Fengtian [M]. Trans. Zhang, S. Z. Beijing: Central Compilation Press, 2010:
1?C501.
[14]
Gong, S. S. Compilation of
Historical Plague Materials in China (Qing Dynasty Volume) [M]. Jinan: Qilu
Press, 2019: 505?C1314.
[15]
Gong, S. S. Compilation of
Epidemic Reports in Modern China??s Newspapers (Vol.1) [M]. Jinan: Shandong
Pictorial Press, 2023: 1?C659.
[16]
Ge, J. X. History of China??s
Population, Vol. 5 [M]. Shanghai: Fudan University Press, 2002: 1?C1343.
[17]
Hu, H. Y. Distribution of
China??s population [J]. Acta Geographica Sinica, 1935, 2(2): 33?C74.
[18]
Wu, X. Y. Brief history of
modern Northeast migration [J]. Northeast Journal, 1941, 1(2): 2.
[19]
Boloban. Agriculture and grain
in Northern Manchuria [R]. Trans. Heilongjiang Library. Harbin: Far East
Railway Bureau, 1909.
[20]
Lin, X. Z. Local surveys of counties in Shandong [R]. Jinan:
Education Department of Shandong Governor??s Office, 1919.
[21]
Boloban. 1911 Survey of
Heilongjiang, Jilin and Fengtian along the Chinese Eastern Railway [R]. Trans.
Heilongjiang Library. Harbin: Far East Railway Bureau, 1912.
[22]
Heilongjiang Provincial
Gazetteer Committee. Heilongjiang Gazetteer, Vol. 57: Population [M]. Harbin:
Heilongjiang People??s Press, 1996: 99?C127.
[23]
Jilin Provincial Gazetteer
Committee. Jilin Gazetteer, Vol. 5: Population [M]. Changchun: Jilin People??s
Press, 1992: 1?C481.
[24]
Hebei Provincial Gazetteer
Committee. Hebei Gazetteer, Vol. 12: Population [M]. Shijiazhuang: Hebei People??s Press, 1991:
19?C52.
[25]
Shandong Provincial Gazetteer
Committee. Shandong Gazetteer: Population [M]. Jinan: Qilu Press, 1994:
154?C186.
[26]
Manzhouli Gazetteer Committee.
Manzhouli Gazetteer [M]. Hohhot: Inner Mongolia People??s Press, 1998: 53?C71.
[27]
Qing??an County Gazetteer
Office. Qing??an County Gazetteer [M]. Harbin: Heilongjiang People??s Press,
1995: 424?C432.
[28]
Acheng County Gazetteer Office.
Acheng County Gazetteer [M]. Harbin: Heilongjiang People??s Press, 1988:
115?C138.
[29]
Shuangyang County Gazetteer
Committee. Shuangyang County Gazetteer [M]. Changchun: Jilin Literature and
History Press, 1992: 120?C132.
[30]
Ningjin County Gazetteer
Committee. Ningjin County Gazetteer [M]. Jinan: Qilu Press, 1992: 103?C118.
[31]
Tai??an Gazetteer Committee.
Tai??an Gazetteer [M]. Jinan: Qilu Press, 1996: 85?C97.
[32]
Tan, Q. X. Historical Atlas of
China, Vol. 8 [M]. Beijing: China Map Publishing House, 1996: 5?C6.
[33]
Zhao, E. C. Draft History of
Qing, Vol. 449: Biography of Xi Liang [M]. Beijing: Zhonghua Book Company,
2020: 12534.
[34]
Wu, L. D. Plague Fighter: The
Autobiography of a Modern Chinese Physician (Vol. 1) [M]. Trans. Cheng, G. S.,
Ma, X. B.; Ed. Wang, L. F. Changsha: Hunan Education Press, 2011.
[35]
Shengjing
Times. Speech by Shi Zhaoji [N]. Shengjing Times, 1911-04-05(2).