Dataset
Development of the Spatio-temporal Dynamics in the Prevention and
Treatment of Women Common Diseases in China (2007?C2020)
Fan, Z. X.1,2 Wang, P.
H.1,4 Wang, S.
K.1,4,5 Pei, C. Y.3 Xu, C. D.1,4 Li, Z. R.6 Liu, Y. L.3
Ma, J.7* Wang, Z. B.1,4*
1. Institute of Geographic Sciences and Natural Resources
Research, Chinese Academy of Sciences, Beijing
100101, China;
2. School of Health and Medicine,
Dezhou University, Dezhou 253023, China;
3. School of Health Policy and
Management, Chinese Academy of Medical Sciences & Peking Union Medical
College, Beijing 100730, China;
4. University of Chinese Academy of Sciences, Beijing
100049, China;
5. College of Landscape
Architecture, Beijing Forestry University,
Beijing 100083, China;
6. Department of Disease Control and Prevention, Sichuan
Provincial Center for Disease Control and Prevention, Chendu 610041, China;
7. Institute for Hospital Management of Tsinghua
University, Shenzhen 518071, China
Abstract:
This study analyzes temporal and spatial
trends of women common disease screening in China using data from the China health
statistics yearbook, China health and family planning statistics yearbook, and China
health and wellness statistics yearbook. The analysis applies descriptive
statistical methods, data structuring, Interrupted Time Series (ITS) analysis,
global spatial autocorrelation analysis, and Getis-Ord Gi* cold
hotspot analysis. The dataset includes screening-related indicators from 31 provincial-level
administrative regions between 2007 and 2020, covering the
number of individuals scheduled for screening, the number of individuals
actually screened, screening rate and the detection rate of gynecological
diseases, including Trichomoniasis, cervical erosion, condyloma acuminatum,
cervical cancer, and breast cancer. Additionally, it contains spatial data, ITS
analyses results of screening rates, and year-on-year changes in screening
rates at both the national and provincial levels. The dataset is archived in
.xlsx and .shp data formats, and consists of 115 data files with data size of
169 MB (compressed into one file with 112 MB).
Keywords: women common diseases; screening rates;
spatial and temporal trend analysis
DOI: https://doi.org/10.3974/geodp.2025.02.05
Dataset Availability Statement:
The dataset
supporting this paper was published and is accessible through the Digital Journal of Global Change Data Repository at: https://doi.org/10.3974/geodb.2025.02.08.V1.
Women common diseases pose a significant threat to both their physical
and mental health, particularly reproductive health[1]. With China??s aging population and declining fertility
rates, women??s health issues are becoming increasingly prominent and demand
urgent attention. The prevention, early diagnosis, and treatment of common and
frequently occurring diseases in women are crucial for maintaining their health
throughout their life cycle and also support the sustainable development of
population health in China. Systematic screening of women common diseases
facilitates early detection and timely intervention, which enables the
effectiveness of clinical treatment, lowers mortality risks, and improves
reproductive health. Additionally, it contributes to a higher quality of life
and a more efficient allocation of healthcare resources[2?C4].
Since the
mid-20th century, public health in China has gradually established standardized
screening mechanisms for common women diseases, including sexually transmitted
infections, uterine prolapse, urinary fistulae, menstrual disorders, and
trichomoniasis[5,6]. In recent years,
policies such as the Outline for women??s development in China (2011?C2020)
(hereafter referred to as the Outline)[7] and the Law on the protection
of women??s rights and interests of China[8], have further reinforced
support of women??s health screening, making them a national priority.
This study aims to systematically analyze data related
to the screening of common women diseases in China from 2007 and 2020, examine
spatio-temporal trends, provide a scientific basis for future disease
prevention and treatment strategies, promote early detection and intervention,
and comprehensively safeguard women??s health.
2 Metadata of the Dataset
The metadata of the Analyzing dataset of spatio-temporal dynamics in the
prevention and treatment of women common diseases in China (2007?C2020)[9] is summarized in
Table 1. It includes details such as the full and short names of the dataset, authors,
dataset year, data format, data size, data files, etc.
3 Methods
3.1 Data Sources
The data used in this study were obtained from China health
statistics yearbook, China health and family planning statistics yearbook, and
China health and wellness statistics published by the China??s National Health
Authority[11]. The dataset includes nationwide health statistics as
well as provincial-level data on health development and population health
levels in 31 provinces, autonomous regions, and municipalities directly under
the central government. The core data were extracted from the investigation and
treatment of women??s diseases statistical table systematically included in the yearbooks.
These data include the year, region (province), the number of individuals
scheduled for screening, the number of
Table 1 Metadata
summary of Analyzing dataset of spatio-temporal dynamics in the prevention and
treatment of women common diseases in China (2007?C2020)
|
Items
|
Description
|
|
Dataset full
name
|
Analyzing
dataset of spatio-temporal dynamics in the prevention and treatment of women
common diseases in China (2007?C2020)
|
|
Dataset short
name
|
WomenCommonDiseases2007?C2020
|
|
Authors
|
Fan, Z. X.,
Institute of Geographic Sciences and Natural Resources Research, Chinese
Academy of Sciences, School of Health Policy and Management, Chinese Academy
of Medical Sciences & Peking Union Medical College,
fanzixuan_pumc@163.com
Wang, P. H.,
Institute of Geographic Sciences and Natural Resources Research, Chinese
Academy of Sciences, University of Chinese Academy of Sciences,
wph1996@126.com
Wang, S. K., Institute of Geographic Sciences and
Natural Resources Research, Chinese Academy of Sciences, College of Landscape Architecture,
Beijing Forestry University, wskcollins@bjfu.edu.cn
Pei, C. Y.,
School of Health Policy and Management, Chinese Academy of Medical Sciences
& Peking Union Medical College, chenyang3061@163.com
Xu, C. D.,
Institute of Geographic Sciences and Natural Resources Research, Chinese
Academy of Sciences, University of Chinese Academy of Sciences,
xucd@lreis.ac.cn
Li, Z. R. Department of
Disease Control and Prevention, Sichuan Provincial Center for Disease Control
and Prevention, zhli2045@alumni.sydney.edu.au
Liu, Y. L.,
School of Health Policy and Management, Chinese Academy of Medical Sciences
& Peking Union Medical College, liuyuanli_pumc@163.com
Ma, J., Institute for Hospital Management of
Tsinghua University,
jingma@sz.tsinghua.edu.cn
Wang, Z. B.,
Institute of Geographic Sciences and Natural Resources Research, Chinese
Academy of Sciences, University of Chinese Academy of Sciences, wangzb@igsnrr.ac.cn
|
|
Geographical
region
|
The 31
provincial-level administrative regions in China (data for Hong Kong, Macao,
and Taiwan are temporarily unavailable)
|
|
Year
|
2007?C2020
|
|
Data format
|
.xlsx, .shp
|
|
Data size
|
169 MB (compressed
to 112 MB)
|
|
Data files
|
(1) Differences
in the inspection rate of women common diseases in China and 31 provinces
from 2007?C2020; (2) yearly growth rate of inspection rate on women common
disease from 2009?C2020; (3) results of ITS analysis of the inspection rate of
women common diseases from 2007?C2020; (4) original and amended data on the
number of persons to be inspected, inspected and the inspection rate during
2008?C2010; (5) the inspection rate of women common diseases and the
prevalence rate of 5 types of women common diseases in each province from
2007?C2020
|
|
Foundation
|
National Natural
Science Foundation of China (42130713)
|
|
Data computing
environment
|
Excel, Stata, ArcGIS
|
|
Data publisher
|
Global Change
Research Data Publishing & Repository, http://www.geodoi.ac.cn
|
|
Address
|
No. 1lA, Datun
Road, Chaoyang District, Beijing 10010l, China
|
|
Data sharing
policy
|
(1) Data are openly available and can be free downloaded via the
Internet; (2) End users are encouraged to use Data subject to
citation; (3) Users, who are by definition also value-added service
providers, are welcome to redistribute Data subject to written
permission from the GCdataPR Editorial Office and the issuance of a Data
redistribution license; and (4) If Data are used to compile new
datasets, the ??ten percent principal?? should be followed such that Data
records utilized should not surpass 10% of the new dataset contents, while
sources should be clearly noted in suitable places in the new dataset[10]
|
|
Communication and searchable system
|
DOI, CSTR,
Crossref, DCI, CSCD, CNKI, SciEngine, WDS, GEOSS, PubScholar, CKRSC
|
individuals
actually screened, screening rates and several indicators related to common
women diseases. These diseases include trichomoniasis, urogenital fistula,
uterine prolapse (grade II or higher), HIV, gonorrhea, cervical erosion,
condylomata acuminata, and ovarian, cervical, and breast cancers.
All survey data
were collected through a comprehensive reporting system managed by district-
and county-level maternal and child healthcare institutions or other relevant
medical institutions[12]. This study focused on China??s mainland,
excluding Hong Kong, Macau, Taiwan, and the South China Sea Islands.
3.2 Data Processing
Analysis of the
trend in the number of individuals actually screened and screening rates for
women common diseases in China from 2007 to 2020 revealed that the number of
eligible women from 2008 to 2010 was significantly lower than in other years (Table
2, Figure 1). According to the National Survey System of Maternal and Child
Health Services, the number of eligible women for screening is calculated by
dividing the total number of women aged 20?C64 years in a given region by the
examination cycle. This cycle requires all women in this age range to undergo a
comprehensive examination every 3 years[13]. Thus, the number of
women eligible for screening each year primarily depends on the actual
population size of the region, which typically does not fluctuate significantly
over short periods. Using data from the population statistics table by age and sex
in the China Statistical Yearbook[14], corrections were made to the
number of eligible women for the years 2008?C2010. Before and after these
adjustments, the revised trend of screening rate of women commom disease in
China from 2007 to 2020 is presented in Table 2 and Figure 1.
Table 2 National statistics on the number of
individuals scheduled for screening, the number of individuals actually
screened, screening rates, before and after correction (2008?C2010)
|
Year
|
Number of
women scheduled for screening, China health statistics yearbook (person)
|
Number of
women scheduled for screening, China statistical yearbook (person)
|
Number of
women actually screened, China health statistics yearbook (person)
|
Screening
rate before correction (%)
|
Screening
rate after correction (%)
|
|
2008
|
99,282,938
|
145,073,656.5
|
73,557,216
|
74.1
|
50.7
|
|
2009
|
94,331,132
|
147,678,885.1
|
80,557,572
|
85.4
|
54.5
|
|
2010
|
91,077,516
|
148,159,050.4
|
84,946,929
|
93.5
|
59.6
|
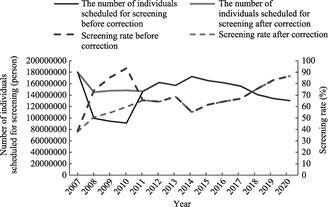
Figure 1 Trends in the number of individuals
scheduled for screening and screening rates before and after correction
3.3 Data Analysis
3.3.1 Descriptive Statistical Analysis
Descriptive statistics were
used to analyze trends in the number of individuals scheduled for screening,
the number of individuals actually screened, screening rate, and the detection
rate of common gynecological diseases at the national level from 2007 to 2020.
The formula for calculating the screening
rate is as follows:
 (1)
(1)
where,  represents the screening rate (%) in each province,
 denotes the annual number of individuals actually screened
per province (person),
denotes the annual number of individuals actually screened
per province (person), indicates the registered female population aged 20?C64 years
in each province??s statistical year (person).
indicates the registered female population aged 20?C64 years
in each province??s statistical year (person).
The annual growth rate of the screening rate was also calculated using
the following equation??
 (2)
(2)
where, represents the annual growth rate of the screening rate (%) in
each province,
represents the annual growth rate of the screening rate (%) in
each province,  denotes the screening rate last year (%),
  indicates the screening rate this year (%).
3.3.2
Data
Structuring Processing
To facilitate spatial
analysis, screening rates from the 31 provinces were georeferenced using ArcGIS
10.8. The data were matched with corresponding geographic coordinates and
converted into vector layers for spatial visualization. These spatial layers provided
the foundation for further spatial analysis of screening rates across the
country.
3.3.3
Interrupted
Time-series (ITS) Analysis
ITS analysis was performed
using Stata software to assess the impact of key policy changes on screening
rates, including the liberalization of family planning policies[15],
institutional reforms in the health sector in 2014[16], and
the launch of the ??Healthy China Strategy?? as a basic national policy in 2017.
A segmented regression model was applied using the
following equation:
Yt
=??0 +??1 time+??2 intervention+??3 post+??t (3)
where, Yt
represents the observed outcome at ??time??, time is a time
variable from the beginning to the end of the study, intervention is a dummy
variable indicating whether the policy was implemented, post represents
the time elapsed since the policy intervention, ??0 represents the
baseline screening rate at the beginning of the study, ??1 represents the pre-intervention slope, reflecting the
difference between the observed outcome at the time of implementation and the
expected outcome had the policy not been introduced, ??2 represents the immediate effect of the policy
intervention, ??3 represents the change in
trend following the policy intervention, capturing its ongoing impact on
screening rates over time, ??t is an error term that represents random factors not explained
by the model, including omitted variables, measurement error, and unpredictable
random perturbations.
3.3.4 Global Spatial Autocorrelation
Analysis
This study employed global
spatial autocorrelation analysis to assess the spatial distribution of women??s
screening rates for common diseases across 31 provinces in China. Moran??s I
index was calculated to determine whether the distribution was clustered,
dispersed, or random. The formula used is as follows:
 (4)
(4)


where, n is the total
number of elements,  and
and  represent the attribute values of the ith and
jth spatial units, respectively,
represent the attribute values of the ith and
jth spatial units, respectively,  represents the mean of all space cell attribute values,
 denotes
the spatial weight between elements i and j, S0 is the aggregation of all spatial weights, Z is the significance of spatial
autocorrelation,
denotes
the spatial weight between elements i and j, S0 is the aggregation of all spatial weights, Z is the significance of spatial
autocorrelation,  represents the
expected value of Moran??s I. V[I] is the variance of Moran??s I. Moran??s I range from [?C1,1], and in
the event that the results are significant (p<0.05, Z >1.96 or <?C1.96), Moran??s I >0 indicates a
clustered pattern, Moran??s I <0 indicates a dispersed distribution, Moran??s I =0 indicates a
random distribution.
represents the
expected value of Moran??s I. V[I] is the variance of Moran??s I. Moran??s I range from [?C1,1], and in
the event that the results are significant (p<0.05, Z >1.96 or <?C1.96), Moran??s I >0 indicates a
clustered pattern, Moran??s I <0 indicates a dispersed distribution, Moran??s I =0 indicates a
random distribution.
3.3.5
Getis-Ord
Gi* Analysis
Getis-Ord Gi*
analysis was conducted to explore the spatial heterogeneity in women??s
screening rates for common diseases across 31 provinces, identifying hotspots
(areas with high screening rates) and cold spots (areas with low screening
rates). The formula used is as follows:
 (5)
(5)
 (6)
(6)
where,
Gi* represents the agglomeration index of spatial
unit i,  is the value of the attribute of space cell j.
is the spatial weight between elements i
and j, n is the total number of elements, Z is the degree
of significance of the agglomeration index. S is the standard deviation of the attributes
corresponding to n elements. E(Gi*) and
is the value of the attribute of space cell j.
is the spatial weight between elements i
and j, n is the total number of elements, Z is the degree
of significance of the agglomeration index. S is the standard deviation of the attributes
corresponding to n elements. E(Gi*) and  (Gi*) denote the expected value and
variance of Gi*, respectively. A significant positive Z
indicates a high-value agglomeration area (hotspot), while a significant
negative Z suggests a low-value cluster (cold spot).
(Gi*) denote the expected value and
variance of Gi*, respectively. A significant positive Z
indicates a high-value agglomeration area (hotspot), while a significant
negative Z suggests a low-value cluster (cold spot).
Spatial visualization, map
drawing, Moran??s I index
calculation, and Getis-Ord Gi* analysis were performed using
ArcGIS 10.8 software, a two-sided significance level of ??= 0.05 was applied.
4 Data Results
4.1 Dataset Composition
The
dataset of Analyzing dataset of spatio-temporal dynamics in the prevention and
treatment of women common diseases in China (2007?C2020) is mainly composed of: (1)
data on changes in the difference in screening rates for women common diseases
at the national and provincial levels from 2007 to 2020; (2) data on the
year-on-year growth rate of screening rates for women common diseases at the
national and provincial levels from 2009 to 2020; (3) the results of the ITS
analysis of the screening rates for women common diseases from 2007 to 2020;
(4) the number of individuals scheduled for screening, the number of
individuals actually screened, screening rates at the national level in the
years 2008?C2010, both before and after the adjustment; (5) data on the
screening rate for women common diseases and the prevalence rate of 5 types of women
common diseases by province for each year from 2007 to 2020, which were used as
raw data in the calculation. The data contents and data descriptions
represented by each field in the InspectionPrevalenceWomenCommonDisease_2007?C2020.shp
files are shown in Table 3.
Table 3 The attribute field of the vector data
|
Field content
|
Field names
|
Description
|
|
ID
|
FID
|
Number of each province
|
|
Region
|
E_NAME/Region
|
Nationwide,
Beijing, Tianjin, Hebei, Shanxi, ...
|
|
Number of persons to be
investigated (person)
|
Number_of_
|
Number
of individuals scheduled for screening for common women diseases
|
|
Number of persons
investigated
(person)
|
Number_of1
|
Number of individuals
actually screened for common women diseases
|
|
Inspection rate (%)
|
Inspection
|
Percentage of actual
inspections against the number of persons to be inspected
|
|
Baseline
inspection rate (%)
|
Detection_
|
Baseline level
of completion rate of inspections
|
|
Prevalence of
trichomoniasis (%)
|
Prevalence
|
Percentage of people
diagnosed with trichomoniasis during examinations
|
|
Prevalence of celiac
disease (%)
|
Prevalence_1
|
Percentage of people
diagnosed with coeliac disease in screening tests
|
|
Prevalence of condyloma
acuminatum (0.1%)
|
Prevalence_2
|
Percentage of people
diagnosed with condyloma acuminatum in screening tests
|
|
Prevalence of cervical
cancer (0.1%)
|
Prevalence_3
|
Percentage of people
diagnosed with cervical cancer in screening tests
|
|
Prevalence of breast cancer
(0.1%)
|
Prevalence_4
|
Percentage of people
diagnosed with breast cancer in screening tests
|
4.2 National Trends in Screening for Women Common Diseases
4.2.1 Overall Upward Trend in Screening Rates
for Women Common Diseases in China (2007?C2020)
Between 2007 and
2020, the number of
individuals actually screened for women
common diseases increased significantly, reaching 112.7 million by 2020,
approximately 25% of the female population aged 20?C64 years. During the early
study years, the screening rate increased steadily, peaking at 68.67% in 2013.
However, a sharp decline occurred in 2014, followed by a slow recovery to 2013
levels by 2017. From 2017 onward, the screening rate rose rapidly, exceeding
80% by 2019, meeting the national target for inspection coverage. Although
growth slowed slightly between 2019 and 2020 due to the COVID-19 epidemic, the
overall national screening rate continued to rise, reaching 86.58% by the end
of 2020 (Figure 2).
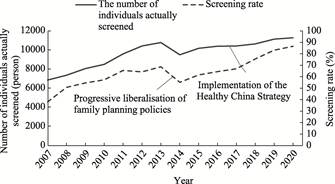
Figure 2 Trends in
the number of individuals scheduled for screening and the screening rate for
women common diseases (2007?C2020)
4.2.2 Impact of Family Planning Policy Adjustments
on Screening for Women Common Diseases
A
literature search and policy analysis revealed that screening for women common
diseases in China has historically been closely linked to family planning
programs, with implementations executed by family planning personnel[17,18].
Given the relaxation of the two-child policy in 2014, it was hypothesized that
this policy shift influenced screening practices for women common diseases. To
assess the policy??s impact on the prevention and treatment of common diseases
in women, we conducted an ITS analysis of the screening rate for women common
diseases from 2007 to 2020, using 2014 as the breakpoint. The analysis showed
that before the policy, the screening rate was 43.1% in 2014 and increased
annually by 4.64% (P<0.001). However, in the first year following the
policy adjustment, the screening rate dropped significantly by 21% (P<0.001).
While the annual screening rate increased by 0.67% after the policy, this
change was not statistically significant (P=0.383) (Figure 3 and Table 4).
These findings
suggest that the health system reforms at the end of 2013 and the adjustment of
family planning policies in 2014 impacted screening rates, leading to a
temporary period of neglect in the prevention of women common diseases.
4.2.3 National Trends in Screening Rates of Women Common
Diseases
According to national
statistics (2014?C2020), the overall detection rate of gynecological diseases
declined annually, while the prevalence of major conditions, such as cervical
and breast cancers, increased significantly after 2016 (Table 5). The detection
rates for trichomoniasis, cervical erosion, and condyloma acuminatum showed a
downward trend.
The relaxation of the family
planning policy in 2014 appears to have contributed to gaps in the prevention
and treatment of women common diseases. Additionally, compared to other studies[6,18],
the detection rate and prevalence rates reported in national statistics were
lower, raising concerns that provincial-level reports might underestimate the
actual disease burden.
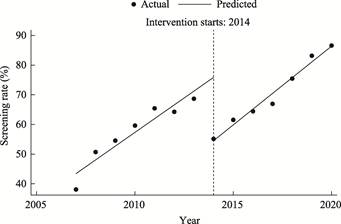
Figure 3 ITS
analysis results of screening rates for women common diseases (2007?C2020)
Table
4 ITS analysis results of screening rates for women common diseases, 2007?C2020
(with 2014 as breakpoint)
|
Independent variable
|
Coefficient
|
Standard deviation
|
t
|
p
|
95% CI
|
|
Constant term ??0
|
43.10
|
2.72
|
15.85
|
0.000
|
[37.04, 49.15]
|
|
Existing trend
??1
|
4.64
|
0.71
|
6.57
|
0.000
|
[3.06, 6.21]
|
|
Level change ??2
|
?C21.00
|
3.05
|
?C6.88
|
0.000
|
[?C27.80,
?C14.20]
|
|
Trend change ??3
|
0.67
|
0.74
|
0.91
|
0.383
|
[?C0.97, 2.31]
|
Note: CI =
Confidence Interval.
Table
5 National screening outcomes of
women common diseases (2014?C2020)
|
Year
|
Detection rate of
gynaecological diseases (%)
|
Prevalence of
trichomoniasis (%)
|
Prevalence of
celiac disease (%)
|
Prevalence of
condyloma acuminatum (0.1%)
|
Prevalence of
cervical cancer (0.1%)
|
Prevalence of
breast cancer (0.1%)
|
|
2014
|
27.6
|
13.4
|
10.7
|
34.1
|
17.6
|
14.3
|
|
2015
|
26.3
|
12.9
|
10.0
|
28.5
|
15.8
|
13.2
|
|
2016
|
25.6
|
12.6
|
9.5
|
35.6
|
46.1
|
46.8
|
|
2017
|
24.2
|
12.3
|
7.5
|
28.1
|
45.6
|
51.2
|
|
2018
|
22.2
|
11.6
|
5.8
|
27.0
|
45.2
|
44.3
|
|
2019
|
20.6
|
11.0
|
4.8
|
19.2
|
43.3
|
43.4
|
|
2020
|
19.5
|
10.6
|
4.1
|
17.8
|
38.5
|
41.9
|
Source of data: China health and family planning
statistics yearbook and China health and wellness statistics yearbook, 2015?C2021,
??Women common diseases checklist??.
4.3
Provincial-level Screening for Women Common Diseases
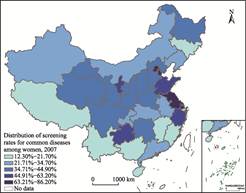
4.3.1 Screening Rates by Province (2007,
2020)
In 2007, provinces with the
highest screening rates were concentrated in the eastern coastal region, with
Shanghai (86.2%), Tianjin (80.4%), Beijing (77.3%), Jiangsu (76.1%), and
Shandong (63.2%). These regions are characterized by higher levels of economic
development (Figure 4). In contrast, provinces with the lowest screening rates
were located in the southwestern region, including Guangxi (14%), Fujian
(13.9%) and Yunnan (12.3%). 18 provinces had screening rates below the national
average of 38.5%, and only Shanghai and Tianjin exceeded 80%.
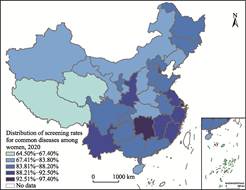
Compared with 2007, the screening
rate for women common diseases in 2020 remained higher in the eastern coastal
region than in the central and western regions. However, provinces with the
highest screening rates gradually shifted from the eastern to the southeastern
region, reflecting a change in spatial distribution over time. 17 provinces had
screening rates below the national average of 86.6%, with only Qinghai and Xizang
failing to meet the 80% target set in the Outline. The spatial distribution of
the screening rates followed the Hu Line, with higher rates in the southeast
and lower rates in the northwest. A global spatial autocorrelation analysis
revealed a Moran??s I value of 0.135,776 (P<0.05), indicating
significant spatial clustering in screening rates for women common diseases
across China (Figure 5).
|
|
|
|
Figure 4 Distribution
map of screening rates for women common diseases (2007)
|
Figure 5 Distribution
map of screening rates for women common diseases (2020)
|
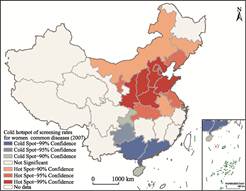
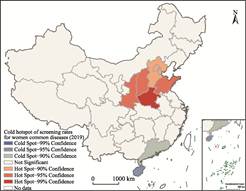
The Getis-Ord
Gi* analyses of screening rates in 2007, 2019, and 2020 revealed
distinct regional patterns: in 2007, a north-south disparity was evident, with
hotspot areas concentrated in the northern region and cold-spot areas in the
south (Figure 6). By 2019 and 2020, the extent of cold hotspot areas had
significantly decreased. The northern region remained a hotspot, while cold
spot areas in the south were mainly concentrated in Guangdong and Hainan
(Figures 7, 8). This shift suggests a narrowing gap between the northern and
southern provinces, with a general reduction in disparities in screening rates
over time.
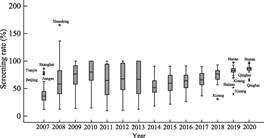
Figure 9 illustrates the evolution of screening rates
from 2007 to 2020. In 2007, most provinces had low screening rates, with only a
few economically developed regions achieving higher rates. Between 2008 and
2013, some provinces prioritized screening for women common diseases, leading
to widening disparities between regions. Following major policy changes in
2014, screening rates in many provinces declined temporarily. From 2017 onward,
national efforts to strengthen screening programs led to steady improvements,
particularly in provinces with previously low inspection rates. By 2019, most
provinces met the national screening targets, and despite the COVID-19 pandemic
in 2020, screening rates continued to rise steadily.
|
|
|
|
Figure 6 Cold hotspot map of screening rates for
women common diseases (2007)
|
Figure 7 Cold hotspot map of screening rates for
women common diseases (2019)
|
|
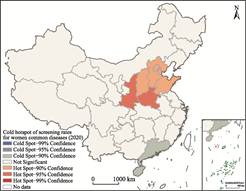
|
|
|
Figure 8 Cold
hotspot map of screening rates for women common diseases (2020)
|
Figure 9 Trends in
screening rates for women common diseases by province (2007?C2020)
|
4.3.2 Spatial
and Temporal Trends in Screening Rates for Women Common Diseases (2007?C 2020)
Between 2007 and 2020, screening rates for women
common diseases improved across most provinces in China, though the rate of
increase varied significantly between regions. Figure 10 illustrates these
regional disparities: The southern provinces, particularly Fujian, exhibited
notable increases in screening rates. Central provinces experienced relatively
smaller increases over time. Beijing, despite recording a modest increase of 7.2%,
had a high baseline screening rate in 2007, suggesting that provinces with
smaller increases generally started with higher rates.
Overall, the national screening rate increased by 48.1%
between 2007 and 2020, demonstrating substantial progress in expanding
screening coverage. This trend highlights regional differences in policy
implementation and the effectiveness of localized efforts to promote women??s
health in each region.
Based on the annual growth rate of screening rates (excluding
data anomalies in 2008 and 2011), provinces were ranked according to their 2020
screening rates, and a hotspot map was generated to visualize regional growth
trends from 2009 to 2020 (Figure 11).
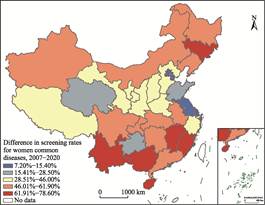
Figure 10 Map of provincial-level
growth trends of the screening rates for women common disease in China
(2007?C2020)
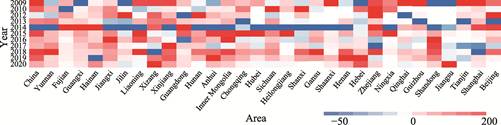
Figure 11 Hotspot of
annual growth in screening rates for women common diseases in China (2009?C2020)
Observations show that provinces with
initially higher screening rates saw significant growth after 2015, with
particularly strong increases after 2018. A notable decline in screening rates
was observed across all provinces in 2014, coinciding with policy adjustments
and healthcare sector reforms. Following 2014, all provinces resumed an upward
trajectory, although the growth rate slowed in some provinces. In 2020, the
national average screening rate increased by 3.5%, reaching 86.6%. However, 8
provinces experienced negative growth, compared to only 4 provinces in 2019. In
2019, the national screening rate grew by 7.6%, suggesting a slower expansion
in 2020. This slowdown was likely influenced by the COVID-19 pandemic, which
may have disrupted screening programs and healthcare access.
5 Discussion and Conclusion
Screening for women common diseases plays a
crucial role in women??s health throughout their life cycle and has broader
implications for national fertility rates and public health. This study
systematically analyzed the implementation of women common disease screening in
China, revealing regional differences and temporal trends, employing a mixed
research method integrating epidemiology and geography.
This study employs a mixed-methods approach,
integrating ITS, global spatial autocorrelation, and Getis-Ord Gi*
hotspot analysis to reveal the dynamic changes in screening rates across both
temporal and spatial dimensions. The ITS method, utilizing segmented regression
modeling, effectively identifies both the immediate effects and long-term trend
changes following policy interventions. Breakpoint selection was grounded in
explicit policy contexts, enhancing the model??s interpretability. In the global
spatial autocorrelation analysis, Moran??s I index demonstrated significant spatial clustering of
screening rates. The reliability of these findings was confirmed through the two-tailed
hypothesis testing (??=0.05) and the sensitivity analyses using multiple spatial
weight matrices.
The key findings of this study are as
follows: (1) Overall screening rates have increased, but the reported rates may
be higher than actual levels due to potential bias in data collection and
reporting. This underscores the need for enhancing data monitoring and
statistical accuracy. (2) Family planning policy adjustments, disrupted
screening efforts in certain regions, leading to temporary declines in
screening intensity. (3) The detection and prevalence rates reported in
national statistics may underestimate the actual burden of disease, suggesting
that some provinces may be underreporting data. This highlights the importance
of improving screening quality and data accuracy. (4) Significant regional
disparities in screening coverage persist, with spatial clustering patterns
evident. However, the gap between provinces has gradually narrowed, reflecting
the success of national and local efforts to expand screening coverage.
Despite substantial progress in screening
coverage between 2007 and 2020, this study identifies inequities in screening
access. Regional disparities remain, particularly in central and western
provinces, where screening continues to lag. Increased screening coverage is
insufficient, ensuring high-quality screening and accurate diagnostic results
is essential. A focus solely on increasing screening rates may conceal
deficiencies in screening quality, leading to delayed diagnoses and unnecessary
healthcare costs.
Additionally, policy shifts, had some impact
on screening continuity. A decline in screening rates during this period
suggests that policy changes should be coordinated with simultaneous
adjustments in the health sector to mitigate disruptions to public health
programs. Although screening efforts recovered post-policy adjustments, quality
control measures require further strengthening.
To enhance strategies for the prevention,
control, and management of women common diseases, future research and policy
efforts should focus on ensuring both high screening coverage and quality
assurance through robust supervision and standardized protocols, improving data
reliability by refining monitoring mechanisms and reducing underreporting; Integrating
screening programs with broader public health initiatives, ensuring that policy
changes do not disrupt essential healthcare services. By addressing these
challenges, China can further strengthen women??s health protection, contribute
to long-term public health improvements, and reduce the burden of preventable
diseases.
Author Contributions
Fan, Z.
X. contributed to the data collection and paper writing; Wang, P. H. contributed
to the data visualization; Wang, S. K. contributed to the paper writing and
formatting; Liu, Y. L. proposed the research idea. All authors proposed the
research idea, reviewed and revised the content, and guided the statistical
analyses.
Conflicts of Interest
The
authors declare no conflicts of interest.
References
[1]
Li, T., Liu, Z. H. Current
status and progress of common female reproductive tract infections at home and
abroad [J]. Modern Obstetrics and Gynaecology, 2023, 32(10): 782?C784.
[2]
Sheng, B. Z. Analysis of the
application value of preventive health care measures for common gynaecological
diseases in elderly women [J]. Psychology Monthly, 2020, 15(10): 158.
[3]
Li, S. E. Treatment plan and
preventive health care method of common gynaecological diseases in middle-aged
women [J]. Wisdom Health, 2020, 6(7): 77?C78, 92.
[4]
Wang, H. L. Research on
treatment and preventive health care measures for common gynaecological
diseases in middle-aged women [J]. Capital Food and Medicine, 2020,
27(1): 34?C35.
[5]
Fan, Z. X., Yan, M. Y., Pei, C.
Y., et al. Current status and trend analysis of screening studies on
common diseases among China??s women [J]. Journal of Chinese Academy of
Medical Sciences, 2024, 46(1): 33?C38.
[6]
Chen, J. X., Di, J. L. Analysis
of the current situation of screening for common diseases among women in China
[J]. Chinese Journal of Maternal and Child Health, 2019, 10(4): 74?C78.
[7]
National Bureau of Statistics.
Final statistical monitoring report on the Programme for the Development of
Chinese Women (2011?C2020) [EB/OL]. [2024-08-24]. https://www.gov.cn/xinwen/2021-12/21/content_ 5663667.htm.
[8]
Xinhua News Agency. Law of P. R.
China on the Protection of Rights and Interests of Women (Revised 2022) [OL].
[2024-08-24]. https://www.gov.cn/xinwen/2021-12/21/content_5663667.htm.
[9]
Fan, Z. X., Wang, P. H., Wang,
S. K., et al. Analyzing dataset of spatio-temporal dynamics in the
prevention and treatment of women common diseases in China (2007?C2020) [J/DB/OL].
Digital Journal of Global Change Data Repository, 2025. https://doi.org/10.3974/geodb.2025.02.08.V1.
[10]
GCdataPR Editorial Office. GCdataPR
data sharing policy [OL]. https://doiorg/10.3974/dp.policy.2014.05 (Updated 2017).
[11] CNKI-CSYD. China health statistics yearbook [EB/OL]. [2025-06-18].
https://cnki.nbsti.net/CSYDMirror/trade/yearbook/Single/N2022010155?z=Z020.
[12] National Bureau of Statistics. National statistical survey system of maternal and
child health [EB/OL]. (2021-08-21)
[2024-08-24]. https://www.stats.gov.cn/fw/bmdcxmsp/bmzd/202302/t20230215_1907110.html.
[13]
Statistical Information Centre
of the National Health Commission. Notice of the Ministry of Health on the
implementation of the National Health Surveillance Survey System and four other
systems [EB/OL]. (2010-10-21) [2024-08-24]. http://www.nhc.gov.cn/mohwsbwstjxxzx/s7965/201010/49390.shtml.
[14] National Bureau of Statistics. China statistical
yearbook [OL]. [2024-08-24]. https://www.stats.gov.cn/sj/ndsj/.
[15]
Wen, Y. Family planning and
Healthy China Strategy [J]. Population and Family Planning, 2018(4): 30?C32.
[16]
Central Government Portal.
Programme for Institutional Reform and Functional Transformation of the State
Council [OL]. (2013-03-15) [2024-08-24]. https://www.gov.cn/2013lh/content_2354443.htm.
[17]
Chen, J. X. Analysis of opportunities
and challenges of screening for women common diseases in China [D]. Beijing:
Chinese Centre for Disease Control and Prevention, 2019.
[18]
Zheng, R. M., Li, L. J., Wang,
L. H., et al. Survey on the current status of screening management and
related policies for women common diseases in China [J]. Chinese Journal of
Maternal and Child Health, 2012, 3(3): 145?C148.