A Dataset for Spatial Variation of Species Diversity and
Biomass of Subalpine Grasslands in Shanxi Province, China
Xu, M. H.1, 2 * Zhao, Z. T.1
1. Institute of Geographical
Science, Taiyuan Normal University, Jinzhong 030619, China;
2. Institute of Carbon
Neutrality, Taiyuan Normal University, Jinzhong 030619, China
Abstract: Subalpine grasslands provide grazing for wildlife
and grazing animals, so protecting their integrity is important. From July to
August in 2016, experimental plots were established in the east of the Loess
Plateau of China in high mountains with subalpine grasslands. A total of nine
mountains were selected from the north to the south in the eastern part of the
Plateau. For each mountain, a typical subalpine grassland was selected and surveys
of species diversity and biomass were conducted at the plant community level.
Six 1 m2 quadrats were designed in each plot for measuring the
height, abundance, coverage, and frequency of each plant species, and then
??-diversity indices were calculated. Next, in order to calculate ??- and
??-diversity indices, latitude and longitude were divided into five intervals
using intervals of 0.5˚ and 0.45˚, respectively. Elevation was divided into six
intervals of 100 m. Lastly, five of the six quadrats in each grassland were
chosen and used to survey plant biomass. At the middle of biomass quadrats, 0.2
m ?? 0.2 m sub-quadrats were designed for measuring aboveground biomass by
clipping aboveground plant parts and digging for belowground biomass. The
resulting dataset includes subalpine grassland data for Shanxi province as
follows: (1) the name of mountains and the geographical location of the
experimental plots; (2) the indices of ??-diversity; (3) the division of
geographical intervals and the indices of ??-diversity; (4) the indices of
??-diversity; (5) the indices of biomass; and (6) the correlations between
??-diversity and biomass in these grasslands. The data formats are .shp and
.xlsx files with a data size of 33.6 KB for a compressed file.
Keywords: subalpine grassland; species
diversity; biomass; geographical gradient
DOI: https://doi.org/10.3974/geodp.2022.04.03
CSTR: https://cstr.escience.org.cn/CSTR:20146.14.2022.04.03
Dataset Availability Statement:
The dataset
supporting this paper was published and is accessible through the Digital Journal of
Global Change Data Repository at: https://doi.org/10.3974/geodb.2022.05.03.V1
or https://cstr.escience.org.cn/CSTR:20146.11.2022.05.03.V1.
1 Introduction
Plants
serve vital roles in terrestrial ecosystems and provide humans with many
ecological services including regulating climate, improving soil fertility,
protecting biodiversity, and promoting productivity[1,2]. Studies of
plant species diversity and biomass have become important research topics
related to ecology and geography, focusing on the spatial distribution of
species diversity and biomass together with the correlation between species
diversity and biomass along geographical gradients. Species diversity reveals the organizational
levels of a community and induces changes in the functional characteristics of
a biotic community; it can even alter a shortage of critical species in a
community or the use patterns of environmental resources by species, thus
leading to modifications in ecosystem structure and function[3]. Measurements of species diversity are primarily conducted at three
spatial scales[4]. The first scale is within-habitat diversity, that
is, ??-diversity, which mainly focuses
on the number of species in local homogeneous habitat; the second scale is
between-habitat diversity, that is, ??-diversity,
which indicates differences of species composition among different habitats and
communities; the last scale is regional diversity, that is, ??-diversity, which describes the number
of species at regional or continental scales[4].
Similar to
species diversity, biomass is also a primary quantitative characteristic of
ecosystems and reflects plants productivity[5]. Biomass allocation
among various organs mirrors the growth strategy a plant uses to adapt to an
environment and plays a crucial role in the growth of plant individuals,
species coexistence, and vegetation recovery after disturbance[6].
Strategies of biomass allocation among leaves, stems, and roots, together with
allometric relationships between plant organs provide a foundation in the study
of species evolution, maintenance of diversity, and carbon cycling in
ecosystems, and also are important to our understanding of the distribution of
carbon in ecosystems and the function of carbon sinks[7]. Biomass
allocation, especially the models of allocation under the effects of different
geographical gradients, is important in studies of biomass.
Subalpine grasslands are mainly distributed
in high-elevation mountains where species diversity and biomass are obviously
affected by the mountainous terrain. Latitude, longitude, and
elevation are dominant terrain indicators of mountainous subalpine grasslands;
they directly affect the spatial distribution of solar radiation and rainfall,
and thus they result in an uneven distribution of soil moisture and temperature[8,9].
Large areas of subalpine grasslands on the eastern part of the Loess Plateau
have an abundance of species. These grasslands not only
provide excellent natural pastures but also serve as famous eco-attractions,for
example, Heyeping has been honored as the ??plateau jade??, Shunwangping as the
??Jiuzhaigou of north China??, and Wutai Mountain as ??the roof of north China??[10–12].
With a rapid development of tourism and pasture husbandry, subalpine grasslands have
experienced extensive and severe degradation caused by humans in the mountain
systems of Liuleng, Wutai, Lvliang, and Zhongtiao,
where their environments are sensitive and fragile, grasslands
degradation had been increasing, and biodiversity has been seriously threatened[13,14].
Given this, nine
typical subalpine grasslands were selected as research objects on the eastern
part of the Loess Plateau. From the plant community level, we obtained a
dataset of three types of subalpine grasslands in different mountains: (1)
species diversity data (??, ??, and ?? diversity); (2) biomass data; (3)
correlations between species diversity and biomass.
2 Metadata of the Dataset
The
metadata of the In situ dataset of
species diversity and biomass of subalpine meadows in Shanxi province of China[15]
are summarized in Table 1. This metadata include the full and short dataset
names, authors, publication year of the dataset, temporal and spatial
resolutions, as well as dataset format, size, file types, publisher, and data
sharing policy, and so on.
Table 1 Metadata
summary of the In situ dataset of
species diversity and biomass of subalpine meadows in Shanxi province of China
|
Items
|
Description
|
|
Dataset full name
|
In
situ dataset of species
diversity and biomass of subalpine meadows in Shanxi province of China
|
|
Dataset short
name
|
BiomassSubalpineMeadowsShanxi
|
|
Authors
|
Xu, M. H.
F-8170-2017, Taiyuan Normal University, xumh@tynu.edu.cn
Zhao, Z. T.,
Taiyuan Normal University, zhaozit610@163.com
|
|
Geographical
region
|
Dianding Mountain
in the Liuleng Mountain system, Beitai and Dongtai mountains in Wutai
Mountain system, Malun, Heyeping, Yunzhong and Yunding mountains in the Lvliang
Mountain system, and Shunwangping and Shengwangping mountains in the
Zhongtiao Mountain system in Shanxi province (34??34ʹN–40??43ʹN, 110??14ʹE–114??33ʹE),
China
|
|
Year
|
2016
|
|
Data format
|
.shp, .xlsx
|
|
|
|
Data size
|
41.2 KB (33.6 KB
for a compressed file)
|
|
|
|
Data files
|
(1) The name of
mountains and the geographical location of experimental plots; (2) the
indices of ??-diversity; (3) the division of geographical gradient belts and
the indices of ??-diversity; (4) the indices of ??-diversity; (5) the indices
of biomass ; (6) the data for correlations between ??-diversity and biomass
|
|
Foundations
|
Fundamental
Research Program of Shanxi Province (202103021224301); Scientific and
Technological Innovation Programs of Higher Education Institutions in Shanxi
(2021L431); College Students?? Innovative Entrepreneurial Training Plan
Program of Taiyuan Normal University (CXCY2203)
|
|
Data publisher
|
Global Change Research Data Publishing & Repository,
http://www.geodoi.ac.cn
|
|
Address
|
No. 11A, Datun
Road, Chaoyang District, Beijing 100101, China
|
|
Data sharing
policy
|
Data from
the Global Change Research Data Publishing & Repository includes metadata, datasets
(in the Digital Journal of Global Change Data Repository), and
publications (in the Journal of Global Change Data & Discovery). Data sharing policy
includes: (1) Data are openly available and can be free downloaded via the
Internet; (2) End users are encouraged to use Data subject to
citation; (3) Users, who are by definition also value-added service
providers, are welcome to redistribute Data subject to written permission
from the GCdataPR Editorial Office and the issuance of a Data redistribution
license; and (4) If Data are used to compile new
datasets, the ??ten per cent principal?? should be followed such that Data
records utilized should not surpass 10% of the new dataset contents, while
sources should be clearly noted in suitable places in the new dataset[16]
|
|
Communication and searchable system
|
DOI, CSTR, Crossref, DCI, CSCD,
CNKI, SciEngine, WDS/ISC, GEOSS
|
3 Methods
3.1 Experimental Design
By
comparing a vegetation-cover map of the Loess Plateau (Figure 1a) and a
topographic map of Shanxi province (Figure 1b), experimental plots were
selected in typical grasslands of subalpine belts at relatively high elevations (from 1,720 m to
3,045 m) in mountains along the eastern part of the Loess Plateau[4].
These were investigated from July to August in 2016. In this region, nine
subalpine grasslands (one subalpine grassland in each mountain) were successively
surveyed in different mountain ranges moving from north to south. In total,
nine mountains belonging to four mountain systems were surveyed. The names of
these mountains were Dianding (DD) Mountain in the Liuleng Mountain system,
Beitai (BT) and Dongtai (DT) mountains in Wutai Mountain system, Malun (ML),
Heyeping (HY), Yunzhong (YZ), and Yunding (YD) mountains in the Lvliang
Mountain system, and Shunwangping (SU) and Shengwangping (SE) mountains in the
Zhongtiao Mountain system (Figure 1b).

Figure
1 Map of
study area
and plot distribution
(Notes: The
study area covers the region with extensive vegetation cover on the eastern
part of the Loess Plateau. Nine mountains with high elevations were selected as
for placement of experimental plots from the north to the south in Shanxi province)
3.2 Measurement of Plant Diversity
|

Figure 2 Survey method for surveying plant
community species diversity using quadrat frames
|
On
each of these nine mountains, six plots in 1m??1m were installed randomly in subalpine communities to survey plant
diversity at a community scale or a total of 54 plots on all mountains. Each 1
m ?? 1 m quadrat frame was used as a measurement tool, and was divided into 100
uniform grids (0.1 m ?? 0.1 m) (Figure 2). In each grid, we measured plant
height, abundance, coverage, and frequency of each species; the data were used
to calculate species diversity indices in the plots. Meanwhile, we recorded the
latitude, longitude, and elevation of each plot (Table 2).
Table
2 Plot location with LLE
|
Site Number
|
Name
|
Abbreviation
|
Plot location
|
|
Latitude/??
|
Longitude/??
|
Elevation/m
|
|
1
|
Dianding
|
DD
|
39.849
|
113.939
|
2,265
|
|
2
|
Dongtai
|
DT
|
39.052
|
113.669
|
2,565
|
|
3
|
Beitai
|
BT
|
39.077
|
113.570
|
3,045
|
|
4
|
Yunzhong
|
YZ
|
38.677
|
112.432
|
2,260
|
|
5
|
Malun
|
ML
|
38.752
|
111.928
|
2,710
|
|
6
|
Heyeping
|
HY
|
38.714
|
111.841
|
2,745
|
|
7
|
Yunding
|
YD
|
37.882
|
111.541
|
2,690
|
|
8
|
Shunwangping
|
SU
|
35.423
|
111.959
|
2,250
|
|
9
|
Shengwangping
|
SE
|
35.344
|
112.212
|
1,720
|
3.3 Measurement of Plant Biomass
At each of nine mountain sites, we randomly
located five plots for measuring plant diversity, with 45 plots in total. A 0.2 m ?? 0.2 m quadrat was placed in the center of each plot with
its plants being evenly distributed, so that 45 quadrats were also acquired in total. We used
quadrats to survey plant biomass at the community scale using the following
method[4]. In each quadrat, aboveground plant parts were clipped
near the ground surface (Figure 3), and belowground plant parts were then
excavated in the entire 0.2 m ?? 0.2 m quadrat to a
depth of 0.2 m
because most plants were very shallow rooted (Figure 4). Samples of aboveground
plant parts and soil blocks with volumes of 0.2 m ?? 0.2
m ?? 0.2 m were sealed and brought to laboratory for post-sample processing.
In this process, for aboveground plant parts, only live plants were retained.
Samples of belowground plant parts were first sieved by a standard soil sieve
with a bore diameter of 0.42
mm to eliminate stones and coarse debris from the soil. Then, the soil samples
were sieved using a standard soil sieve with a bore
diameter of 0.18 mm
to eliminate fine roots with diameters no smaller than 0.18 mm. Next, live
roots and treated stems and leaves were placed into an oven and dried for 48 h
to constant weight at a temperature of 80 ??C. In the last step, dry samples
were weighed to calculate below- and above-ground plant biomass.
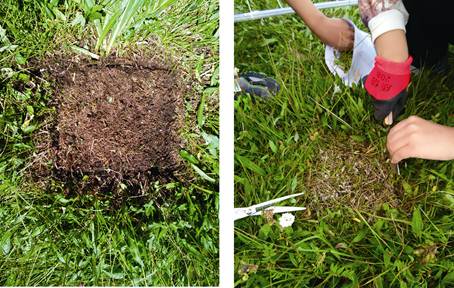
Figure 3 Clipping and gathering of aboveground
plant parts

Figure 4 Digging and gathering of belowground
plant roots
3.4 Data Analysis
(1)
Calculations on ??-, ??-, and ??-diversity of plant communities
First, we calculated the importance values of plant species based on the relative height, abundance,
coverage, and frequency of each species; then ??-diversity indices were
obtained, including the Patrick,
Simpson, Shannon, and Pielou indices[13]. Second, using the horizontal directions of latitude and longitude, the nine
plots were divided into five latitudinal and five longitudinal intervals with
0.5?? and 0.45?? intervals arranged from south to north and from west to east,
respectively; the nine plots were divided into six elevational intervals from
low to high elevation with an interval of 100 m[4]. Species in
different plots were merged in each geographical interval. Unlike ??-diversity, measurements of ??-diversity could be separated into two
methods: binary attribute data and quantitative data. Hence, we used two
indices, the Cody and Sørenson indices, in the analysis of ??-diversity based on binary attribute data; in addition, we used
the Bray–Curtis Index based on quantitative data[4]. Lastly, the
total number of species present (i.e., total species richness) in each
geographic interval (five latitudinal and longitudinal gradients together with
six elevational gradients) was defined as an indicator of ??-diversity[4].
(2)
Calculations on biomass of plant community
Aboveground,
belowground, and total biomass as well as the root-to-shoot ratio
were adopted as biomass indicators [17,18].
4 Data Results and Validation
4.1 Data Composition
This dataset includes six types of data
collected for the studied subalpine grasslands in Shanxi province as described
below in six tables. Table 1 includes the names and geographical locations of
mountains with experimental plots, including the Chinese and English names of mountains,
abbreviations of these names, latitude, longitude, and elevation. Table 2 lists
the ??-diversity indices, including the Patrick,
Simpson, Shannon, and Pielou indices. Table 3 provides the division of geographical intervals and the
??-diversity indices, mainly covering the geographic gradient range along with
the Cody, Sørenson, and Bray–Curtis
indices. Table 4 has the ??-diversity indices, mainly covering the
geographic gradient range and Richness Index. Table 5
provides the biomass indices, and mainly includes above- and below-ground
biomass, total biomass, and the root-to-shoot ratio. Table 6
contains the data for correlations between ??-diversity and biomass, which
mainly cover the Patrick, Simpson,
Shannon, and Pielou indices as well as above- and below-ground
biomass, total biomass, and the root-to-shoot ratio. The .xlsx file-format data were from plot surveys and were
summarized in an Excel file named ??Diversity&BiomassSub-alpineMeadowsShanxi??.
The .shp file-format
data in GIS, which provide plot locations, were summarized in a
file named ??SampleSites??.
4.2 Data Products
At each mountain, six survey quadrats for
measuring plant community species diversity were established. Four ??-diversity
indices were calculated by measuring plant growth, specifically the Patrick, Simpson, Shannon, and Pielou indices (Table 3).
Based on the division on geographic intervals of different mountains, three ??-diversity indices were
calculated, specifically, the Cody, Sørenson, and Bray–Curtis indices (Table 4).
In addition, one ??-diversity index was calculated for the Richness Index with
the same way (Table 5).
Table
3 ??-diversity indices of subalpine grasslands
in Shanxi province
|
Mountain
|
Quadrat
|
Patrick index
|
Simpson index
|
Shannon index
|
Pielou index
|
|
Malun
|
1
|
11
|
0.790
|
1.906
|
0.795
|
|
2
|
10
|
0.833
|
1.961
|
0.852
|
|
3
|
11
|
0.787
|
1.933
|
0.806
|
|
4
|
11
|
0.825
|
1.988
|
0.829
|
|
5
|
10
|
0.800
|
1.866
|
0.810
|
|
6
|
11
|
0.812
|
1.942
|
0.810
|
|
Heyeping
|
1
|
12
|
0.871
|
2.208
|
0.888
|
(To be continued on the next page)
(Continued)
|
Mountain
|
Quadrat
|
Patrick index
|
Simpson index
|
Shannon index
|
Pielou index
|
|
Heyeping
|
2
|
14
|
0.899
|
2.459
|
0.932
|
|
3
|
11
|
0.851
|
2.097
|
0.874
|
|
4
|
16
|
0.867
|
2.319
|
0.836
|
|
5
|
14
|
0.891
|
2.389
|
0.905
|
|
6
|
18
|
0.901
|
2.540
|
0.879
|
|
Yunzhong
|
1
|
23
|
0.920
|
2.787
|
0.889
|
|
2
|
22
|
0.936
|
2.899
|
0.938
|
|
3
|
26
|
0.939
|
3.023
|
0.928
|
|
4
|
23
|
0.905
|
2.711
|
0.865
|
|
5
|
35
|
0.901
|
2.827
|
0.795
|
|
6
|
29
|
0.921
|
2.902
|
0.862
|
|
Yunding
|
1
|
16
|
0.890
|
2.431
|
0.877
|
|
2
|
18
|
0.900
|
2.507
|
0.867
|
|
3
|
18
|
0.894
|
2.505
|
0.867
|
|
4
|
19
|
0.872
|
2.392
|
0.812
|
|
5
|
19
|
0.882
|
2.529
|
0.859
|
|
6
|
17
|
0.888
|
2.474
|
0.873
|
|
Dianding
|
1
|
23
|
0.888
|
2.596
|
0.828
|
|
2
|
21
|
0.927
|
2.761
|
0.907
|
|
3
|
23
|
0.924
|
2.817
|
0.899
|
|
4
|
21
|
0.894
|
2.667
|
0.876
|
|
5
|
19
|
0.904
|
2.609
|
0.886
|
|
6
|
25
|
0.861
|
2.619
|
0.813
|
|
Dongtai
|
1
|
24
|
0.925
|
2.863
|
0.901
|
|
2
|
25
|
0.929
|
2.878
|
0.894
|
|
3
|
24
|
0.892
|
2.709
|
0.853
|
|
4
|
30
|
0.905
|
2.840
|
0.835
|
|
5
|
22
|
0.925
|
2.797
|
0.905
|
|
6
|
25
|
0.896
|
2.768
|
0.860
|
|
Beitai
|
1
|
13
|
0.842
|
2.135
|
0.833
|
|
2
|
12
|
0.859
|
2.194
|
0.883
|
|
3
|
19
|
0.884
|
2.574
|
0.874
|
|
4
|
18
|
0.874
|
2.375
|
0.822
|
|
5
|
15
|
0.850
|
2.268
|
0.837
|
|
6
|
18
|
0.870
|
2.400
|
0.830
|
|
Shunwangping
|
1
|
19
|
0.881
|
2.439
|
0.828
|
|
2
|
22
|
0.868
|
2.430
|
0.786
|
|
3
|
20
|
0.916
|
2.709
|
0.904
|
|
4
|
21
|
0.843
|
2.421
|
0.795
|
|
5
|
18
|
0.864
|
2.334
|
0.808
|
|
6
|
22
|
0.898
|
2.664
|
0.862
|
|
Shengwangping
|
1
|
19
|
0.857
|
2.384
|
0.810
|
|
2
|
21
|
0.901
|
2.641
|
0.868
|
|
3
|
18
|
0.875
|
2.451
|
0.848
|
|
4
|
22
|
0.907
|
2.729
|
0.883
|
|
5
|
15
|
0.905
|
2.486
|
0.918
|
|
6
|
24
|
0.878
|
2.609
|
0.821
|
Table
4 ??-diversity indices of subalpine
grasslands in Shanxi province
|
Geographic belt
|
Number
|
Cody index
|
Sørenson index
|
Bray–Curtis index
|
|
Latitude belt/??
|
1—2
|
26.0
|
0.553
|
0.395
|
|
2—3
|
18.5
|
0.407
|
1.295
|
(To be continued on the next page)
(Continued)
|
Geographic belt
|
Number
|
Cody index
|
Sørenson index
|
Bray–Curtis index
|
|
Latitude belt/??
|
3—4
|
15.5
|
0.295
|
1.380
|
|
4—5
|
14.0
|
0.318
|
1.061
|
|
1—2
|
26.0
|
0.553
|
0.395
|
|
1—3
|
23.5
|
0.409
|
0.551
|
|
1—4
|
23.0
|
0.426
|
0.526
|
|
1—5
|
19.0
|
0.388
|
0.587
|
|
Longitude belt/??
|
1—2
|
18.0
|
0.429
|
1.150
|
|
2—3
|
19.0
|
0.317
|
0.803
|
|
3—4
|
22.0
|
0.367
|
0.732
|
|
4—5
|
13.0
|
0.295
|
1.079
|
|
1—2
|
18.0
|
0.429
|
1.150
|
|
1—3
|
23.0
|
0.434
|
0.706
|
|
1—4
|
16.0
|
0.381
|
1.286
|
|
1—5
|
16.0
|
0.432
|
1.252
|
|
Elevation belt/m
|
1—2
|
25.5
|
0.459
|
0.655
|
|
2—3
|
18.5
|
0.333
|
0.987
|
|
3—4
|
16.0
|
0.410
|
1.294
|
|
4—5
|
12.0
|
0.387
|
1.602
|
|
5—6
|
9.5
|
0.358
|
2.660
|
|
1—2
|
25.5
|
0.459
|
0.655
|
|
1—3
|
22.0
|
0.512
|
0.643
|
|
1—4
|
24.0
|
0.615
|
0.392
|
|
1—5
|
21.0
|
0.600
|
0.682
|
|
1—6
|
24.5
|
0.710
|
0.566
|
Table 5 ??-diversity indices of subalpine
grasslands in Shanxi province
|
Geographical gradient
|
Range
|
Richness index
|
|
Latitude/??
|
35-35.5
|
59
|
|
37.5-38
|
35
|
|
38.5-39
|
56
|
|
39-39.5
|
49
|
|
39.5-40
|
39
|
|
Longitude/??
|
111.15-111.6
|
35
|
|
111.6-112.05
|
49
|
|
112.05-112.5
|
71
|
|
113.4-113.85
|
49
|
|
113.85-114.3
|
39
|
|
Elevation/m
|
1,700-1,800
|
43
|
|
2,200-2,300
|
68
|
|
2,500-2,600
|
43
|
|
2,600-2,700
|
35
|
|
2,700-2,800
|
27
|
|
3,000-3,100
|
26
|
At each mountain,
five survey quadrats were used to measure plant community biomass by measuring
the weights of above- and below-ground plant parts, and four biomass indices
were obtained as described above (Table 6). Because the plant biomass quadrats
were designed as species diversity quadrats, the
correlations between ??-diversity and biomass could be calculated. Among these
correlations, the distribution of eight indices included the Patrick, Simpson, Shannon, and Pielou
indices, as well as above- and below-ground
Table
6 Biomass indices of subalpine grasslands
in Shanxi province
|
Mountain
|
Quadrat
|
Aboveground biomass /(g/m2)
|
Belowground biomass /(g/m2)
|
Total biomass /(g/m2)
|
Root:shoot ratio
|
|
Shengwangping
|
1
|
297.00
|
589.00
|
886.00
|
1.983
|
|
2
|
251.00
|
330.00
|
581.00
|
1.315
|
|
3
|
227.00
|
207.25
|
434.25
|
0.913
|
|
4
|
468.75
|
861.50
|
1,330.25
|
1.838
|
|
5
|
481.00
|
306.00
|
787.00
|
0.636
|
|
Shunwangping
|
1
|
271.00
|
466.00
|
737.00
|
1.720
|
|
2
|
405.25
|
647.50
|
1,052.75
|
1.598
|
|
3
|
206.25
|
264.50
|
470.75
|
1.282
|
|
4
|
140.00
|
411.25
|
551.25
|
2.938
|
|
5
|
443.25
|
288.75
|
732.00
|
0.651
|
|
Yunzhong
|
1
|
127.25
|
183.25
|
310.50
|
1.440
|
|
2
|
74.00
|
140.50
|
214.50
|
1.899
|
|
3
|
121.00
|
244.50
|
365.50
|
2.021
|
|
4
|
106.25
|
529.25
|
635.50
|
4.981
|
|
5
|
288.50
|
192.75
|
481.25
|
0.668
|
|
Dianding
|
1
|
154.50
|
836.50
|
991.00
|
5.414
|
|
2
|
66.25
|
221.50
|
287.75
|
3.343
|
|
3
|
165.25
|
334.25
|
499.50
|
2.023
|
|
4
|
103.75
|
357.50
|
461.25
|
3.446
|
|
5
|
142.25
|
1,012.00
|
1,154.25
|
7.114
|
|
Dongtai
|
1
|
113.75
|
397.25
|
511.00
|
3.492
|
|
2
|
114.25
|
594.50
|
708.75
|
5.204
|
|
3
|
162.75
|
333.50
|
496.25
|
2.049
|
|
4
|
123.50
|
403.25
|
526.75
|
3.265
|
|
5
|
111.25
|
342.00
|
453.25
|
3.074
|
|
Yunding
|
1
|
45.25
|
614.75
|
660.00
|
13.586
|
|
2
|
73.75
|
281.00
|
354.75
|
3.810
|
|
3
|
70.75
|
215.75
|
286.50
|
3.049
|
|
4
|
32.50
|
275.50
|
308.00
|
8.477
|
|
5
|
52.00
|
163.25
|
215.25
|
3.139
|
|
Malun
|
1
|
69.00
|
530.25
|
599.25
|
7.685
|
|
2
|
79.25
|
390.50
|
469.75
|
4.927
|
|
3
|
72.75
|
320.75
|
393.50
|
4.409
|
|
4
|
87.25
|
423.50
|
510.75
|
4.854
|
|
5
|
52.25
|
183.00
|
235.25
|
3.502
|
|
Heyeping
|
1
|
167.75
|
632.25
|
800.00
|
3.769
|
|
2
|
154.25
|
996.75
|
1,151.00
|
6.462
|
|
3
|
317.25
|
820.00
|
1,137.25
|
2.585
|
|
4
|
292.50
|
795.00
|
1,087.50
|
2.718
|
|
5
|
244.50
|
695.25
|
939.75
|
2.844
|
|
Beitai
|
1
|
136.75
|
1,250.25
|
1,387.00
|
9.143
|
|
2
|
57.25
|
747.50
|
804.75
|
13.057
|
|
3
|
77.00
|
1,045.50
|
1,122.50
|
13.578
|
|
4
|
77.25
|
573.25
|
650.50
|
7.421
|
|
5
|
79.50
|
890.50
|
970.00
|
11.201
|
biomass,
total biomass, and the root–shoot ratio in different quadrats (Figure 5).
The following results were obtained from
the above dataset. The ??-diversity of
subalpine grasslands presented unimodal change patterns with smaller values in the
central mountains. The ??-diversity
had tendencies to decrease with increasing spatial gradients and amplitudes
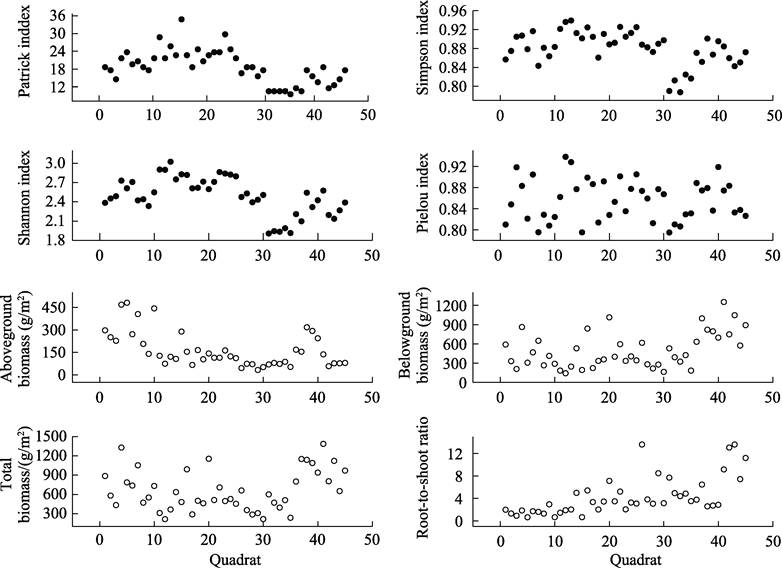
Figure 5 Distribution Data for correlation between
??-diversity and biomass of subalpine grasslands in Shanxi province
of
variation that were greatest along latitudinal gradients. The ??-diversity generally conformed to
unimodal change patterns in spatial distribution and the spatial distribution of biomass in subalpine grasslands tended to exhibit high geographical gradients where more biomass
was allocated to belowground plant parts with
increased spatial gradients[4]. These results are described in
detail in Xu et al.[4].
4.3 Data Validation
The
following conclusions were obtained from the dataset. The unique
geomorphological structures with a series of basins between mountain systems from
the east of the Loess Plateau have resulted in the subalpine grasslands
being mostly distributed along latitudinal directions. As a result, the spatial
distributions of species diversity and biomass were more evident along
latitudinal gradients, and thus the response of aboveground biomass was more
sensitive to variations of spatial gradients and species diversity[4].
Meanwhile, by the published references [12, 19, 20]
and the simulated warming experiment in Lvliang Mountain in 2016[21–24], we concluded that species diversity of subalpine grasslands exerted a spatial pattern with an increase from north to south in the
eastern Loess Plateau of China.
5 Discussion and Conclusion
Species distribution patterns are the result
of many ecological processes, but researchers have come to a wide variety of
conclusions during studies of species diversity and biomass together with their
correlation, owing to discrepancies in study scales, projects, and areas[25].
This was mainly reflected in: (1) topographical differences were eliminated by
using studies at larger geographical scales, but concrete differences in
community diversity were neglected when geographical units had small scales;
(2) simulation studies were carried out in homogeneous habitats and
humanly-modified communities at small scales, but the influence of stronger
spatial heterogeneity caused by enlargements of scale were omitted in studies
of diversity and productivity; and (3) in research studies conducted in
mountainous areas, scales have been focused only on a single space level and
lacked systematic research in mountains at overall spatial-scale hierarchies[9,
25]. The conclusion of different distribution patterns as well as the
interaction between species diversity and biomass from this dataset probably
agreed with the biogeographic affinity hypothesis; that is, the ability of
species to tolerate local climate probably developed under dual effects of
Earth??s climates and species evolution in ecological niches[26].
Meanwhile, this conclusion supports our common understanding that high levels
of species diversity provide an important way for ecosystems to maintain
biomass; that is, greater species diversity allows for
accommodation to an environment by providing for species redundancy and
functional complementation[26]. Thereby, from a level of plant
population in natural conditions, species diversity has important significance
that contributes to the discussion of spatial distributions along with
correlations of species diversity and biomass at various levels; this
illuminates the internal mechanisms of functional relationships between
biodiversity and ecosystems.
Author Contributions
Xu,
M. H. designed the algorithms of dataset. Zhao, Z. T. contributed to the data
processing and analysis. Xu, M. H. wrote the data paper.
Conflicts of Interest
The authors
declare no conflicts of interest.
References
[1]
Fraser,
L. H., Pither, J., Jentsch, A., et al.
Worldwide evidence of a unimodal relationship between productivity and plant
species richness [J]. Science, 2015,
349(6245): 302‒305.
[2]
Grace,
J. B., Anderson, T. M., Seabloom, E. W., et
al. Integrative modelling reveals mechanisms linking productivity and plant
species richness [J]. Nature, 2016,
529(7586): 390‒393.
[3]
Xu,
M. H., Du, R., Li, X. L., et al. The
mid-domain effect of mountainous plants is determined by community life form
and family flora on the Loess Plateau of China [J]. Scientific Reports, 2021, 11: 10974.
[4]
Xu,
M. H., Zhang, S. X., Wen, J., et al.
Multiscale spatial patterns of species diversity and biomass together with
their correlations along geographical gradients in subalpine meadows [J]. PLoS ONE, 2019, 14(2): e0211560.
[5]
Ma,
L., Xu, M. H., Zhou, H. K., et al.
Geographical distribution of vegetation biomass of subalpine meadow in Shanxi
province [J]. Chinese Journal of Ecology,
2018, 37(8): 2244‒2253.
[6]
Poorter,
H., Niklas, K. J., Reich, P. B., et al.
Biomass allocation to leaves, stems and roots: Meta-analyses of interspecific
variation and environmental control [J]. New
Phytologist, 2012, 193(1): 30‒50.
[7]
Duncanson,
L. I., Dubayah, R. O., Enquist, B. J. Assessing the general patterns of forest
structure: Quantifying tree and forest allometric scaling relationships in the
United States [J]. Global Ecology and
Biogeography, 2015, 24(12): 1465‒1475.
[8]
Li,
X. L., Xu, M. H., Meng, W. Z., et al.
Effects of experimental warming on the hydrothermic factor and community
structure of subalpine meadow on Yunding Mountain, Shanxi province, China [J]. Acta Ecologica Sinica, 2020, 40(19):
6885‒6896.
[9]
Xu,
M. H., Li, X. L. Review of response of grassland community stability to global
warming based on correlation between species biodiversity and biomass [J]. Acta Botanica Boreali-Occidentalia Sinica,
2021, 41(2): 348‒358.
[10]
Chao,
Q., Wen, J., Yang, X. Y., et al.
Responses of subalpine meadow species diversity to simulated warming in the
Yunding Mountain [J]. Environmental
Ecology, 2019, 1(4): 34‒40.
[11]
Wang,
Y. T., Bi, Y. T., Wang, Q., et al.
Spatial differentiation of plant species diversity in subalpine meadows in
Shanxi province [J]. Chinese Agricultural
Science Bulletin, 2018, 34(18): 77‒83.
[12]
Zhang,
S. X., Yang, X. Y., Wen, J., et al.
Spatial and temporal patterns of species diversity of subalpine meadows in the
Lvliang Mountains, Shanxi province [J]. Acta
Ecologica Sinica, 2018, 38(18): 6685‒6693.
[13]
Xu,
M. H., Ma, L., Jia, Y. Y., et al.
Integrating the effects of latitude and altitude on the spatial differentiation
of plant community diversity in a mountainous ecosystem in China [J]. PLoS ONE, 2017, 12(3): e0174231.
[14]
Xu,
M. H., Li, X. L., Liu, M., et al.
Spatial variation patterns of plant herbaceous community response to warming
along latitudinal and altitudinal gradients in mountainous forests of the Loess
Plateau, China [J]. Environmental and
Experimental Botany, 2020, 172: 103983.
[15]
Xu,
M. H., Zhao, Z. T. In situ dataset of
species diversity and biomass of subalpine meadows in Shanxi province of China
[J/DB/OL]. Digital Journal of Global
Change Data Repository, 2022. https://doi.org/10.3974/geodb.2022.05.03.V1.
[16]
GCdataPR
Editorial Office. GCdataPR data sharing policy [OL].
https://doi.org/10.3974/dp.policy.2014.05 (Updated 2017).
[17]
Xu,
M. H., Wen, J., Zhang, S. X., et al.
Root biomass dataset for alpine meadows in the Qinghai-Tibetan Plateau under
experimental warming [J]. Journal of
Global Change Data & Discovery,
2017, 1(4): 475‒480.
[18]
Xu,
M. H. Root biomass dataset of alpine meadow in Qinghai-Tibetan Plateau under
the artificial climate warming experiment [J/DB/OL]. Digital Journal of Global Change Data Repository, 2017.
https://doi.org/10.3974/geodb.2017.02.15.V1.
[19]
Zhang,
S. X., Yang, X. Y., Wen, J., et al.
Dataset of species diversity index of subalpine meadows in Lvliang Mountain,
China (2015-2017) [J/DB/OL]. Digital Journal of Global Change Data Repository, 2019.
https://doi.org/10.3974/geodb.2019.01.06.V1.
[20]
Zhang,
S. X., Qin, R. M., Yang, X. Y., et al.
Patterns of species diversity in herbaceous communities at different altitude
gradients and their relationships with environmental factors in Luliang
Mountains in Shanxi province, China [J]. Guihaia,
2020, 40(12): 1860‒1868.
[21]
Liu,
M., Zhang, X. Y., Li, X. L., et al.
Short-term responses of under-canopy grasslands to the experimental warming on
the Loess Plateau, China [J]. Acta
Ecologica Sinica, 2020, 40(17): 6009‒6024.
[22]
Xu,
M. H., Du, R., Yang, X. H., et al.
Response of plants to simulated warming in under-canopy herbaceous layers on
the Guancen Mountain [J]. Chinese Wild
Plant Resources, 2021, 40(10): 45‒52.
[23]
Yang,
X. Y., Qin, R. M., Zhang, S. X., et al.
Response of herb community to simulated warming and its relationship with
environmental factors in Luliang Mountain, Shanxi, China [J]. Southwest China Journal of Agricultural
Sciences, 2020, 33(6): 1291‒1300.
[24]
Yang,
X. Y., Zhang, S. X., Wen, J., et al.
Spatial pattern of herbaceous plant species diversity and its changes due to
simulated warming in the forest community of the Luliang Mountains [J]. Acta Ecologica Sinica, 2018, 38(18):
6642‒6654.
[25]
Xu,
M. H., Ma, L., Bai, H. Y., et al.
Vertical spatial differentiation of vegetation community diversity in Lvliang
Mountains, Shanxi province [J]. Jiangsu
Agricultural Sciences, 2017, 45(12): 256‒260.
[26] Zhu, G. L., Li, J., Wei, X. H., et
al. Longitudinal patterns of productivity and plant diversity in Tibetan
alpine grasslands [J]. Journal of Natural
Resources, 2017, 32(2): 210‒222.