Dataset Development of Precipitation
Moisture Sources of Five Grid Cells at the Boundary and Center of the Qinghai-Xizang
Plateau
Zhang, C.
Key
Laboratory of Land Surface Pattern and Simulation, Institute of Geographic
Sciences and Natural Resources Research, Chinese
Academy of Sciences, Beijing 100101, China
Abstract:
The climate of the Qinghai-Xizang Plateau is influenced by 3 major circulation
systems: westerly circulation, monsoon systems, and local circulation. However,
these circulation systems affect different regions of the plateau to varying
degrees, resulting in specific precipitation distribution patterns. To reveal the
evolutionary rule of circulation systems regarding their impact on plateau
precipitation at a finer spatial scale, the team set up a grid network of 5
research grids across the plateau, selecting grid points at the east, west,
south, north boundaries, and the center of the plateau, and conducted
precipitation source tracking simulations at these grid points. The model uses
ERA5 reanalysis data, GPCP precipitation, and GLEAM evaporation as driving
data. Verification was performed through comparative experiments, ultimately
generating monthly precipitation source
data for the 5 grid points across the plateau. The dataset includes: the 5
research grid point locations; monthly precipitation moisture source data for
each of the 5 grids from 2011?C2020, with a spatial resolution of 1????1??, unit:
mm/mon; monthly precipitation data for each plateau grid from 2011?C2020, unit:
mm/mon. The dataset is archived in .nc, .tif, and .xlsx formats, consisting of
7 data files with a total data volume of 131 MB (compressed into 1 file, 98.8
MB).
Keywords: Qinghai-Xizang Plateau; precipitation; circulation influence; moisture
source
DOI: https://doi.org/10.3974/geodp.2025.02.07
Dataset Availability Statement:
The
dataset supporting this paper was published and is accessible through the Digital
Journal of Global Change Data Repository at: https://doi.org/10.3974/geodb.2024.09.03.V1.
1
Introduction
Precipitation
on the Qinghai-Xizang Plateau is primarily influenced by 3 circulation systems:
the westerlies, monsoon systems, and local circulation patterns[1,2].
These systems exhibit significant spatial heterogeneity across different
regions of the plateau, with variations not only in the dominant system but
also in the influence intensity of each circulation[3,4].
Existing research has established the dominant role of westerlies in the
northern Qinghai-Xizang Plateau and the control of monsoon systems in the
southern regions[4,5]. However,
in the transition zone where westerlies, monsoons, and local circulation
systems deeply intertwine, the mechanism of circulation systems?? modulation of
precipitation and their spatial evolution characteristics remain an urgent
scientific issue. Current research lacks a systematic analysis of moisture
sources for precipitation across the entire Qinghai-Xizang Plateau.
The Qinghai-Xizang Plateau requires 258 grid
points when filled with 1????1?? grids. Calculating and analyzing precipitation
moisture sources for each grid point would consume excessive computational and
storage resources. Moreover, different grid points within the same hydroclimatic
region have similar moisture sources and circulation influences, making
grid-by-grid precipitation source tracking unnecessary. To simply and
effectively characterize the spatial differences in plateau moisture sources
and reveal the spatial evolution of related circulation patterns over the
plateau, this study selected 4 boundary grid points at the extreme east, west,
north, and south, along with a central point (33??N, 92??E) as the center point,
forming a grid network. The 3 latitudinal grid points (extreme
west-center-extreme east) allow observation of the westerlies?? influence
changes from west to east across the plateau. The 3 longitudinal grid points
(extreme south-center-extreme north) enable observation of the South Asian monsoon??s
progression in the north-south direction.
For the 5
representative grids on the plateau, ERA5 atmospheric reanalysis data, GPCP (Global
Precipitation Climatology Project) precipitation, and GLEAM (Global Land
Evaporation Amsterdam Model) evaporation (detailed in the data section) were
used as driving data to track precipitation moisture sources using a numerical
model. To ensure result reliability and accuracy, comparative experiments were
designed for verification[6],
ultimately generating monthly precipitation source data for the 5 plateau grid
cells from 2011 to 2020. This dataset provides scientific evidence for
revealing the spatial evolution patterns of circulation systems and delineating
the dominant influence regions of different circulation systems on the plateau.
2 Metadata of the Dataset
The
metadata of Precipitation moisture sources simulating dataset for five grid
cells at the boundary and center of Qingzang Plateau[7]
is summarized in Table 1. It includes the dataset full name, short name,
authors, year of the dataset, temporal resolution, spatial resolution, data
format, data size, data files, data publisher, etc.
3 Methods
3.1 Model
This
study uses the Eulerian numerical model WAM2Layers (Water Accounting
Model-2layers) to track moisture sources for precipitation at plateau grid
cells. The model divides the atmosphere into 2 vertical layers, a design that
effectively overcomes the tracking errors of the previous WAM model in case of
vertical wind direction shear, significantly improving the accuracy of dynamic
moisture tracking[9,10]. An
extended version of the WAM2Layers model was used to process pressure level
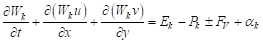
data from ERA5[11,12]. The model??s basic equation is:
 (1)
(1)
where
W represents atmospheric precipitable water (mm), k represents
upper or lower atmospheric layer, u and v are horizontal wind
speeds (m/s), E is surface evaporation (mm), P is precipitation (mm),
FV represents vertical moisture transport between layers (mm),
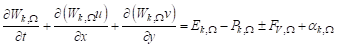
and ?? is the residual term. Moisture from a specific source region ??
follows a similar atmospheric water balance equation:
 (2)
(2)
Table
1 Metadata summary of MoistureSource5GridCellsQZP
|
Items
|
Description
|
|
Dataset full name
|
Precipitation
moisture sources simulating dataset for five grid cells at the boundary and
center of Qingzang Plateau
|
|
Dataset short
name
|
MoistureSource5GridCellsQZP
|
|
Authors
|
Zhang, C.,
Institute of Geographic Sciences and Natural Resources Research, Chinese
Academy of Sciences, zhangchi@igsnrr.ac.cn
Zhang, X.,
Institute of Geographic Sciences and Natural Resources Research, Chinese
Academy of Sciences, zhangxu246810@126.com
Tang, Q. H., Institute of Geographic
Sciences and Natural Resources Research, Chinese Academy of Sciences,
tangqh@igsnrr.ac.cn
Huang, J. C., Institute of Geographic
Sciences and Natural Resources Research, Chinese Academy of Sciences,
huangjc@igsnrr.ac.cn
Zhou, Y. Y.,
Institute of Geographic Sciences and Natural Resources Research, Chinese
Academy of Sciences, zhouyy@igsnrr.ac.cn
Gaffney, P. P. J.,
Institute of Geographic Sciences and Natural Resources Research, Chinese
Academy of Sciences, gafppj@igsnrr.ac.cn
Xu, X. M.,
Institute of Geographic Sciences and Natural Resources Research, Chinese
Academy of Sciences, xuxm@igsnrr.ac.cn
|
|
Geographical
region
|
Qinghai-Xizang
Plateau
|
|
Year
|
2011?C2020
|
|
Temporal
resolution
|
Monthly
|
|
Spatial
resolution
|
1????1??
|
|
Data format
|
.nc, .tif, .xlsx
|
|
|
|
Data size
|
98.8 MB??after compression??
|
|
|
|
Data files
|
Locations of 5
grid cells on the Qinghai-Xizang Plateau, monthly precipitation for these 5
grid cells during the 10 years, monthly moisture sources for precipitation of
the 5 grids
|
|
Foundations
|
National Natural
Science Foundation of China (U2243226); China Scholarship Council
(202310490002)
|
|
Data publisher
|
Global Change Research Data Publishing & Repository,
http://www.geodoi.ac.cn
|
|
Address
|
No. 11A, Datun
Road, Chaoyang District, Beijing 100101, China
|
|
Data sharing
policy
|
(1) Data are openly available and can be
free downloaded via the Internet; (2) End users are encouraged to use Data subject to citation; (3) Users,
who are by definition also value-added service providers, are welcome to
redistribute Data subject to
written permission from the GCdataPR Editorial Office and the issuance of a Data redistribution license; and (4)
If Data are used to compile new
datasets, the ??ten percent principal?? should be followed such that Data records utilized should not
surpass 10% of the new dataset contents, while sources should be clearly
noted in suitable places in the new dataset[8]
|
|
Communication and searchable system
|
DOI, CSTR,
Crossref, DCI, CSCD, CNKI, SciEngine, WDS, GEOSS, PubScholar, CKRSC
|
3.2 Data Sources and
Processing
Driving
data consists of atmospheric data and land surface flux data. The atmospheric
data uses ERA5[13], the new generation reanalysis data from the
European Centre for Medium-Range Weather Forecasts, which includes hourly wind
speed and atmospheric humidity across 23 pressure levels from 200?C1,000 hPa
globally, as well as hourly surface atmospheric pressure, precipitable water,
and horizontal moisture flux. The spatial resolution is 1????1??. These data are
used to calculate variables in Equation 1, such as precipitable water and
moisture flux in upper and lower atmospheric layers, and vertical moisture
transport between the 2 layers. All hourly variables are converted to 15-minute
intervals through linear interpolation or equal division methods for model
input.
Since ERA5??s
evaporation and precipitation fluxes over the Qinghai-Xizang Plateau rely
entirely on model output without assimilating any observation[13],
there are significant uncertainties in the data. In view of this, this study
adopted the remote sensing-based land evaporation product of the Global Land Evaporation
Amsterdam Model (GLEAM, v3.5a)[14]
and the merged satellite/gauge precipitation product of Global Precipitation
Climatology Project One-Degree Daily (GPCP1DD, v1.3)[15]
to improve data quality. GLEAM provides monthly-scale data with a spatial
resolution of 0.25????0.25??; GPCP1DD provides daily-scale data with a spatial
resolution of 1????1??. To maintain consistency with ERA5??s spatial grid, the
authors resampled GLEAM and GPCP data to ERA5??s spatial resolution through
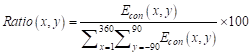
bilinear interpolation and other methods. Subsequently, monthly ratio series
for each grid point were calculated for the period 2011?C2020 by dividing the
monthly values of GLEAM and GPCP by corresponding ERA5 monthly values. Using
these ratios, the authors corrected ERA5??s hourly evaporation and precipitation
data, creating a new high temporal resolution dataset. Finally, to meet model
input requirements, we converted the corrected hourly data to 15-minute
interval time series through equal division methods.
3.3 Simulation
Experiment Description
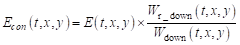
After the numerical experiments, the simulation
data needs to be processed. The experiment outputs the tagged water content for
any time step and grid column. For the lower atmospheric layer, within the
evaporation e at a time step, e??r of water vapor will
eventually form direct precipitation in the target region, which can be
expressed by the following formula:
 (3)
(3)
where
Wr_down/Wdown represents the proportion r
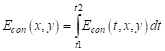
of tagged water content in the lower atmosphere. By integrating all e??r,
we obtain the monthly water vapor contribution from the grid-scale evaporation
source to the precipitation sink in the plateau study grids:
 (4)
(4)
where
the unit of  is m3/mon. Since this study traces the moisture
sources of precipitation at grid scale, the units of precipitation moisture
sources in the dataset are all converted to precipitation flux units for the
study grid, i.e., mm/mon. Due to huge differences in precipitation amounts
between different grids (for example, the annual precipitation comparison
between the south and north plateau grids is 978 mm : 63 mm), there would be
legend scale issues when directly displaying the numerical results of moisture
sources. Therefore, it is standardized (Equation 5) and converted to the
percentage of moisture contribution from different grids relative to the total
moisture contribution from all grids, to highlight the relative impact of
different source regions.
is m3/mon. Since this study traces the moisture
sources of precipitation at grid scale, the units of precipitation moisture
sources in the dataset are all converted to precipitation flux units for the
study grid, i.e., mm/mon. Due to huge differences in precipitation amounts
between different grids (for example, the annual precipitation comparison
between the south and north plateau grids is 978 mm : 63 mm), there would be
legend scale issues when directly displaying the numerical results of moisture
sources. Therefore, it is standardized (Equation 5) and converted to the
percentage of moisture contribution from different grids relative to the total
moisture contribution from all grids, to highlight the relative impact of
different source regions.
 (5)
(5)
4 Data Results
4.1 Dataset Composition
The
dataset consists of 7 data files, including: locations of 5 grid cells on the
Qinghai-Xizang Plateau (in .tif format); monthly precipitation for these 5 grid
cells during 2011?C2020 (mm/mon, in .xlsx format); monthly precipitation
moisture sources for the 5 grids with a spatial resolution of 1????1?? (mm/mon,
in .nc format).
4.2 Data Results
|
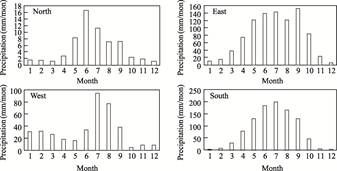
Figure 1 Average
monthly precipitation at Qinghai-Xizang Plateau
boundary grid cells (2011?C2020)
|
The multi-year average monthly precipitation variation at
plateau boundary grids (as shown in Figure 1) reveals unique precipitation
characteristics under boundary-location environments. Analysis shows that while
all 4 regions of the plateau display significant seasonal variations, each
region has its own distinctive features. The southern and northern regions best
exemplify the ??rain and heat in same season?? characteristic, with maximum
precipitation in summer and minimum in winter. This pattern reflects typical
monsoon climate features, not only suggesting significant influence from the
South Asian monsoon system but also raising an intriguing question worth deeper
investigation: whether the South Asian monsoon could potentially cross the
plateau to affect such northernmost regions.
The east grid
exhibits a double-peak pattern in monthly precipitation, occurring in July and
September, with September precipitation even exceeding July??s. This phenomenon
suggests that besides the South Asian monsoon, other weather systems might
affect the eastern plateau after the South Asian monsoon retreats in August.
This could be related to the East Asian monsoon or tropical cyclone systems,
warranting further research.
The west grid
also shows a double-peak pattern, but with peaks in February and July. This
unique pattern reveals 2 distinctly different systems dominating precipitation
in this region: the westerlies in winter and the South Asian monsoon in summer.
Horizontal comparison shows that the extreme western region has significantly
higher February precipitation than other regions, a phenomenon likely closely
related to topographical factors. When westerly flows encounter the Qinghai-Xizang
Plateau??s massive topographic barrier, they are forced to climb along the
windward slope, promoting moisture condensation and bringing abundant rain and
snow to this region. This mechanism highlights the plateau??s topography??s
crucial role in regulating regional precipitation distribution.
Analysis of
precipitation characteristics at plateau boundary grid cells shows that July is
the significant peak period for plateau precipitation, providing an ideal time
window to study moisture transport and water contribution from global
evaporation sources to precipitation across different regions of the plateau.
Figure 2 presents the normalized moisture source distribution for each boundary
grid point, revealing significant differences in precipitation moisture sources
across the four boundary positions of the plateau.
(1) Southernmost
grid: The South Asian monsoon influence is most prominent in this region. The
moisture sources show a distinct band-like distribution extending from the Bay
of Bengal through the Arabian Sea to the western edge of the Indian Ocean,
consistent with previously observed moisture source distribution patterns in
the southern plateau[16].
(2) Northernmost grid: Precipitation moisture
mainly originates from the northwestern plateau and Tianshan region, showing a
pattern drastically different from the southernmost grid. The moisture
contribution of monsoon from south of the plateau is minimal in this area, indicating that precipitation here is primarily
controlled by westerly circulation rather than the monsoon system. While Zhang,
et al. found that the monsoon region, despite its low contribution, was
still an important moisture source when studying moisture sources in the
northern plateau (north of 35??N)[16], this study further demonstrates
that the influence of the monsoon system weakens as the plateau grid moves
northward, becoming negligible in the northern regions.
|
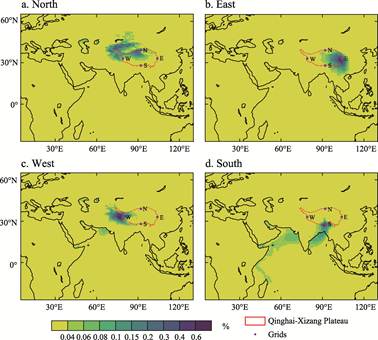
Figure
2 Distribution of average moisture
contribution from surface evaporation sources to precipitation at Qinghai-Xizang
Plateau boundary grid cells in July (Normalized)
|
(3) Easternmost grid: Located downstream of the
westerlies on the plateau, its moisture sources
exhibit complex dual characteristics. On
one hand, the eastern plateau region makes significant contributions to this
grid cell, reflecting the importance of local moisture circulation; on the
other hand, with the prevalence of the East Asian monsoon, evaporated moisture
from the southeast of the plateau also reaches this region through the East
Asian monsoon transport system, forming another important moisture source. This
composite pattern reveals the diversified characteristics of moisture transport
in this region.
(4) Westernmost grid:
The precipitation moisture sources are relatively concentrated, mainly
distributed around the western plateau region. However, distant water bodies
such as the Arabian Sea and the Caspian Sea also contribute to some extent to
precipitation at this grid point. This distribution pattern reflects the
combined effects of the westerlies and local moisture circulation, while also
suggesting the potential importance of long-distance moisture transport in
precipitation formation in this region.
5 Discussion and Conclusion
The
circulations affecting Qinghai-Xizang Plateau precipitation vary spatially
across the plateau. To reveal the spatial evolution of different circulation
systems?? influence over the plateau, the team selected representative study
grid cells around the 4 edges and center of the plateau to form a distribution
grid network, conducting precipitation source tracing at the grid scale. The
study used ERA5 reanalysis data, GPCP precipitation, and GLEAM evaporation as
the main model driving data, and designed and executed a series of comparative
experiments to ensure the reliability and accuracy of model results[6].
The research successfully developed monthly-scale precipitation moisture source
data for 5 grids across the eastern, western, southern, northern, and central Qinghai-Xizang
Plateau, providing a solid foundation for scientifically assessing the
evolution process of different circulation systems across various regions of
the Qinghai-Xizang Plateau.
Through
preliminary data analysis, we found that precipitation at plateau boundaries
not only reflects the influence of large-scale atmospheric circulation systems
(such as monsoons and westerlies) but also highlights the important role of
topography in shaping local climate characteristics, such as windward slopes
receiving more rain and snow in winter. Each region of the plateau has its
unique moisture source distribution pattern??the eastern and southern regions
are significantly influenced by monsoon systems, while the northern and western
regions are more affected by westerly circulation. The moisture source
distribution characteristics of different boundary grid cells not only reflect
the differentiated influence of large-scale atmospheric circulation systems but
also demonstrate the complex interactions between topography and local water
cycles in shaping regional precipitation patterns. These findings provide
important scientific basis for deeply understanding the Qinghai-Xizang Plateau??s
water cycle processes, assessing climate change impacts, and formulating
regional water resource management strategies. Future research could further
explore the seasonal variations of these moisture transport patterns and their
long-term impacts on plateau ecosystems and water resource sustainability.
Conflicts
of Interest
The authors
declare no conflicts of interest.
References
[1]
Zhang, C. Moisture source assessment and
the varying characteristics for the Tibetan Plateau precipitation using TRMM
[J]. Environmental Research Letters, 2020, 15(10): 104003.
[2]
Zhao, Y., Zhou, T. Interannual variability
of precipitation recycle ratio over the Tibetan Plateau [J]. Journal of
Geophysical Research: Atmospheres, 2021, 126(2): e2020JD033733.
[3]
Chen, B., Zhang, W., Yang, S., et al.
Identifying and contrasting the sources of the water vapor reaching the
subregions of the Tibetan Plateau during the wet season [J]. Climate
Dynamics, 2019, 53: 6891?C6907.
[4]
Yao, T. D., Masson-Delmotte, V., Gao, J., et
al. A review of climatic controls on ??18O in precipitation over
the Tibetan Plateau: observations and simulations [J]. Reviews of Geophysics,
2013, 51(4): 525?C548.
[5]
Zhang, C., Tang, Q. H., Chen, D. L., et
al. Moisture source changes contributed to different precipitation changes
over the northern and southern Tibetan Plateau [J]. Journal of
Hydrometeorology, 2019, 20(2): 217?C229.
[6]
Zhang, C., Zhang, X., Tang, Q. H., et
al. Quantifying precipitation moisture contributed by different atmospheric
circulations across the Tibetan Plateau [J]. Journal of Hydrology, 2024,
628: 130517.
[7]
Zhang, C., Zhang, X., Tang, Q. H., et
al.
Precipitation moisture sources simulating dataset for five grid cells at the boundary
and center of Qingzang Plateau [J/DB/OL]. Digital Journal of Global Change
Data Repository, 2024. https://doi.org/10.3974/geodb.2024.09.03.V1.
[8]
GCdataPR
Editorial Office. GCdataPR data sharing policy [OL].
https://doi.org/10.3974/dp.policy.2014.05 (Updated 2017).
[9]
van der Ent, R. J., Wang-Erlandsson, L.,
Keys, P. W., et al. Contrasting roles of interception and transpiration
in the hydrological cycle?Cpart 2: moisture recycling [J]. Earth System
Dynamics, 2014, 5(2): 471?C489.
[10]
van der Ent, R. J., Tuinenburg, O. A.,
Knoche, H. R., et al. Should we use a simple or complex model for
moisture recycling and atmospheric moisture tracking? [J] Hydrology and
Earth System Sciences, 2013, 17(12): 4869?C4884.
[11]
Liu, Y., Garcia, M., Zhang, C., et al.
Recent decrease in summer precipitation over the Iberian Peninsula closely
links to reduction in local moisture recycling [J]. Hydrology and Earth
System Sciences, 2022, 26(8): 1925?C1936.
[12]
Zhang, C., Chen, D. L., Tang, Q.
H., et al. Fate and changes in moisture evaporated from the Tibetan
Plateau (2000?C2020) [J]. Water Resources Research, 2023,
59(11): e2022WR034165.
[13]
Hersbach, H., Bell, B., Berrisford, P., et
al. The ERA5 global reanalysis [J]. Quarterly Journal of the Royal
Meteorological Society, 2020, 146(730): 1999?C2049.
[14]
Martens, B., Miralles, D. G., Lievens, H.,
et al. GLEAM v3: satellite-based land evaporation and root-zone soil
moisture [J]. Geoscientific Model Development, 2017, 10(5): 1903?C1925.
[15]
Huffman, G. J., Adler, R. F., Morrissey,
M. M., et al. Global precipitation at one-degree daily resolution from
multisatellite observations [J]. Journal of hydrometeorology, 2001,
2(1): 36?C50.
[16] Zhang,
C., Tang, Q. H., Chen, D. L., et al. Moisture source changes contributed
to different precipitation changes over the northern and southern Tibetan
Plateau [J]. Journal of Hydrometeorology, 2019, 20(2): 217?C229.