Establishment of a Yearly September?COctober Mean Temperature
Dataset during 1678?C2019 in Northwest Yunnan Province, China
Deng, G. F.1,2 Li,
M. Q.1*
1. Key Laboratory
of Land Pattern and Simulation, Institute of Geographic Science and Natural
Resources Research, Chinese Academy of Sciences, Beijing 100101, China;
2. University of
Chinese Academy of Sciences, Beijing 100049, China
Abstract: Tree-ring cores were collected from Abies delavayi Franch.
in November 2012 and 2019. The sampling site was in Gongshan Dulong and Nu
autonomous county, Yunnan province (98.48??E, 27.78??N; 3,245 m a.s.l.). X-ray
imaging was employed to obtain density data. Then, the program ARSTAN was used
to detrend and normalize the data, in which a 67% cubic smoothing spline with a
50% cut-off frequency was employed to fit the growth trend. Ultimately, we
retained the maximum latewood density (MXD) of 51 cores from 27 trees for
establishing a chronology of the period 1678?C2019. Based on the correlations
between MXD and climate variables, the residual chronology of MXD showed its
strongest correlation with the September?COctober mean temperature (T9?C10).
Thus, a transfer function was established with a linear regression model to
reconstruct the T9?C10 during the past 342 years (1678?C2019), with an
explained variance of 33% during the instrumental period. Leave-one-out
cross-validation showed the robustness of the reconstruction, with a reduction
of error reaching 0.29. Furthermore, the temperature series correlated
positively with other reconstructions in the surrounding areas, with
correlation coefficients of 0.458?C0.526. The dataset includes: (1) geographical
information of the sampling site; (2) the statistical characteristics of
tree-ring cores; (3) the residual chronology of the MXD for A. delavayi
and its reconstructed series of T9?C10; (4) the tree-ring residual
chronology statistics of the MXD for A. delavayi; and (5) the
temperature data used for the reconstruction. The dataset is archived in .shp
and .xlsx data formats, and consists of seven data files with a total data size
of 56.5 KB (compressed to a single 52.5 KB file).
Keywords: northwestern Yunnan province; maximum latewood density;
temperature reconstruction; long chronology
DOI: https://doi.org/10.3974/geodp.2022.03.02
CSTR: https://cstr.escience.org.cn/CSTR:20146.14.2022.03.02
Dataset Availability Statement:
The dataset
supporting this paper was published and is accessible through the Digital Journal of
Global Change Data Repository at: https://doi.org/10.3974/geodb. 2022.04.03.V1 or https://cstr.escience.org.cn/CSTR:20146.11.2022.04.03.V1.
1
Introduction
Tree rings are
widely used to reconstruct historical climate change because of their broad
distribution, high resolution, and accurate dating, providing fundamental
materials for exploring the driving mechanisms of climate change. Situated
southeast of the Tibetan Plateau (TP) and north of the Hengduan Mountains, the
terrain of northwestern Yunnan province is characterized by deep valleys with
steep sides, resulting in large horizontal and vertical differences in climate.
These complex geographical conditions have resulted in a diverse range of tree
species in our study area, such as Larix speciosa Cheng et Law, Abies
delavayi Franch., and Tsuga dumosa (D. Don) Eichler[1,2].
Such an abundance and richness of tree species help to provide sufficient
tree-ring materials for climate reconstruction. Owing to the warm and humid
climate in northwestern Yunnan province, the latewood density of conifers in
high-altitude areas is mainly affected by temperature in the growing season.
Previous studies have used the maximum latewood density (MXD) from L.
speciosa, Picea asperata Mast., and Picea brachytyla
(Franch.) Pritz. var. complanata (Mast.) Cheng ex Rehd. to reconstruct the mean temperature of the growing season or
late summer in the study area[3-5], and the longest of
which is a 319-year reconstruction of the August?CSeptember mean temperature
based on the MXD of L. speciosa. However, previous MXD-based
reconstructions show inconsistent warming trends over the past 30 years in the
eastern TP.
Analyses reveal that the climate in eastern
Tibetan autonomous region and western Sichuan has warmed faster than in
northwestern Yunnan province[6,7]. Such inconsistency may be
attributable to the detrending methods used or the environmental differences
among sampling sites across different studies[6,8].
The MXD used for reconstructions primally derives from P. likiangensis
var. balfouriana in eastern Tibetan autonomous region and western
Sichuan province, along with L. speciosa, A. georgei Orr var.
smithii (Viguie et Gaussen) Cheng et L., and P. asperata in
northwestern Yunnan province. Studies suggest that MXD-based reconstructions
from different species have different explained variances[4,5,7,9-14].
Therefore, more MXD-based reconstructions from different tree species should be
carried out to explore the possible influence of genetic factors. In this
study, a September?COctober temperature dataset for the period 1678?C2019 in
northwestern Yunnan was reconstructed based on the MXD of A. delavayi,
which is longer than previous MXD-based proxy records. This series provides a
useful reference for exploring the potential of tree-ring density from
different species in climate reconstruction.
2 Metadata of the Dataset
The details of the
September?COctober mean temperature dataset[15] during 1678?C2019 in
northwestern Yunnan are shown in Table 1, including the dataset??s full name,
short name, its authors, coverage period, temporal resolution, data format,
data size, data files, data publisher, and data sharing policy, etc.
3 Methods
3.1 Algorithm
Pearson??s correlation
coefficients between the MXD chronology and mean monthly temperature and
monthly precipitation during 1951?C2019 were calculated. The results indicated
that the mean temperature of September?COctober (T9?C10) has the
highest correlation with MXD. Linear regression was then performed to establish
the transfer function using MXD as predictors. After calibration, we introduced
the correlation coefficient between the reconstructed value and the observed
value (r), sign test (ST, ST1), product mean test (T),
reduction error (RE) and validity coefficient (CE) for
verification[17].
Table 1 Metadata summary of the Reconstruction dataset
of yearly September-October mean temperature from tree-ring maximum latewood
density of Abies
delavayi Franch. at northwest Yunnan province of China (1678-2019)
|
Items
|
Description
|
|
Dataset
full name
|
Reconstruction
dataset of yearly September-October mean temperature from tree-ring maximum
latewood density of Abies
delavayi Franch. at northwest Yunnan province of China (1678-2019)
|
|
Dataset
short name
|
MeanTemp9-10nwYunnan1678-2019
|
|
Authors
|
Deng,
G. F., Institute of Geographic Science and Natural Resources Research,
Chinese Academy of Sciences, dengguofu18@mails.ucas.ac.cn
Li,
M. Q., Institute of Geographic Science and Natural Resources Research,
Chinese Academy of Sciences, limq@igsnrr.ac.cn
|
|
Geographical
region
|
Northwestern
Yunnan province, China
|
|
Coverage
|
342
years (1678?C2019)
|
|
Temporal
resolution
|
Yearly
|
|
Data
format
|
.shp,
.xlsx
|
|
|
|
Data
size
|
56.5
KB (52.5 KB after compressed)
|
|
|
|
Data files
|
(1) Geographical information of
sampling site; (2) statistical characteristics of tree-ring cores; (3) residual
chronology of the MXD of A. delavayi and its reconstructed series of T9?C10;
(4) tree-ring residual chronology statistics of the MXD of A. delavayi;
and (5) temperature data used for reconstruction
|
|
Foundations
|
National
Natural Science Foundation of China (41977391, 41630529, 41571194); Ministry
of Science and Technology of P. R. China (2017YFA0603302)
|
|
Data
publisher
|
Global Change Research Data Publishing &
Repository, http://www.geodoi.ac.cn
|
|
Address
|
No.
11A, Datun Road, Chaoyang District, Beijing 100101, China
|
|
Data
sharing policy
|
Data from
the Global Change Research Data Publishing & Repository includes metadata, datasets
(in the Digital Journal of Global Change Data Repository), and
publications (in the Journal of Global Change Data & Discovery). Data sharing policy
includes: (1) Data are openly available and can be free downloaded via the
Internet; (2) End users are encouraged to use Data subject to
citation; (3) Users, who are by definition also value-added service
providers, are welcome to redistribute Data subject to written permission
from the GCdataPR Editorial Office and the issuance of a Data redistribution
license; and (4) If Data are used to compile new
datasets, the ??ten per cent principal?? should be followed such that Data
records utilized should not surpass 10% of the new dataset contents, while
sources should be clearly noted in suitable places in the new dataset[16]
|
|
Communication and searchable system
|
DOI, CSTR, Crossref, DCI, CSCD,
CNKI, SciEngine, WDS/ISC, GEOSS
|
The calculation of the test
statistic T of the product mean test is as follows:
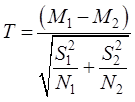 (1)
(1)
If the sign of the calibration anomaly is
the same as the observed data anomaly, the product of two anomalies is divided
into positive groups. Otherwise, the product is added to the negative group. and
and are the means of all positive and negative
products, respectively.
are the means of all positive and negative
products, respectively.  an
an  are the variance and number of products of the
positive product group, while
are the variance and number of products of the
positive product group, while and
and are the corresponding values of the negative
product group.
are the corresponding values of the negative
product group.
The RE and CE are
computed as:
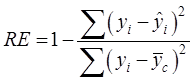 (2)
(2)
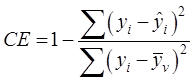 (3)
(3)
The variables and
and are the observed and reconstructed values during the verification
periods. The variables
are the observed and reconstructed values during the verification
periods. The variables and
and are the observed mean during the
calibration and verification period, respectively. When both RE and CE
are above zero, a high reliability of the reconstruction is suggested.
are the observed mean during the
calibration and verification period, respectively. When both RE and CE
are above zero, a high reliability of the reconstruction is suggested.
3.2 Data Collection and
Processing
Tree-ring
increment cores were collected in November 2012 and 2019 at a mixed forest of L.
speciosa and A. delavayi. The sampling site was on a
southwest-facing mountain slope at 98.48??E, 27.78??N
(3,245 m a.s.l.) in the north of the Gaoligong Mountains (Figure 1). To begin
with, the tree-ring cores were kept under natural conditions for drying, and
were cross-dated by a microscope. Then, the tree-ring width was measured using
the LINTAB6 measurement system with 0.01-mm precision. Next, the processes of
splitting and supporting, measuring fiber angles, cutting to slices,
eliminating resins, taking X-ray photography, developing films, and measuring
density were carried out. After obtaining MXD raw measurements, the program
ARSTAN was employed to develop MXD chronologies, with a 67% cubic smoothing
spline to fit the growth trend of each series[18]. Based on the
residual chronology of the MXD and gridded temperature data from CRU TS4.04
(average data of 98.25??E, 27.75??N and 98.75??E, 27.75??N),
linear regression analysis was performed to establish the
transfer function between T9?C10 and MXD during 1951?C2019. This
function was then used to reconstruct T9?C10 for the historical
period, and the series was compared with other reconstructions in the eastern
TP (Figure 2).
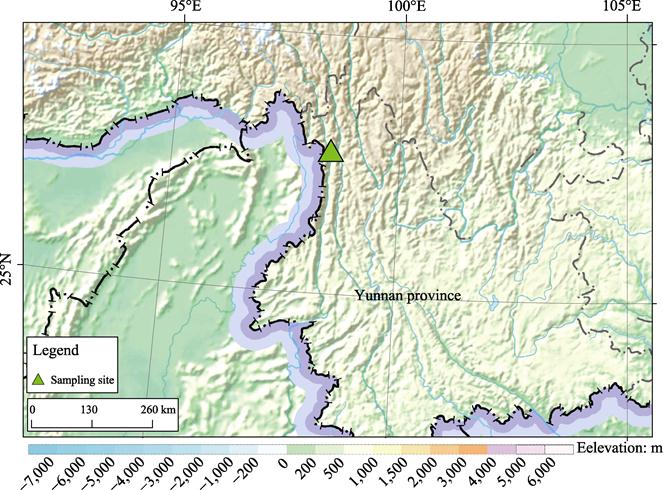
Figure 1 Location
of the sampling site
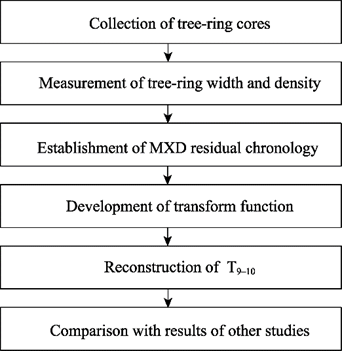
Figure
2 Flowchart showing the process of T9?C10
reconstruction in northwest Yunnan province
4 Data Results and Validation
4.1
Data Composition
The dataset
includes (1) geographical information of the sampling site; (2) statistical
characteristics of tree-ring cores; (3) the residual chronology of the MXD of A.
delavayi and its reconstructed series of T9?C10; (4) tree-ring
residual chronology statistics for the MXD of A. delavayi, and (5) the
temperature data used for reconstruction. The dataset is archived in .shp and
.xlsx data formats, and consists of 7 data files with a total data size of 56.5
KB (Compressed to a single 52.5 KB file).
4.2 Data
Results
The
reconstruction of T9?C10 covered the period 1678?C2019 A.D. (Figure
3). The regression produced the following
linear model for the calibration period of 1951?C2019: T9?C10 = 10.43 ?? MXD + 8.37. The model explained 33% (Radj2
= 32%) of the variance for the instrumental period. The statistics of the
calibration and validation are given in Table 2. The sign test results of the
leave-one-out cross validation are statistically significant at the 0.05 level.
The values of RE and the product mean t also passed the tests,
suggesting good estimation skill, with a correlation of 0.54 between observed
values and calibrated ones. We also performed a split-period validation. For
the calibration period of 1951?C1985, the sign tests for the first-difference
data (ST1) reached the 95% confidence level. Moreover, the RE and
CE values were above zero, suggesting good agreement between the
predicted and observed values. For the calibration period of 1986?C2019, the
sign tests for the original value did not reach the 95% confidence level, and
the CE was lower than zero. Although some test results were not
statistically significant during the calibration period of 1986?C2019, the test
results were statistically significant for the calibration periods of 1951?C2019
and 1951?C1985. The validation results suggest that the model is relatively
robust, with sufficient estimation skill.
Based on an 11-year moving average of the reconstruction,
warm intervals higher than the average historical temperature occurred in
1683?C1688, 1719?C1731, 1746?C1776, 1788?C1808, 1862?C1879, 1904?C1921, 1949?C1978,
and 2003?C2014. Conversely, a cold autumn appeared in 1689?C1701, 1707?C1718,
1738?C1745, 1777?C1782, 1809?C1826, 1828?C1846, 1885?C1890, 1922?C1944, and
1981?C2002. The coldest period of the past 342 years was 1809?C1826, with a
September?COctober mean temperature of 18.7 ??C, and the warmest one was in
1788?C1808, with a mean temperature of 18.9 ??C. Furthermore, the dataset shows the
warmest autumn
Table 2 Statistics of
calibration and validation
|
Calibration
|
Validation
|
|
Period
|
R2
|
Radj2
|
F
|
SE
|
Period
|
r
|
ST
|
ST1
|
t
|
RE
|
CE
|
|
|
1951?C2019
|
33
|
32
|
33.05
|
0.48
|
1951?C2019
|
0.54
|
53+/16*
|
56+/11*
|
2.62
|
0.29
|
|
|
|
1951?C1985
|
29.7
|
27.6
|
13.95
|
0.48
|
1986?C2019
|
0.68
|
23+/11?C
|
27+/6?C*
|
2.10
|
0.29
|
0.18
|
|
|
1986?C2019
|
46.5
|
44.8
|
27.76
|
0.44
|
1951?C1985
|
0.55
|
23+/12?C
|
28+/6**
|
2.50
|
0.08
|
?C0.06
|
|
Notes: R2, explained variance; Radj2, adjusted
explained variance; F, the F statistic for the statistical significance of the
linear models; SE, standard error; r, the correlation between observed
values and reconstructed ones during the verification period; ST, sign
test; ST1, sign test of first difference; t, the T statistic for
the product mean test; RE, reduction of error; CE, coefficient of
efficiency; * 95% confidence level; ** 99% confidence level.
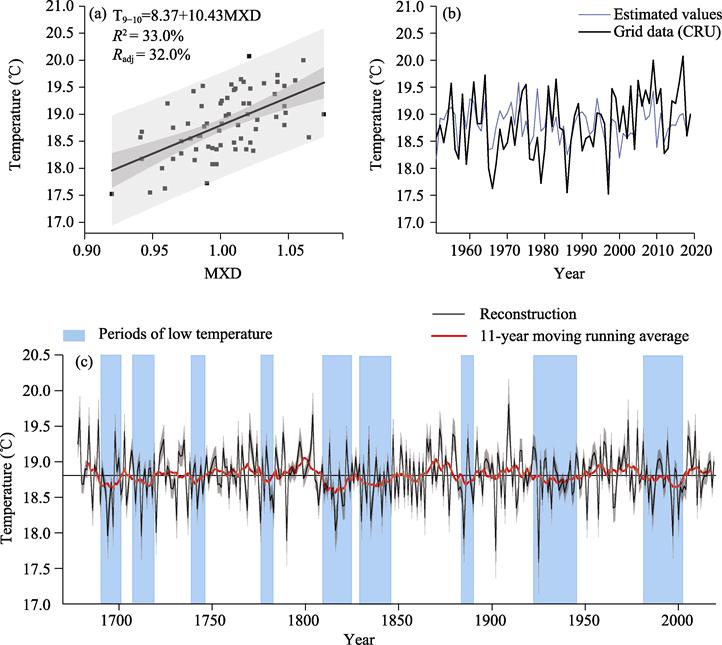
Figure 3 Scatter plot (a) and graph (b) of the
gridded and estimated September?COctober mean temperature (T9?C10) for
the calibration period of 1951?C2019. (c) Reconstructed September?COctober mean
temperature (thin line) and 11-year smoothing (thick line) from Gongshan,
northwestern Yunnan province, based on the MXD during 1678?C2019. The gray area
denotes the 95% confidence interval. The vertical shading indicated the periods
of low temperature in the reconstructed T9?C10 series when the
11-year smoothed values were lower than the long-term mean
has
occurred in 1909, while the coldest year was in 1925, with differences of 2.2 ??C
between the early-autumn temperature of these two years.
4.3 Comparisons with Other Temperature Reconstructions in
the Eastern TP
To further
assess the reliability of our reconstructed series, we also compared it with
other MXD-based temperature reconstructions in the eastern TP. The target
season and the distance to our sampling site for other reconstructions may
cause discriminations during some periods. Additionally, the shorter the
distance to our sampling site and the closer to September?COctober, the higher
the correlation between other reconstructions and our results.
For example, the MXD-based temperature
series from the Yulong Mountain and the Gaoligong Mountains had correlation
coefficients of 0.526 (p<0.001, 1707?C2010) and 0.509 (p<0.001,
1707?C2008) with our results, respectively[3,5]. The
temperature series for the sampling site near Leiwuqi correlated to our
reconstruction with a coefficient of 0.458 (p<0.001, 1765?C2009),
while the August?CSeptember mean temperature series from Sygera Mountain and the
April?CSeptember mean temperature from the Central Hengduan mountains had lower
correlations of 0.282 (p<0.001, 1820?C2008) and 0.237 (p<0.001,
1707?C2006) with our reconstructed series, respectively. Furthermore, according
to the low-frequency variation of these results, similar temperature variations
occurred in many periods for L. speciosa, A. delavayi, and P.
asperata. It was relatively warm in 1795?C1805, 1865?C1880 and 1940?C1960, while it was relatively cold in 1810?C1820,
1850?C1860, 1935?C1942 and 1990?C2004. Thus, the correlation and the common
low-frequency variations testify the reliability of our dataset.
MXD-based reconstructions from different
species have differences in their low-frequency variations. Series from L.
speciosa, A. delavayi and P. asperata showed different trends
during 1750?C1770, 1820?C1850 and 1900?C1920, despite their sampling sites being
close to our study. The temperature increased in 1750?C1770 and 1900?C1920
according to the MXD-based reconstruction from L. speciosa and P.
brachytyla, but not from P. asperata. The proxy records from A.
georgei showed contrary variations to our series in 1860?C1880 and
1930?C1970. In addition, P. likiangensis also presented different trends
to our reconstruction in 1900?C1950. Moreover, the series from P. asperata,
P. brachytyla, P. likiangensis and A. georgei have steeper
warming rates than those from L. speciosa and A. delavayi in the
latest 30 years (Figure 4).
5 Discussion and Conclusion
A
September?COctober mean temperature dataset in northwestern Yunnan province was
developed based on the MXD of A. delavayi. The dataset is longer than
previous MXD-based series reconstructions. Our reconstruction provides a useful
reference for studying historical climate change based on tree-ring width, ice
cores, historical documents, and other proxy data. The dataset shows nine cold
intervals and eight warm periods. It also indicates that the coldest autumn of
the past 342 years occurred in 1809?C1826, and the warmest period appeared in
1788?C1808.
The reconstructed dataset
displays high accordance with MXD-based reconstructed late-summer temperature
data in northwestern Yunnan province and eastern Tibetan autonomous region,
with correlation coefficients of 0.458?C0.526. Moreover, the differences between
this dataset and previously developed series from the central Hengduan
Mountains and Sygera Mountain may stem from their different target seasons and
density index. In addition, this newly reconstructed series based on the MXD of
A. georgei expands the source of tree species for reconstruction work, and
provides a reference for future studies seeking to compare the
differences among reconstructions based on different tree species.
Author
Contributions
Li, M. Q. designed the algorithms of the dataset. Deng, G.
F. contributed to the data processing and analysis. Deng, G. F. wrote the
paper.
Acknowledgements
We would like to thank
Professor Zhang, Qibin, Fan, Zexin, and Dr. Li, Mingyong for providing their
data for comparison.
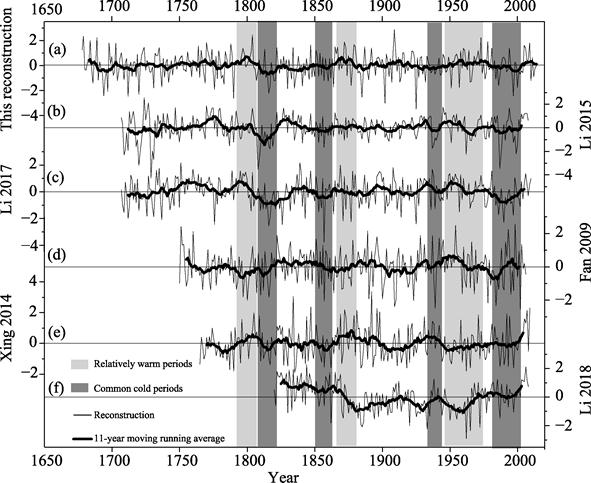
Figure 4 Comparisons of the September?COctober mean
temperature dataset in this study (a) with other MXD-based temperature
reconstructions (b?Cf) in the eastern TP: (b) August?CSeptember mean temperature
reconstructed using MXD series from L. speciosa in the Gaoligong
Mountains[5]; (c) July?COctober maximum
temperature reconstructed series from Yulong Mountain, northwest Yunnan province,
based on both MXD and tree-ring width of P. asperata [3]; (d) April?CSeptember mean
temperature reconstruction from MXD series of P. brachytyla in the central
Hengduan Mountains[4]; (e) August?CSeptember mean
temperature reconstruction based on the MXD of P. likiangensis near to
Leiwuqi in eastern Tibet[11]; (f) August?CSeptember mean temperature
reconstructed series based on the mean latewood density of A. georgei at
Sygera Mountain, southeastern Tibet. The light grey shading indicated the
relatively warm periods, while the dark grey shading indicated the common cold
periods
Conflicts of Interest
The
authors declare no conflicts of interest.
References
[1]
Ou, G. L.,
Xu, C. D., He, Z. R., et al. Quantitative classification of plant
communities on the northern part of Gaoligong Mountains by TWINSPAN [J]. Acta
Botanica Yunnanica, 2008, 30(6): 679?C687.
[2]
Xu, C. D.,
Feng, J. M., Wang, X. P., et al. Vertical distribution patterns of plant
species diversity in northern Mt. Gaoligong, Yunnan province [J]. Chinese
Journal of Ecology, 2008, 27(3): 323?C327.
[3]
Li M. Q.,
Huang L., Yin Z. Y., et al.
Temperature reconstruction and volcanic eruption signal from tree-ring width
and maximum latewood density over the past 304 years in the southeastern
Tibetan Plateau [J]. International
Journal of Biometeorology, 2017, 61(11): 2021?C2032.
[4]
Fan, Z. X.,
Braunin,g A., Yang, B., et al. Tree
ring density-based summer temperature reconstruction for the central Hengduan
Mountains in southern China [J]. Global
and Planetary Change, 2009, 65(1/2): 1?C11.
[5]
Li, M. Y.,
Wang, L., Fan, Z. X., et al.
Tree-ring density inferred late summer temperature variability over the past
three centuries in the Gaoligong Mountains, southeastern Tibetan Plateau [J]. Palaeogeography Palaeoclimatology
Palaeoecology, 2015, 422: 57?C64.
[6]
Yin, H., Li,
M. Y., Huang, L. Summer mean temperature reconstruction based on tree-ring
density over the past 440 years on the eastern Tibetan Plateau [J]. Quaternary International, 2021, 571:
81?C88.
[7]
Duan, J.
P., Ma, Z. G., Li, L., et al. August-September temperature variability on the Tibetan
Plateau: past, present and future [J]. Journal
of Geophysical Research: Atmospheres,
2019, 124(12): 6057?C6068.
[8]
Martinez-Sancho
E., Slamova L., Morganti S., et al.
The gen tree dendroecological collection, tree-ring and wood density data from
seven tree species across Europe [J]. Scientific
Data, 2020, 7(1): 1?C17.
[9]
Wang, L., Duan,
J. P., Chen, J., et al. Temperature
reconstruction from tree-ring maximum density of Balfour spruce in eastern
Tibet, China [J]. International Journal
of Climatology, 2010, 30(7): 972?C979.
[10]
Duan, J.
P., Zhang, Q. B. A 449 year warm season temperature reconstruction in the
southeastern Tibetan Plateau and its relation to solar activity [J]. Journal of Geophysical Research: Atmospheres, 2014, 119(20):
11578?C11592.
[11]
Xing, P.,
Zhang, Q. B., Lv, L. X. Absence of late-summer warming trend over the past two
and half centuries on the eastern Tibetan Plateau [J]. Global and Planetary Change, 2014, 123: 27?C35.
[12]
Yin, H.,
Liu, H. B., Linderholm, H. W., et al.
Tree ring density-based warm-season temperature reconstruction since A.D. 1610
in the eastern Tibetan Plateau [J]. Palaeogeography
Palaeoclimatology Palaeoecology, 2015, 426: 112?C120.
[13]
Liang, H.
X., Lyu, L. X., Wahab, M. A 382-year reconstruction of August mean minimum
temperature from tree-ring maximum latewood density on the southeastern Tibetan
Plateau, China [J]. Dendrochronologia,
2016, 37: 1?C8.
[14]
Li, M. Y.,
Duan, J. P., Wang, L., et al. Late
summer temperature reconstruction based on tree-ring density for Sygera
Mountain, southeastern Tibetan Plateau [J]. Global
and Planetary Change, 2018, 163: 10?C17.
[15]
Deng, G. F.,
Li, M. Q. Reconstruction dataset of yearly September-October mean temperature from tree-ring maximum
latewood density of Abies delavayi Franch. at northwest Yunnan province
of China (1678-2019) [J/DB/OL]. Digital
Journal of Global Change Data
Repository, 2022. https://doi.org/10.3974/geodb.2022.04.03.V1.
https://cstr.escience.org.cn/CSTR:20146.11.2022.04.03.V1.
[16]
GCdataPR
Editorial Office. GCdataPR data sharing policy [OL].
https://doi.org/10.3974/dp.policy.2014.05 (Updated 2017).
[17]
Cook, E.
R., Briffa, K. R., Jones, P. D. Spatial regression methods in
dendroclimatology: a review and comparison of two techniques [J]. International Journal of Climatology,
1994, 14(4): 379?C402.
[18]
Cook, E.
R., Kairiukstis, L. A. Methods of Dendrochronology [M]. Dordrecht, Netherlands:
Springer Netherlands, 1990.