Farmland Distribution Dataset of the Yarlung
Zangbo?CLhasa?CNyangqu River Region of the Tibetan Plateau
Sang, Y. M.1,2 Lu, Y. H.1,2 Wang, X.1* Xin, L. J.1*
1. Key Laboratory of Land Surface Pattern and Simulation,
Institute of Geographic Sciences and Resources Research, Chinese Academy of
Sciences, Beijing 100101, China;
2. University of Chinese Academy of Sciences, Beijing
100049, China
Abstract: A dataset of high
spatial resolution farmland distribution can accurately reflect the spatial
distribution of farmland, which is very important for understanding the
decision-making of farmland resource utilization and guaranteeing national food
security and sustainable development of the economy and society. Based on the
2-m Google Earth remote sensing image in 2020, this study interprets and
constructs the farmland distribution dataset YLN-F2020 in the Yarlung
Zangbo?CLhasa?CNyangqu River (YLN) region of the Tibetan Plateau, using a
geostatistical analysis method to reveal the spatial distribution pattern of
farmland in the research area. The results showed that: (1) the total area of
farmland of the YLN-F2020 product was 2,356.15 km2, and the overall
accuracy was 95.2%. Compared with GLC2020 and LandUse2018, the accuracy of
published farmland data of the Tibetan Plateau was found to be uncertain in
terms of spatial distribution, which makes it difficult to meet research needs.
(2) The farmland in this area was mainly distributed along rivers, with more
farmland in the east than in the west, and more in the south than in the north.
Farmland in the YLN region had obvious aggregation characteristics, and the
spatial distribution was relatively concentrated in the southwest and east.
There was a significant positive spatial correlation and spatial aggregation of
farmland in the study area. This dataset can effectively solve the problem of
insufficient resolution or missing farmland data of the YLN region of the
Tibetan Plateau and provide a reference for rational farmland utilization and
formulation of farmland protection policy.
Keywords: Tibetan Plateau;
Yarlung Zangbo?CLhasa?CNyangqu River (YLN) region;; farmland spatial distribution
DOI: https://doi.org/10.3974/geodp.2022.04.13
CSTR: https://cstr.escience.org.cn/CSTR:20146.14.2022.04.13
Dataset Availability Statement:
The dataset supporting this paper was published and is accessible through
the Digital Journal of Global Change Data Repository at:
https://doi.org/10.3974/geodb.2022.10.04.V1
or https://cstr.escience.org.cn/CSTR:20146.11.2022.10.04.V1.
1
Introduction
Farmland
is the basic resource which human society depends on for survival and
development and is the basis for food production. Changes in the quantity and
quality of farmland affect the stable supply of food, which in turn affects
food security[1]. Food security is an important foundation for
national security, and China has always prioritized safeguarding the bottom
line of national food security and guaranteeing food production and supply of
important agricultural products. Among them, the extraction of high-resolution
spatial distribution information of farmland is prerequisite for accurately
judging changes in the quantity of farmland, which can provide a data basis for
the sustainable use of farmland and food security policy formulation. At
present, many global land dataset products are available on the market[2?C4].
But existing studies mostly use Spot 4 with 10-m, Landsat TM with 30-m, and
MODIS remote sensing images with 250-m spatial resolutions as data sources for
extracting farmland information[5], mapping the area range of
farmland[6], developing land cover products[7], exploring
the dynamic changes of farmland[8,9] and its spatial distribution
pattern[10,11], and other studies; however, their data resolution
and accuracy are generally low. The accuracy of farmland data of mountainous
areas, especially plateau areas, which are influenced by the natural
geographical environment, still needs improvement despite data processing such
as multivariate data fusion and resampling before extracting information on
farmland[12,13]. Some scholars have published higher-resolution data
on the spatial distribution of agricultural facilities on the Tibetan Plateau[14],
nonetheless, global or national high- and medium-resolution data in the plateau
region are generally less accurate. Therefore, this study takes the heart of
the Tibet autonomous region and an important food-producing region, the YLN
region, as the research object, and obtains a high-spatial resolution farmland
distribution dataset and analyses its spatial distribution characteristics by
visually interpreting high-spatial resolution remote sensing images. This
provides a comprehensive understanding of the distribution of farmland in the
YLN region and provides a reference for scientific decisions on the use of
farmland in the Tibetan Plateau.
2 Metadata
of the Dataset
The
metadata of the Farmland distribution dataset in the Yaluzangbu River, Nianchu
River and Lhasa River region of the Tibetan Plateau (2020)[15] are
shown in Table 1.
3 Data
Source and Methods
3.1
Study Area
The
Yarlung Zangbo?CLhasa?CNyangqu River (YLN) region of the Tibetan Plateau (87??00??E?C
92??35??E, 28??20??N?C31??20??N) refers to the middle reaches of the Yarlung
Zangbo?CLhasa?C Nyangqu River basin, which include 18 counties (districts):
Chengguanqu, Doilungdeqen,
Table 1 Metadata summary of the Farmland
distribution dataset in the Yaluzangbu River, Nianchu River and Lhasa River region
of the Tibetan Plateau
|
Items
|
Description
|
|
Dataset
full name
|
Farmland
distribution dataset in the Yaluzangbu River, Nianchu River and Lhasa River region
of the Tibetan Plateau
|
|
Dataset
short name
|
YLN-F2020
|
|
Authors
|
Sang,
Y. M. HHZ-1737-2022, Institute of Geographic Sciences and
Resources Research, Chinese Academy of Sciences, sangyiming0725@igsnrr.ac.cn
Lu,
Y. H. HHZ-2779-2022,
Institute of Geographic Sciences and Resources Research, Chinese Academy of
Sciences, luyh.20b@igsnrr.ac.cn
Wang,
X. 0000-0002-8158-9288,
Institute of Geographic Sciences and Resources Research, Chinese Academy of
Sciences, wangxue@igsnrr.ac.cn
Xin,
L. J. CJC-8123-2022, Institute of Geographic Sciences and
Resources Research, Chinese Academy of Sciences, xinlj@igsnrr.ac.cn
|
|
Geographical
region
|
The
Yarlung Zangbo?CLhasa?CNyangqu River region of the Tibetan Plateau
|
|
Year
|
2020
|
|
Spatial
resolution
|
2 m
|
|
Data
format
|
.shp,
.tif
|
|
|
|
Data
size
|
568
MB (15.5 MB after compression)
|
|
|
|
Data
files
|
The
dataset consists of 30 data files in 4 data folders, which includes: (1)
Scope geographic information system data in the YLN region; (2) spatial
distribution vector data of farmland in the YLN region in 2020; (3) spatial
distribution raster data of farmland in the YLN region in 2020; and (4)
verification point data of farmland
|
|
Foundation(s)
|
Ministry
of Science and Technology of P. R. China (2019QZKK0603)
|
|
Data
publisher
|
Global Change Research Data Publishing &
Repository, http://www.geodoi.ac.cn
|
|
Address
|
No.
11A, Datun Road, Chaoyang District, Beijing 100101, China
|
|
Data
sharing policy
|
Data from the Global Change Research Data
Publishing & Repository includes metadata, datasets (in the Digital Journal of Global
Change Data Repository), and publications (in the Journal of Global
Change Data & Discovery).
Data sharing
policy includes: (1) Data are openly available and can
be free downloaded via the Internet; (2) End users are encouraged to use Data
subject to citation; (3) Users, who are by definition also value-added
service providers, are welcome to redistribute Data subject to written
permission from the GCdataPR Editorial Office and the issuance of a Data
redistribution license; and (4) If Data are used to compile new
datasets, the ??ten per cent principal?? should be followed such that Data
records utilized should not surpass 10% of the new dataset contents, while
sources should be clearly noted in suitable places in the new dataset[16]
|
|
Communication and searchable system
|
DOI, CSTR, Crossref, DCI, CSCD, CNKI, SciEngine, WDS/ISC, GEOSS
|
Dagze, Lhunzhub, Nyemo, Quxu, and Maizhokunggar in Lhasa;
Nedong, Chanang, Konggar, Sangri, and Qonggyai in Lhoka; and Samzhubze, Namling,
Gyangze, Lhaze, Xaitongmoin, and Bainang in Xigazi (Figure 1). This region is
located in the south-central part of the Tibetan Plateau and is the main part
of the southern Tibetan valley. The landscape generally contains three types of
mountains, hills, and plains, with altitudes ranging from 3,200?C7,200 m. The
overall terrain is high in the west, low in the east, high in the north and
south, and low in the middle. The total land area is 6.67??104 km2,
of which farmland accounts for >60% of the total farmland area in the Tibet
autonomous region[17]. The area is rich in water resources and has
many rivers, making it suitable for the growth of many types of crops and has a
well-developed animal husbandry, making it this hinterland of the Tibet
autonomous region an important grain-producing region which enjoys the
reputation of being the granary of Tibet. The economic development conditions
of Lhasa, Xigazi, and Lhoka are better than those of the rest of Tibet, and the
dense population and convenient transportation in the region make the YLN
region a political, economic, transportation, and cultural center of Tibet[18].
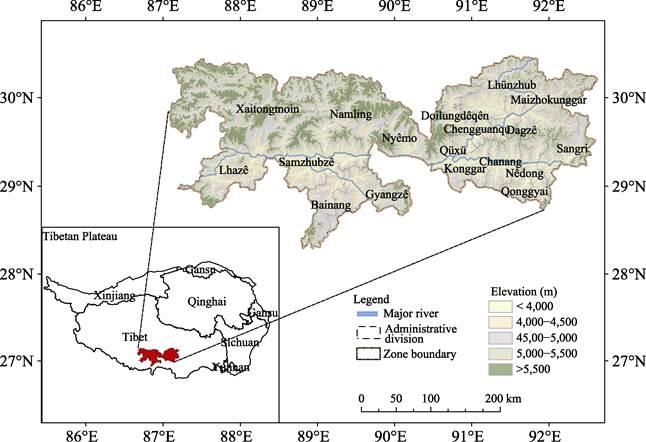
Figure 1 Location map of the research area
3.2
Data Source
In this study, the 2-m resolution remote sensing images of
Google Earth in 2020 were selected as the main data source. Google Earth
contains rich high-resolution satellite image data, and its satellite images
have a resolution of up to submeter levels, which are widely used. The
YLN-F2020 high spatial resolution data used Mercator projection with an image
level of 16 and a spatial resolution of 2 m ?? 2 m. There were fewer clouds in
the image, the image was clear, and its quality was better (Figure 2).
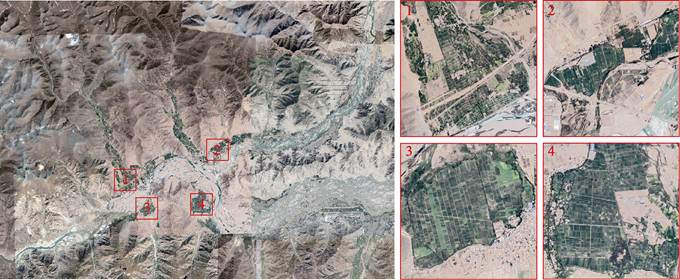
Figure 2 High resolution remote sensing images of
YLN region
3.3 Extraction
of Farmland Spatial Distribution Information
The YLN-F2020 data were obtained from
high-spatial-resolution images, and the external contours of the features shown
in the images were very clear. To ensure the accuracy of obtaining the farmland
distribution dataset, this study used the administrative divisions of the YLN
region as the boundary and identified and interpreted the farmland directly on
the images through the method of visual interpretation, combining
interpretation flags and a priori knowledge, and based on the physical
characteristics of the farmland. ArcGIS 10.7 software was used to edit and
outline the farmland, thus obtaining the farmland vector data shapefile and
extracting the spatial distribution information of the farmland.
3.4 Spatial
Accuracy Verification of Farmland
3.4.1 YLN-F2020
Data Product Accuracy Evaluation
To verify the accuracy of the dataset, this study used a
field validation method to evaluate the accuracy of the YLN-F2020 product. In
the outing expedition of the YLN region in the Tibetan Plateau, 351 standard
sample plots were selected from different regions, altitudes, and soil
conditions. The details of the sample plots, such as latitude and longitude
locations, were recorded and vectorized in ArcGIS 10.7 software to obtain the
sample point data used for validation, as shown in Figure 3.
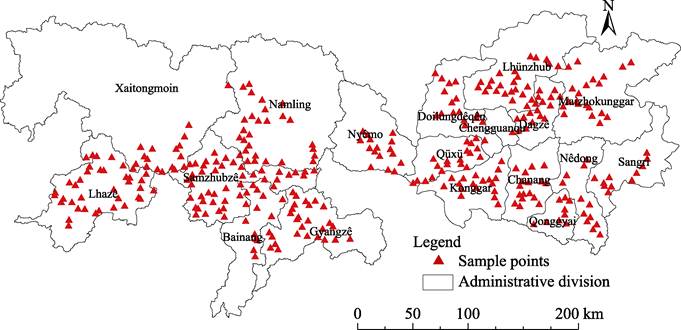
Figure 3 Sample points distribution map
3.4.2
Comparison of YLN-F2020 Data Product with Other Products
To better verify the accuracy and necessity of the
extracted farmland distribution dataset, the extracted farmland data were
compared with Global Land Cover30 and LandUse2018, which are publicly available
with high accuracy, and the accuracy of the dataset results was evaluated. The Global
Land Cover30 dataset is a global 30-m surface cover dataset led by the Ministry
of Natural Resources, and has an overall classification accuracy of up to
85.72% and a Kappa coefficient of 0.82, which has given good classification
results globally; however, its accuracy on the Tibetan Plateau has not yet been
effectively validated.
The LandUse2018 dataset is a Chinese land-use dataset led
by the Institute of Geographic Sciences and Resources of the Chinese Academy of
Sciences, which mainly uses the human?Ccomputer interaction model and has been
widely used in a wide area of China but has been relatively rarely used in the
Tibetan Plateau. In this study, to remove the influence of the time factor, Global
Land Cover30 V2020 and LandUse2018 were chosen for comparison with our
YLN-F2020 dataset, as all datasets included similar time (between 2018?C2020).
In terms of data processing, our data were at 2-m
resolution and the spatial resolutions of Global Land Cover30 V2020 and
LandUse2018 were 30- and 100-m, respectively. Therefore, in this study, the
YLN-F2020 dataset was sampled up to 30- and 100-m, respectively, and to ensure
that the sampling method matched the other two datasets, those with >50% of
farmland area were considered farmland[19]. For data comparison, we
used image-by-image comparison to count the misclassification and omission of
farmland in YLN-F2020 as the standard and conducted zonal statistics.
4 Data Results and Validation
4.1
Data Products
The high spatial resolution farmland distribution dataset
for the YLN region of the Tibetan Plateau contained four parts: research area
extent data, farmland spatial distribution vector data, farmland spatial
distribution raster data, and farmland validation points.
4.2
Data Validation
4.2.1
Accuracy Validation
The YLN-F2020 product and the field farmland sample points
were verified to have the same spatial distribution characteristics. There were
351 actual available farmland sample points, of which 334 were correctly
classified as farmland and 17 were omitted, with errors mainly concentrated in
Namling, Chanang, and Konggar. The overall accuracy of the extracted farmland
data was 95.2%, indicating that the data had high accuracy and reflected the
spatial distribution of farmland in the research area.
4.2.2
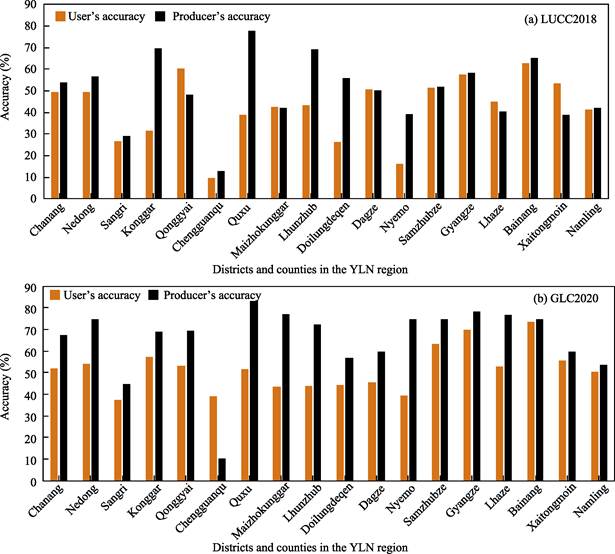
Product Comparison Results
Comparing the results, GLC2020 and LandUse2018 had lower
correct farmland rates, where the user??s accuracy did not exceed 55%, with the
highest being 53.97% for GLC2020, followed by 43.25% for LandUse2018. In terms
of producer??s accuracy, both products performed slightly better than user??s
accuracy, with the highest being 70.15% for GLC2020, followed by LandUse2018 at
53.77%. This indicates that there is still a large degree of uncertainty in the
spatial distribution of publicly available farmland data on the Tibetan
Plateau. Therefore, current farmland products can hardly meet the requirements
of both macro-level studies on the spatial distribution of farmland and
micro-level studies, such as the intensity of farmland use and its
environmental effects.
From
the district and county comparison perspective, the user??s and producer??s
accuracies for both datasets did not exceed 80% in each district and county,
except for the producer??s accuracy of GLC2020 in Quxu county. The user??s
accuracy of the two products was higher in Bainang county (Figure 4), with
accuracies of GLC2020 and LandUse2018 being 73.49% and 62.56%, respectively,
whereas the user??s accuracy in the remaining districts and counties did not
exceed 60%. The producer??s accuracy was highest in Quxu county, with accuracies
of the two products being 83.44% and 77.86%, respectively, whereas the
producer??s accuracy in other districts and counties did not exceed 80%. The
producer??s accuracy of LandUse2018 was slightly lower, not exceeding 70%.
Therefore, from the perspective of accuracy, the accuracy of GLC2020 was better
than that of LandUse2018 in all districts and counties, but the two datasets
were affected by the accuracy in farmland studies in districts and counties,
and still have difficulties in meeting the relevant follow-up studies. From the
perspective of the spatial distribution of errors (Figure 5), the misclassification was found to be mainly distributed in
riverine and mountainous alluvial fan areas.
In terms of error
analysis, the classification errors of GLC2020 and LandUse2018 were mainly
concentrated in the land class aspect, mainly grassland, farmland, and rivers,
and there were more cases of misclassification and omission. This may originate
mainly from the following aspects: (1) insufficient training samples. According
to the existing articles on GLC2020[20,21], the training sample
points in the farmland classification algorithm were found to be mainly
concentrated in plain areas with relatively flat terrain. There were fewer
samples in the Tibetan Plateau, which makes it difficult to support the
classification of farmland in the YLN region. (2) The image quality was poor.
GLC2020 and LandUse2018 images are mainly based on Landsat and resource
satellites with a spatial resolution of only 30-m and are easily affected by clouds
and fog. The YLN region is mainly located in the
Figure
4 Comparison of GLC2020
and LandUse2018 product results based on districts and counties in the YLN
region
river valley terraces where there are more clouds and fog,
so it brings great challenges to the human?Ccomputer interaction of LandUse2018
and GLC2020, which mainly rely on classification algorithms. (3) Mixed image
elements. A high degree of fragmentation was observed in the 30-m
(approximately 0.9 ha) resolution images of farmland distribution in the YLN
region. The mixed image elements are serious, and are a major source of error.
(4) Limitations of classification algorithms. Currently, more classification
algorithms are based on threshold methods, neural networks, and random forests.
This algorithm has obvious advantages for the rapid classification and
extraction of large areas. However, in many Chinese and global regional
products, the Tibetan Plateau in the YLN region is often not the main focus of
the product. Therefore, the limitations of these algorithms are progressively
magnified in this region, making it difficult to effectively solve the ??same
spectrum with different objects?? and ??same objects with different spectrum??
problems in this region, thus increasing the error rate of the product.
4.3
Data Results
4.3.1
Regional Distribution Characteristics of Farmland in YLN Region
The total area of farmland in the YLN region was 2,356.15
km2. As shown in the map of farmland distribution (Figure 6a),
farmland was distributed along the main stream of the Yarlung Zangbo River,
tributaries of the Lhasa and Nyangqu Rivers, and evenly distributed on both
sides of the river, with good irrigation conditions. The farmland distribution
characteristics were detected more in the east than in the west, and more in
the south than in the north. The districts and counties with the most farmland
in the entire region were the southwestern Samzhubze District and Lhaze county;
central Gyangze, Bainang, Namling Counties; and northeastern Lhunzhub county, accounting
for 58.49% of the farmland area in the entire YLN region. The largest area of
farmland was in Samzhubze District, with 347.76 km2 of farmland,
accounting for 14.65%. This was followed by Gyangze and Lhunzhub, with farmland
area of 253.47 and 248.53 km2, accounting for 10.68% and 10.47% of
all farmland, respectively. Chengguanqu had the smallest area of farmland with
11.63 km2 accounting for only 0.49% of the total farmland in the
region (Figure 6b).
4.3.2
Spatial Distribution of Farmland Density in the YLN Region
Based on the analysis of the characteristics of the
regional farmland distribution, to further reflect the spatial density
distribution of farmland in the YLN region, first, the farmland plots were
converted to points in ArcGIS 10.7, and subsequently, the kernel density was
estimated and farmland was divided into five classes using the natural
breakpoint method (Figure 7). As shown in Figure 7, the spatial distribution of
farmland in the YLN region showed evident differences due to topographical
factors and irrigation conditions. Although the overall spatial distribution of
farmland covered a wide area, regional aggregation characteristics were still
visible, mainly in the southwestern and eastern density aggregation areas. The
areas with higher farmland density were mainly concentrated in the flat terrain
of

Figure
5 Spatial distribution
maps of farmland in the YLN region produced by GLC2020 and LandUse2018 products

Figure 6 Farmland distribution in YLN region

Figure 7 Kernel density estimation map of farmland
river valleys, including the southern part of Lhaze;
northern parts of Bainang and Dagze; central parts of Gyangze, Chanang, and
Nedong; and western part of Maizhokunggar. The areas with medium density were
mainly distributed in the southern part of the research area, and the areas
with low density were mainly located in the northern part of the research area.
4.3.3
Spatial Correlation Analysis of Farmland in the YLN Region
In this study, global and local autocorrelation were used
to analyze the spatial correlation of farmland distribution in the research
area. Township level was used as the next research scale to better reflect the
spatial distribution of farmland, and the farmland occupation ratio was chosen
as the attribute information to calculate global Moran??s I and test its
significance. The results showed that the global autocorrelation coefficient
Moran??s I of the research area was 0.57, which is greater than 0, indicating
that farmland in the YLN region shows significant spatial autocorrelation. The
z-score was 14.80, which is greater than the critical value of 1.96, passing
the test of significance level ??=0.05, indicating that there is a clear spatial
aggregation of farmland in the YLN region.
|

Figure 8 Moran??s I
scatter plot
|
Based on global autocorrelation analysis, the local
autocorrelation of the spatial distribution of farmland in the YLN region was
analyzed. From the Moran??s index scatter plot (Figure 8), the vast majority of
areas in the YLN region seemed to be located in the first and third quadrants,
indicating that the spatial distribution of farmland tends to be spatially
positively correlated with high and low values of aggregation.
Furthermore, LISA agglomeration maps were used to
characterize the homogeneous and heterogeneous distribution of farmland
between townships and their neighbors in the YLN region. As shown in Figure 9,
the LISA agglomeration map showed the following spatial association
characteristics.
The
??high-high?? area. The townships belonging to this type were mainly located in
the western part of Gyangze, northern part of Bainang, and southeastern part of
Samzhubze, showing a larger area in the overall south?Ccentral agglomeration of
the YLN region, with a scattered distribution in the northeast. Townships in
the south?Ccentral area had a high proportion of farmland for themselves and
their surrounding townships, and the topography was relatively flat with
farmland distributed along the lower reaches of the river. By superimposing the
slope data, the south?Ccentral and northeastern ??high-high?? agglomerations were
found to be located near the lower reaches of the Nyangqu and Lhasa Rivers,
respectively, where water resources are abundant and irrigation is convenient.
The uneven slopes on both sides of the lower reaches of the Yarlung Zangbo
River resulted in less farmland on the northern side and more on the southern
side, hence, there was no ??high-high?? aggregation. Combined with population and
economic development, the ??high- high?? area in the northeast is closer to the
central city of Lhasa, which is densely populated and has better conditions for
the development of the surrounding cities, so the scope of farmland gathering
in the south?Ccentral part is much larger than that in the central part.
The ??high-low?? area. Townships belonging to this type were
distributed east of Quxu. The farmland in this area was distributed along the
Lhasa River, but the number of spatial units in this type of township was
small, mainly represented by the high proportion of farmland in the townships
but a low proportion in the surrounding townships. Although farmland was
densely distributed under the influence of the river, the eastern part of Quxu
was adjacent to the ??low-low?? aggregation area, and the distribution of
farmland along the river gradually decreased and then increased, resulting in
the phenomenon of ??high-low?? aggregation.
The
??low-high?? area. Townships of this type were located in Gyangze, Nedong, and
Lhunzhub. The spatial relationships in this area showed clear heterogeneity,
with the area showing a low proportion of farmland in the townships but a high
proportion in the surrounding townships. By comparing the water distribution
map, the townships in the ??low-high?? area were found to be affected by the
water source, with the area near the river being densely distributed with
farmland. The upstream water source was sufficient and the farmland was
distributed in concentrated contiguous areas with large farmland areas, whereas
the downstream river channel became narrower and the water source decreased
sharply, resulting in a reduction in farmland area.
The ??low-low?? area. The townships were mainly distributed
in the eastern part of Xaitongmoin, northern parts of Namling and Nyemo, and
vicinity of Chengguanqu. The townships were roughly distributed in the
northwest and east?Ccentral parts of the YLN region, showing a relatively good
gathering trend. The northwest area of the YLN region is mountainous with high
altitude and open terrain, but it is restricted by poor farming conditions, low
soil organic matter content, cold and dry climate, and many other factors that
are not conducive to the growth of crops. Therefore, little or no farmland was
observed in this area. The main agricultural production mode in this area is
animal husbandry, therefore, the proportion of farmland in townships and
surrounding townships is relatively small. Chengguanqu, located in the
east?Ccentral part of Lhasa, is the center of the city and has a higher level of
economic development than other areas. Even though the Lhasa River passes
through, farmland in this area and its surrounding areas is still less
distributed.
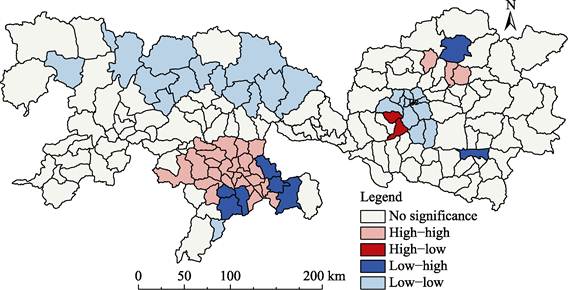
Figure 9 LISA aggregation map
5 Discussion and Conclusion
In this study, high-spatial-resolution remote sensing
images were used to extract the distribution of farmland in the YLN region of
the Tibetan Plateau and construct the YLN-F2020 dataset product, which was
compared with other products, and its accuracy was evaluated. Moreover, the
spatial distribution pattern of farmland in the research area was analyzed to
reveal its spatial distribution characteristics. The overall accuracy of
farmland extraction for the YLN-F2020 product was determined to be 95.2%, which
is relatively high. Compared with GLC2020 and LandUse2018 products, the spatial
distribution of farmland on the Tibetan Plateau was found to have large
uncertainties, which could not meet research requirements. From the perspective
of regional distribution, the farmland in the YLN region was mainly distributed
along the rivers, showing spatial distribution characteristics of more in the
east than in the west, more in the south than in the north. From the
perspective of the distribution density of farmland, farmland showed
characteristics of aggregation in the region, with southwest and east density
aggregations. From the perspective of spatial correlation, farmland in the
research area had an evident positive spatial correlation and a trend of
spatial aggregation. Based on the continuous improvement and development of
high-resolution remote sensing images, the research results can effectively
solve the problem of insufficient resolution or missing farmland data in the
YLN region of the Tibetan Plateau, and provide a data basis for the
establishment of a nationwide farmland database. In addition, studying the
spatial distribution pattern of farmland on the Tibetan Plateau can provide an
understanding of the distribution characteristics of farmland resources in the
region. In the process of social and economic development, scientific and
effective knowledge of utilization of farmland resources on the Tibetan Plateau
is beneficial.
Notably, the high-resolution remote sensing image used to
analyze the distribution of farmland in this study only covers the data of
2020, and the data of previous years were not extracted for comparative
analysis, so the dynamic change trend of farmland cannot be observed, lacking
the combination of time and space. Moreover, there were a few clouds in the
image; therefore, there may be some errors in visual interpretation, which may
lead to the indistinct identification of ground objects. Therefore, the
combination of space and time can be considered in subsequent studies of the
spatial distribution of farmland, and other interpretation methods can further
improve the efficiency of farmland extraction.
Author
Contributions
Wang, X. and Xin, L. J. designed the algorithms of
dataset. Lu, Y. H. performed data validation. Sang, Y. M. contributed to the
data processing and analysis and wrote the data paper.
Conflicts
of Interest
The
authors declare no conflicts of interest.
References
[1]
Yu, Z. G.,
Hu, X. P. Research on the relation of food security and cultivated land??s
quantity and quality in China [J]. Geography and Geo-Information Science,
2003(3): 45-49.
[2]
Bontemps, S., Defourny, P., Radoux, J., et al. Consistent global
land cover maps for climate modelling communities: current achievements of the
ESA??s land cover CCI [C]. ESA Living Planet Symposium, 2013.
[3]
Chen, J.,
Chen, J., Liao, A., et al. Global land cover mapping at 30 m resolution:
A POK-based operational approach [J]. Isprs Journal of Photogrammetry & Remote Sensing, 2015,
103: 7-27.
[4]
Yu, L.,
Wang, J., Clinton, N., et al. FROM-GC: 30 m global cropland extent
derived through multisource data integration [J]. International Journal of
Digital Earth, 2013, 6(06): 521-533.
[5]
Lv, T. T.,
Liu, C. Extraction of information of cultivated land using time-series MODIS
data in Thailand [J]. Transactions
of the CSAE, 2010, 26(2): 244-250.
[6]
Aparna, R.
P., Mutlu Özdoğan. Large area cropland extent mapping with Landsat data and a
generalized classifier [J]. Remote Sensing of Environment, 2018, 219:
180-195.
[7]
Pouliot,
D., Latifovic, R., Zabcic, N., et al. Development and assessment of a
250 m spatial resolution MODIS annual land cover time series (2000-2011) for the forest region of Canada derived
from change-based updating [J]. Remote Sensing of Environment, 2014,
140: 731-743.
[8]
Han, K. S.,
Champeaux, J. L., Roujean, J. L. A land cover classification product over
France at 1 km resolution using SPOT4/VEGETATION data [J]. Remote Sensing of
Environment, 2004, 92(1): 52-66.
[9]
Zhang, M.,
Wu, B. F., Yu, M. Z., et al. Concepts and implementation of monthly
monitoring of uncropped arable land: A case study in Argentina [J]. Journal
of Remote Sensing, 2015, 19(4): 550-559.
[10] Liu, J. Y., Liu, M. L.,
Tian, H. Q., et al. Spatial and temporal patterns of China?? s cropland
during 1990-2000: An analysis based on Landsat TM data [J]. Remote Sensing of
Environment, 2005, 98: 442-456.
[11] Zhang,
Z., Wang, X., Zhao, X., et al. A 2010 update of National Land Use/Cover
Database of China at 1:100000 scale using medium spatial resolution satellite
images [J]. Remote Sensing of Environment, 2014, 149: 142-154.
[12]
Zhang, Y.
L., Liu, L. S., Wang, Z. F., et al. Spatial and temporal characteristics
of land use and cover changes in the Tibetan Plateau [J]. Chinese Science
Bulletin, 2019, 64(27): 2865-2875.
[13]
Tibet
Autonomous Region Bureau of Statistics. Tibet Statistical Yearbook 2020 [M].
Beijing: China Statistics Press, 2021.
[14]
Wei, H.,
Lv, C. H., Yang, K. J., et al. Spatial distribution dataset for facility
agriculture in the Tibetan Plateau and two typical regions [J]. Journal of
Global Change Data &
Discovery, 2019, 3(4): 364-3696.
[15]
Sang, Y. M., Lu, Y. H., Wang,
X., et al. Farmland distribution dataset in the Yaluzangbu River, Nianchu River and Lhasa
River region of the Tibetan Plateau (2020) [J/DB/OL]. Digital
Journal of Global Change Data Repository, 2022.
https://doi.org/10.3974/geodb.2022.10.04.V1.
https://cstr.escience.org.cn/CSTR:20146.
11.2022.10.04.V1.
[16]
GCdataPR Editorial
Office. GCdataPR data sharing policy [OL]. https://10.3974/dp.policy.2014.05 (Updated 2017).
[17]
Li, D.,
Tian, P. P., Luo, H. Y., et al. Spatio-temporal characteristics and
obstacle diagnosis of cultivated land ecological security in ??One River and Two
Tributaries?? region in Tibet [J]. Transactions of the Society for
Agricultural Machinery, 2020, 51(10): 213-222.
[18]
He, W. H.
The research on the variety of crop planting area distribution in the Yarlung
Zangbo River, Nyangqu River and Lhasa River region, Tibet basin under the
background of climate changes [D]. Chongqing:
Southwest University, 2018.
[19]
Chen, F.,
Chen, J., Wu, H., et al. A landscape shape index-based sampling approach
for land cover accuracy assessment [J]. Science China Earth Sciences,
2016, 59(12): 2263-2274.
[20]
Chen, X. Y., Lin, Y., Zhang, M., et al. Assessment of the
cropland classifications in four global land cover datasets: A case study of
Shaanxi Province, China [J]. Journal of Integrative Agriculture, 2017,
16(2): 298-311.
[21]
Chen, J.,
Cao, X., Peng, S., et al. Analysis and applications of GlobeLand30: a
review [J]. ISPRS International Journal of Geo-Information, 2017, 6(8):
230.