Reconstructed Arctic Summer
Sea Ice Areal Extent over the Past Millennium
Ren, S.1 Guo, H.2*
1. Institute of
Tibetan Plateau Research, Chinese Academy of Sciences, Beijing 100101, China;
2. State Key Laboratory of Hydroscience and
Engineering, Department of Hydraulic Engineering, Tsinghua University, Beijing
100084, China
Abstract: Arctic sea ice is an important component of the
Earth system. Changes in sea ice are critical to the climate of polar regions
and, by extension, the mid-latitudes (North America, Eurasia, etc.). Remote
sensing observations over the last 30 years have revealed that Arctic sea ice
is melting rapidly, and it remains unclear whether this trend exceeds
historical sea ice fluctuations. Resolving this uncertainty requires
reconstructing a longer time series of Arctic sea ice variability. Many studies
have attempted to reconstruct sea ice extent or sea ice density using proxy
indicators. However, these studies mostly reflect changes in local ice coverage
and lack information on broader Arctic sea ice variability. Using the high
albedo of Arctic sea ice, we developed a statistical model of sea ice
albedo-atmospheric circulation in order to reconstruct the spatial and temporal
changes in Arctic summer sea ice areal extent over the past millennium. The
results show that the spatial and temporal dynamics of the summer Arctic sea
ice areal extent modelled by this method are in strong agreement with remote
sensing observations. The reconstructed sea ice record shows that the rapid
trend in ice melt over the last 30 years greatly exceeds historical
fluctuations of sea ice area. This sea ice reconstruction method establishes
the foundation for additional reconstructions of longer-term sea ice changes in
the historical period. Furthermore, this reconstruction shows that the maximum
ice coverage occurred in 1259 and encompassed an area of approximately 8.7
million km2, while the minimum occurred in 2003 and covered
approximately 5.38 million km2. The difference between the minimum
and maximum of Arctic sea ice areal extent is approximately 3.32 million km2,
which is equivalent to a 38% reduction in coverage since peak extent occurred
over 700 years ago.
Keywords: Arctic region; summer; sea ice
area; sea ice albedo-atmospheric circulation model
DOI: https://doi.org/10.3974/geodp.2022.03.06
CSTR: https://cstr.escience.org.cn/CSTR:20146.14.2022.03.06
Dataset Availability Statement:
The dataset
supporting this paper was published and is accessible through the Digital Journal of Global Change Data
Repository at: https://doi.org/10.3974/geodb.2022.05.01.V1
or https://cstr.escience.org.cn/CSTR:20146.11.2022.05.01.V1.
Arctic sea ice is an
important component of the Earth system. Because of its high albedo, changes in
the areal extent of Arctic sea ice directly affect the energy balance in the
Arctic region, which can impact the Arctic climate via positive feedbacks[1].
Furthermore, changes in the regional energy balance also affect larger
circulation systems, such as the Arctic Oscillation (AO) and the North Atlantic
Oscillation (NAO), which may greatly influence the climate in the mid-latitudes
(e.g., North America and Eurasia)[2–4]. Remote sensing observations show a significant decreasing trend in
Arctic sea ice coverage over the past 30 years. Notably, the area of sea ice in
September has been declining at a rate of 12.4% per decade and by the end of
2012 was reduced to nearly half of its maximum area[5–7]. However,
it remains unclear whether this trend exceeds the historical rate of sea ice
change. Numerous previous studies have attempted to answer this question by
reconstructing past Arctic sea ice variability. For example, Walsh et al. (2001)[8] reconstructed sea ice areal changes in the Chukchi Sea from 1953 to
2007 using instrumental measurements; de Vernal et al. (2008)[9] reconstructed
sea ice coverage in the Chukchi Sea from 1327–1952 based on sporulation data;
Bonnet et
al. (2010)[10] used marine
sediment data to reconstruct sea ice areal
extent in the Fram Strait from 579–1943. These proxy indicators may
sufficiently reflect long term temporal changes in sea ice area or sea ice
density within a region but they lack information regarding broader sea ice
changes throughout the Arctic. Considering these limitations, this study
explores a new method for reconstructing past sea ice areal extent.
Additionally, this work presents a reconstruction of Arctic sea ice coverage
from 850–2005 A.D. using a statistical model of sea ice albedo-atmospheric
circulation based on the high albedo of Arctic sea ice. The sea ice area
described in this paper refers to the size of the area corresponding to the sea
ice extent, which has the same meaning as the sea ice extent indicator of
remote sensing observation.
2 Metadata of the Dataset
The metadata of Reconstructed dataset of Arctic summer sea
ice area (850–2005)[11] is summarized in Table 1. It includes the
dataset full name, short name, authors, year of the dataset, temporal
resolution, spatial resolution, data format, data size, data files, data
publisher, and data sharing policy, etc.
3 Methods
3.1 Model Development
Arctic sea ice
variability is influenced not only by the near-surface temperature in the
Arctic Ocean region, but also by circulation driven changes to the energy
transfer from the middle and low latitudes to the high latitudes. These changes
also affect interannual ice fluctuations. In addition, Arctic sea ice area is
spatially variable, and sea ice in different regions is controlled by different
regional climate systems. To accurately simulate the spatial and temporal
variability of sea ice, sea ice albedo is chosen to characterize sea ice areal
variability, global sea level pressure is used as an indicator reflective of
global circulation changes in other regions, and the statistical relationship
between Arctic sea ice albedo and distal sea level pressures is modelled at
each grid cell using the empirical statistical model (Lasso) method. The Lasso
method is based on the assumption of sparsity among higher-dimensional
variables, and can effectively compress
Table 1 Metadata summary of the Reconstructed
dataset of Arctic summer sea ice area (850–2005)
|
Items
|
Description
|
|
|
Dataset
full name
|
Reconstructed dataset
of Arctic summer sea ice area (850–2005)
|
|
|
Dataset
short name
|
ArcticSeaIceArea850-2005
|
|
|
Authors
|
Ren, S.
0000-0002-6190-755X, Institute of Tibetan Plateau Research, Chinese Academy
of Sciences, shuairen@itpcas.ac.cn
Guo, H. 0000-0002-4333-6167,
State Key Laboratory of Hydroscience and Engineering, Department of Hydraulic
Engineering, Tsinghua University
|
|
|
Year
|
850–2005 A.D.
|
|
|
Temporal
resolution
|
Year
|
|
|
Data
format
|
.xlsx
|
|
|
Data size
|
1.01 MB
(Compressed to one single file with 684 KB)
|
|
|
Data
publisher
|
Global
Change Research Data Publishing & Repository, http://www.geodoi.ac.cn
|
|
Address
|
No. 11A, Datun
Road, Chaoyang District, Beijing 100101, China
|
|
Data sharing
policy
|
Data from the Global
Change Research Data Publishing & Repository includes metadata, datasets (in the Digital Journal of Global Change Data Repository), and
publications (in the Journal of Global Change Data & Discovery). Data sharing policy includes: (1) Data are openly
available and can be free downloaded via the Internet; (2) End users are
encouraged to use Data subject to citation; (3) Users, who are by definition
also value-added service providers, are welcome to redistribute Data
subject to written permission from the GCdataPR Editorial Office and the
issuance of a Data redistribution license; and (4) If Data are used to
compile new datasets, the ??ten per cent principal?? should be followed such
that Data records utilized should not surpass 10% of the new
dataset contents, while sources should be clearly noted in suitable places in
the new dataset[12]
|
|
Communication and
searchable system
|
DOI, CSTR, Crossref, DCI, CSCD, CNKI,
SciEngine, WDS/ISC, GEOSS
|
variable information to achieve a rapid solution for
variable selection. The Lasso regression method is widely used in the
reconstruction and prediction of climate variables. In this study, the statistical relationship between sea
ice albedo and sea level pressure (SLP) is modelled at each grid cell based on
remotely observed sea ice albedo data and sea level pressure reanalysis data.
The model is driven by global SLP data from the CMIP6 past 1000 experiment and
the CMIP5 historical experiment to reconstruct the changes in Arctic summer sea
ice albedo between 850-2005 A.D. Since the albedo of sea ice and
seawater differ significantly, the conversion threshold between ice albedo and
extent is determined by comparing the reconstructed albedo with the remotely
observed sea ice areal extent. Finally, the Arctic sea ice areal changes
between 850-2005 A.D. are extracted accordingly.
3.2 Data Processing
This
dataset is based on the newly released CLARA-A2-SAL black sky surface albedo
record acquired by the Advanced Very High Resolution Radiometer Sensor (AVHRR)
deployed aboard NOAA satellites. These satellites observed sea ice albedo for
the Climate Monitoring Satellite Application Facility (hereafter referred to as
CMSAF) project in order to establish a relationship between surface albedo and
the Large Scale Circulation Index-SLP; the goal of which is to reconstruct
summer sea ice areal extent in the Arctic over the past millennium. The algorithm consists of four main steps (Figure 1). First, in order
to develop a reliable estimate of the regression coefficients, the independent
variable factor in the regression equation is increased according to the
monthly data immediately preceding and following the month being reconstructed;
specifically, if August data are used as the independent variable factor in the
regression equation, then July and September data will also be used as the
independent variable factor when using the regression model (similar method for
June and September data). Secondly, based on Empirical Orthogonal Function
decomposition analysis (EOF), the first 30 principal components (PC) of the
albedo data for the selected months in CMSAF were extracted for the Arctic
region from 1982–2015, and the SLP data were resampled to 10????10??. Then, the
SLP data was used as the independent variable to build an empirical statistical
model, using the Lasso regression method, between the albedo PC information and
the SLP monthly normalized time series. The operations were performed
iteratively to find the optimal regression coefficients. Based on this, the
global SLP data from the Earth??s climate system model are input into the
prediction model to reconstruct the summer sea ice albedo in the Arctic from
850–2005 A.D. Finally, the conversion threshold between albedo and sea ice
extent is determined by comparing the reconstructed albedo results with the
remotely observed sea ice extent, and the temporal fluctuation of Arctic sea
ice area over the past 1,000 years is extracted accordingly.
|
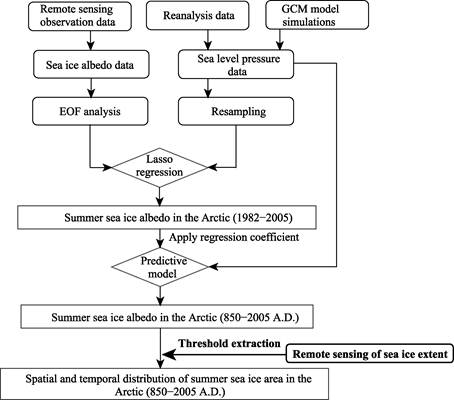
Figure 1 Technical route of the dataset
development
|
4 Data Results and Validation
The data were
compressed in a data file (ArcticSeaIceArea850-2005.rar), and the decompressed
data were placed in a data statistics table and four data folders (Table 2).
Table 2 Composition of data files for the
Reconstructed dataset of Arctic summer sea ice area (850–2005)
|
Data files and folders
|
Data file name
|
Data size (KB)
|
|
ArcticSeaIceArea850-2005.rar
|
684.85
|
|
1_Arctic_Sea_Ice_Area_850-2005.xlsx
|
54,864
|
|
2_ValidationData
|
|
|
SeaIceAlbedo1982-2005_Observed&Reconstructed
|
Observed.txt
|
1,210
|
|
Reconstructed.txt
|
1,225
|
|
SeaIceArea1982-2005_Observed&Reconstructed
|
Observed&Reconstructed.txt
|
784
|
|
SpatialSeaIce1259,2003_Reconstructed
|
1259.nc
|
32,308
|
|
2003.nc
|
32,308
|
|
SpatialSeaIceAlbedo2005_Observed&Reconstructed
|
Observed.nc
|
473,440
|
|
Reconstructed.nc
|
473,440
|
The reconstructed 850–2005 Arctic
summer sea ice areal fluctuations ranged from a maximum of 8.7 million km2
in 1259 to a minimum of 5.39 million km2 in 2003. The average sea
ice area is 7.55 million km2 (Figure 2).
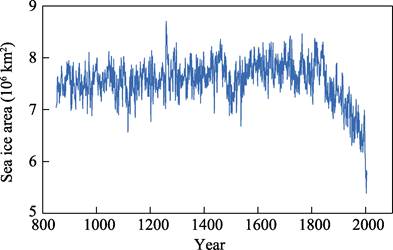
Figure 2 Summer sea ice area in the Arctic region
during 850–2005
The reconstructed
Arctic summer sea ice albedo series compared with the remote sensing observation series data is shown in Figure 3. As
seen in Figure 3, the reconstructed changes in Arctic sea ice albedo based on
the Lasso method are consistent with remote sensing observations. This
indicates that the model can sufficiently simulate the rapid decreasing trend
in sea ice albedo, driven by the past 30 years of sea ice melt, while also
capturing the interannual fluctuations in albedo changes. In terms of spatial
correlations, for example, the reconstructed sea ice albedo in the summer of
2005 reflected contemporary observations of the high albedo in the ice covered
regions and the low albedo in the nearby ice-free sea (Figure 4).
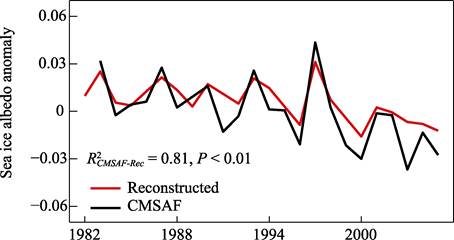
Figure 3 Comparison of the reconstructed summer
sea ice albedo in the Arctic with remote sensing observations (CMSAF)
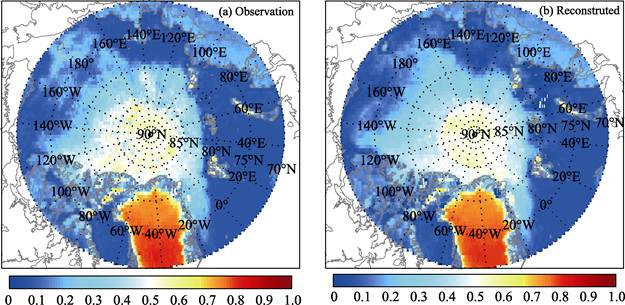
Figure 4 Spatial distribution of summer sea ice
albedo in the Arctic in 2005 from remote sensing observations (a) and
reconstructed (b)
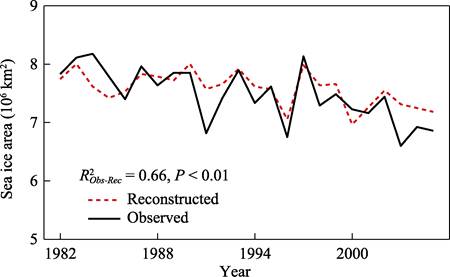
Figure 5 Comparison of the reconstructed summer
sea ice area in the Arctic with remote sensing observations
Since the albedo
characteristics of sea ice and seawater differ greatly, the albedo threshold of
sea ice-seawater variation can be determined by comparing the reconstructed
data with remotely sensed observations. With this threshold, the reconstructed
past 30 years of albedo variability can be converted into a record of variable
sea ice area, and thus, the spatial and temporal changes in sea ice area over
the past 30 years can be extracted. As shown in Figure 4,
the sea ice coverage in the Arctic region developed using the Lasso method is
consistent with the most recent thirty years of remote sensing observations. As
shown in Figure 4, Arctic sea ice areal extent reconstructed based on the Lasso
method is consistent with the remotely sensed observations over the last 30
years. The reconstruction better reflects the continuous decreasing trend of
sea ice area since 1980 and captures the minimum and maximum values of sea ice
areal extent in the summers of 1996 and 1997. The above results indicate that
this method can be used for the reconstruction of sea ice areal extent at
longer scales over the historical period.
Using the reconstruction algorithm proposed in this study, a
millennial-scale time-series of Arctic sea ice areal variability was
reconstructed for the period between 850 A.D. and 2005 A.D. This was
accomplished by combining simulated SLP data extracted from the CMIP6 past1000
experiment with historical simulations provided by the CMIP5 multimodel
comparison program. The results show changes in sea ice areal variability over
the past millennium (850–2005 A.D.), and that the long-term decreasing trend of
sea ice coverage is correlated with changing Arctic temperatures (Figure 6).
During the Medieval Warm Period (800–1300 A.D.), Arctic sea ice area slowly
expanded as temperatures in the Arctic gradually decreased. This is consistent
with the proxy-based reconstruction of past sea ice coverage developed by
Kinnard et al. (2011)[13].
The rapid increase in Arctic temperatures since the 19th century is one of the
principal drivers of modern sea ice retreat. These results also show that the
area covered by Arctic sea ice has rapidly declined over the past two
centuries. This is especially true over the last 30 years, during which time
the rate of sea ice area reduction exceeded the rate of change observed over
the past millennium. This is also consistent with the conclusions of the
proxy-based reconstructions[13]. These changes can also be observed
spatially. Figure 7 shows a retreat of Arctic summer ice poleward of 75?? N in
2003 that is not observed in 1259.
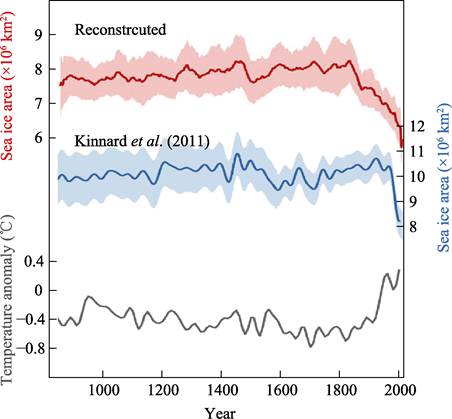
Figure 6 Reconstructed
millennial-scale sea ice area series (red), sea ice series reconstructed by
proxy indicators (blue), and Arctic near-surface temperature series (grey)[14]
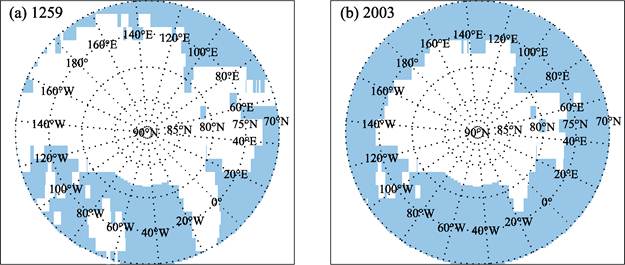
Figure 7 Reconstructed Arctic summer sea ice
distribution for 1259 and 2003 (the reconstructed sea ice in white)
5 Discussion and Conclusion
The
sea ice-atmosphere statistical model constructed using the Lasso method can
sufficiently simulate melt-driven changes to the Arctic albedo. The
reconstructed sea ice coverage variability based on this method is in good
agreement with the most recent 30 years of remote sensing observations. While
the model can simulate both the recent observed trend of rapid sea ice ablation
and variability in its spatial extent, the model can also reflect the
interannual fluctuations of ice coverage. For example, the model depicted the
very low values of sea ice areal extent observed in 2007 and 2012. The
reconstructed areal changes in sea ice between 850 A.D. and 2005 show some
variability but are consistent with the areal trends reconstructed by Kinnard et al.[13] using proxy
indicators. The modelled results show that the area covered by Arctic sea ice
has declined rapidly over the last two centuries. This decline is most evident
within the last 30 years, during which time the rate of ice reduction surpassed
the ranges of sea ice variability observed at any other point in the preceding
millennium. The recent sea ice areal reduction indicates that climate change
driven by rising atmospheric greenhouse gas concentrations plays a crucial role
in influencing sea ice area. It is worth noting
that although temperature in the historical period is the main factor
influencing the long-term trend of sea ice areal change, the sea ice area time
series does not correspond exactly to the temperature records for the Arctic.
For example, during the Little Ice Age (1450–1850 A.D.), the temperature in the
Arctic region showed a decreasing trend, but the reconstructed sea ice data did
not reveal a significant increasing areal extent and instead showed variable
change. Overall, this millennial-scale sea ice reconstruction reflects an
increase in sea ice coverage during decreasing temperature in the Middle Ages
and also depicts the rapid decreasing trend of sea ice observed in recent
decades. Future work will investigate the uncertainty of this reconstruction
method to improve the accuracy of these results.
Author
Contributions
Guo,
H. wrote the paper, constructed the statistical model of sea ice
albedo-atmospheric circulation and is responsible for the simulation of
historical sea ice change; Ren, S. participated in writing the paper and
producing the dataset.
Conflicts of
Interest
The authors declare no
conflicts of interest.
References
[1]
Wu, F.
M., Li, W. K., Li, W. Causes of Arctic amplification??a review [J]. Advances in Earth
Science, 2019, 34(3): 232–242.
[2]
Hilmer,
M., Jung, T., Evidence for a recent change in the link between the North
Atlantic oscillation and Arctic sea ice export [J]. Geophysical Research Letters, 2000, 27(7): 989–992.
[3]
Rigor,
I. G., Wallace, J. M., Colony, R. L. Response of sea ice to the Arctic
oscillation [J]. Journal of Climate, 2002,
15(18):2648–2663.
[4]
Nakamura,
T., Yamazaki, K., Iwamoto, K., et al. A negative phase shift of the
winter AO/NAO due to the recent Arctic sea-ice reduction in late autumn [J]. Journal of Geophysical Research: Atmospheres, 2015, 120(8): 3209–3227.
[5]
Comiso,
J. C., Parkinson, C. L., Gersten, R., et al. Accelerated decline in the
Arctic sea ice cover [J]. Geophysical
Research Letters, 2008, 35(1): L01703.
[6]
Cavalieri,
D. J., Parkinson, C. L. Antarctic sea ice variability and trends, 1979–2006
[J]. Journal of Geophysical Research: Oceans, 2008, 113(C7).
[7] Stroeve, J. C., Serreze, M. C., Holland, M.
M., et al. The Arctic??s rapidly shrinking sea ice cover: a research
synthesis [J]. Climatic Change, 2012,
110(3): 1005–1027.
[8]
Walsh,
J. E., Chapman, W. L. 20th-century sea-ice variations from observational data
[J]. Annals of Glaciology, 2001, 33: 444–448.
[9]
de
Vernal, A., Hillaire-Marcel, C., Solignac, S., et al. Arctic Sea Ice
Decline: Observations, Projections, Mechanisms, and Implications [M]. (eds
DeWeaver, E. T., Bitz, C. M. & Tremblay, L. B.) (Geophysical Monograph
Series Vol. 80) 2008: 27–45 (American Geophysical Union).
[10]
Bonnet,
S., de Vernal, A., Hillaire-Marcel, C., et al. Variability of seasurface
temperature and sea-ice cover in the Fram Strait over the last two millennia
[J]. Marine Micropaleontol, 2010,
74(3/4): 59–74.
[11]
Ren,
S., Guo, H. Reconstructed dataset of Arctic summer sea ice area (850–2005)
[J/DB/OL]. Digital Journal of Global
Change Data Repository, 2022. https://doi.org/10.3974/geodb.2022.05.01.V1.
https://cstr.escience.org.cn/CSTR:20146.11.2022.05.01.V1.
[12]
GCdataPR
Editorial Office. GCdataPR data sharing policy [OL].
https://doi.org/10.3974/dp.policy.2014.05 (Updated 2017).
[13] Kinnard,
C., Zdanowicz, C. M., Fisher, D. A., et al. Reconstructed changes in
Arctic sea ice over the past 1,450 years [J]. Nature, 2011, 479(7374): 509–512.
[14] Kaufman,
D. S., Schneider, D. P., McKay, N. P., et
al. Recent warming reverses long-term Arctic cooling [J]. Science, 2009, 325(5945): 1236–1239.