Research and Implementation of Geospatial Data Similarity
Calculation Method
Dai, X. L.1,2 Zhu, Y. Q.1,3* Yang, J.1 Sun, K.1 Li, J. D.4 Song, J.1,3
1. State Key Laboratory of Resources and Environmental
Information System, Institute of Geographic Sciences and Natural Resources
Research, Chinese Academy of Sciences, Beijing 100101, China;
2. University of Chinese Academy of Sciences, Beijing
100049, China;
3. Jiangsu Center for Collaborative Innovation in
Geographical Information Resource Development and Application, Nanjing 210023,
China;
4. Dongying Ecology and Environment Bureau, Dongying
257091, China
Abstract: Geospatial data
similarity calculation is one of the key technologies for intelligent data
recommendation and discovery. Existing methods for geospatial data similarity
calculation can be classified into methods based on file information, metadata,
or dataset. Each of these methods has advantages and disadvantages.
Nevertheless, problems such as inaccurate calculation results or extensive calculation
due to missing information items may frequently occur if only one type of
information is used for similarity calculation, thus affecting the application
value of data similarity. To give full play to the advantages of various
methods, this paper proposes a geospatial data similarity calculation method
integrating three levels of file information, metadata, and dataset, and
develops a corresponding software, which can effectively improve the
calculation accuracy and efficiency of geospatial data similarity according to
its actual situation.
Keywords: geospatial data; data
similarity; calculation method; software
DOI: https://doi.org/10.3974/geodp.2022.04.01
CSTR: https://cstr.escience.org.cn/CSTR:20146.14.2022.04.01
Dataset Availability Statement:
The dataset
supporting this paper was published and is accessible through the Digital Journal of
Global Change Data Repository at: https://doi.org/10.3974/geodb.2022.10.02.V1 or
https://cstr.escience.org.cn/CSTR:20146.11.2022.10.02.V1.
1 Introduction
Geospatial data is
a digital representation of the spatial and attribute characteristics of
geographic entities and phenomena, and is one of the basic elements of
geoscientific research[1]. Geospatial data plays an important role
in natural and social science research and has been widely used in many fields
such as emergency management[2], environmental monitoring[3],
natural disaster prediction[4], and population economic research[5].
Geospatial data similarity calculation is to calculate the similarity between data
based on their features. It is one of the key technologies of data intelligent
recommendation and discovery and is widely used in the processes of geospatial
data association network[6], geospatial data intelligent
recommendation[7], and geospatial model automatic matching data[8].
In addition, analogous to text similarity used for document duplication
checking, geospatial data similarity calculation can also be used for
geospatial data duplication checking.
According to the sources of data feature
information used for similarity calculation, the existing geospatial data
similarity calculation methods are divided into three categories: (1)
similarity calculation methods based on file information. This method mainly
calculates the data similarity by information items of data files, such as file
name, file format, etc. For example, Sun et al. proposed a similarity
calculation model for P2P file sharing applications using file information such
as file name, file length, and file type[9]; Kim used a function matching
approach for similarity calculation of binary files[10]; Kim et
al. proposed a partial hash information string algorithm for similarity
calculation of multimedia data files[11]. Such methods are
computationally simple and efficient, yet they can only be used to calculate
fewer data features, and inaccurate recording of file information may occur
(e.g., file names are modified). (2) Metadata-based similarity calculation
method. This method mainly calculates data similarity by metadata items, such as
content topic, time range, spatial range, etc. For example, Zhu et al.
calculated geographic metadata similarity based on eight data attributes such
as data topic, category, spatial coverage, temporal coverage, data type, and
data format to quantitatively interconnect geographic data[6]; Chen et
al. used artificial neural networks to calculate geographic metadata
similarity based on data attributes of keywords, category, spatial coverage,
and temporal coverage of data, and then recommended geographic data based on
the similarity of metadata[3]. These methods enable a more
comprehensive similarity calculation with abundant metadata, yet sometimes
there are many uncertainties, such as missing metadata, incomplete and
imprecise records (e.g., the minimum outer rectangle cannot fully express the
data range of the space). (3) Similarity calculation method based on dataset.
This method mainly calculates the data similarity through the element location
and attribute information of the dataset. For example, Mei et al.
established a calculation model of point feature similarity by studying the
similarity of density, area, and spatial direction of point groups[12];
Zhu et al. calculated the similarity of grid images based on the
similarity relationship of color histograms[13]. By using element
location and attribute information of data entities, these methods can fully
reflect the similarities in the content of data entities. Nevertheless, some
information items (e.g., temporal information of vector data) are not directly
reflected in the data entities and are computationally intensive as they are
calculated either element by element or image by image.
Each of the above three types of methods
has its own advantages and disadvantages, and most of the current studies use only
one of them, which are either not very accurate or computationally intensive
and time-consuming; in addition, the problem that the similarity cannot be
calculated due to the lack of necessary feature factors occurs. This paper
proposes a method for calculating the similarity of geospatial data that
integrates file information, metadata, and dataset. It can comprehensively use
the advantages of each method, and flexibly select different methods and their
combinations according to data information and practical application
requirements, to achieve fast and accurate data similarity calculation. In
addition, by comparing the similarity calculation results of the three levels,
it is beneficial to discover the differences between the data. To realize the
calculation of geospatial similarity, the corresponding software was developed
to accompany it.
2 Geospatial Data Similarity Calculation
2.1 Similarity Factors Selection
The
selection of a suitable similarity factor is a prerequisite for similarity
calculation. By analyzing the characteristics of the three levels, the
corresponding similarity factors were selected.
The information items used for file
information similarity calculation mainly include file name, file format, file
size, number of files, and the like. A file name is a name that identifies one
piece of data from another. Different data usually have different data formats.
The same data usually has the same file size and quantity.
Geospatial metadata is used to describe the
geospatial data and mainly includes information about the content topics,
temporal scope and spatial extent of geospatial data. There are many different
metadata standards, such as ISO19115 metadata standard for geographic
information[14], Content Standard for Digital Geospatial Metadata
(CSDGM)[15], Geographic Information Metadata (GB/T 19710?D2005)[16],
etc. Most of the metadata standards include metadata items such as content
topic, spatial extent, temporal extent, spatial precision, temporal
granularity, etc. Hence, this paper selects the above metadata items to
calculate the metadata similarity.
Geospatial dataset mainly includes two
types of data features: location and attribute. The feature of entity feature
location is the location information of geospatial dataset on pixels or graphics.
The feature of entity feature attribute refers to the attribute items and
attribute values contained in the attribute table. Geospatial dataset formats
mainly include raster and vector types. The similarity of raster dataset is
mainly calculated based on image elements; as vector data can be further
divided into point elements, line elements and surface elements, their
similarity calculation needs to be expanded by point, line, and surface
elements respectively. Among them, the location similarity of entity elements
of point elements is mainly based on point group topology, distribution range,
direction relationship and distance for similarity calculation, and the
location similarity of entity elements of line and area elements is mainly
based on the topological relationship and distance of line or area groups.
Relationships, directional relationships, and geometric features are
calculated.
2.2 Overall Calculation Process
The overall flow of
the integrated calculation method of geospatial data similarity is shown in
Figure 1. The basic steps of the algorithm are: (1) first, calculate the file
information similarity. Using this method to calculate data similarity is
simple and fast, but the similarity obtained is coarse grained, not accurate
enough; (2) then the metadata similarity is further calculated. This method
presupposes the availability of metadata, moderate calculation and medium
granularity of similarity, but depends on the quality of metadata, which may be
missing the metadata or inaccurately described; (3) finally, the dataset
similarity is further calculated. The data entity similarity has high
precision, and the obtained similarity is fine-grained, but the computation is
heavy.
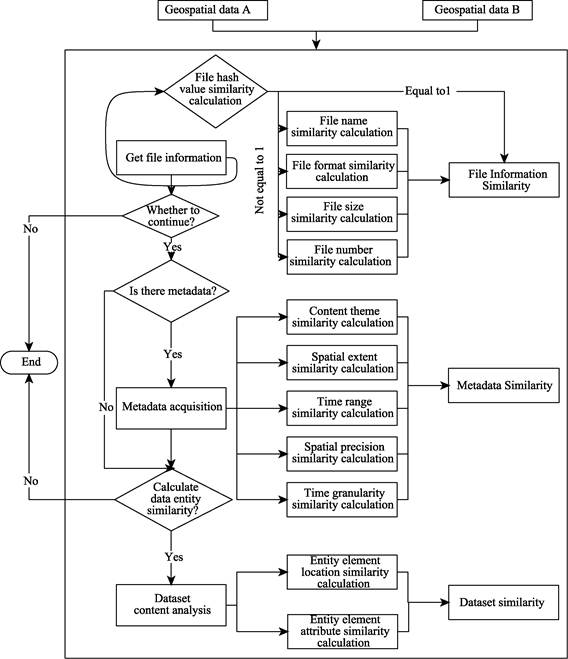
Figure 1 The overall flow of the integrated
calculation method of geospatial data similarity
2.3 Similarity Calculation Method
2.3.1 File Information Similarity
Calculation Method
(1) Calculation
method of file hash value similarity
File hash is a
unique string generated with a hashing algorithm based on file information such
as file name, size, format, etc. Files with identical file information will
generate the same hash value under the same hashing algorithm, but with minor
differences in file information, their hash values will vary greatly.
Therefore, the file hash value (Shash) can quickly determine whether
the file information is the same. In this paper, we use sha256 hash algorithm[17]
to generate data file hash, when two hash values are the same, then the file
hash similarity is 1, otherwise the hash similarity is null (None), and we need
to continue to calculate the similarity of file name, format, size, and number.
(2)
Calculation method of file name similarity
The
text of the file name is short, and a string-based semantic text similarity
algorithm is usually used to judge the consistency of the file name. By
analyzing the characteristics of commonly used string-based text similarity
calculation methods, this paper selects the Minimum Edit Distance (MED)
algorithm[18] for file name similarity calculation.
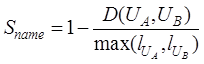
Let UA and UB
be the file names of the two data,  are the lengths
of the two file names respectively, that is, the number of characters in the
string, and
are the lengths
of the two file names respectively, that is, the number of characters in the
string, and  is the edit
distance of the file names A and B, then the file name similarity of geospatial
data is calculated using Equation (1)[19].
is the edit
distance of the file names A and B, then the file name similarity of geospatial
data is calculated using Equation (1)[19].
 (1)
(1)
(3) Calculation
method of file format similarity
Geospatial data
formats mainly include raster and vector formats. The similarity of data
formats depends on the difficulty of converting between the two types of data.
The easier the data conversion, the higher the similarity of the data format of
the two data[8]. According to the difficulty of data conversion,
this paper divides the similarity calculation of data formats into three cases:
the same data format, the data format of the same group and the data format of
different groups.
If the data formats of the two data are the
same, no data conversion is required, so the data format similarity is 1. The
data format of the same family refers to the series of formats that can be
supported by the software products of the same company (such as the data
formats supported by ArcGIS products, shapefile, E00, etc.), whose data
conversion can be relatively easy to achieve through the existing data
processing tools. It has been studied that the data similarity of data formats
of the same family is set to 0.85[8].
The difficulty of converting different
families of data formats is much more complicated compared to the two formats,
and its conversion difficulty is determined by the openness of the data
formats, and the specific similarity calculation method can be found in the
literature of Zhu et al. (2017)[8].
(4) Calculation
method of file number similarity
The number of files
of data is an integer type value greater than 0. Calculating the similarity of
the number of files of geospatial data only requires comparing the size of the
number of files of two geospatial data. Therefore, the similarity of the number
of files of geospatial data is calculated by Equation (2).
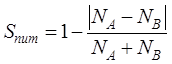 (2)
(2)
where is the similarity between the number of files of dataset A
and dataset B, and NA and NB are the number
of files of dataset A and dataset B, respectively.
is the similarity between the number of files of dataset A
and dataset B, and NA and NB are the number
of files of dataset A and dataset B, respectively.
(5) Calculation
method of file size similarity
File size is the
amount of data stored in the computer and is the sum of the sizes of all files
that make up geospatial data. Since different compression methods change the
file size, the file size in this paper is the size of the file in its
uncompressed state.
Calculating the file size similarity of
geospatial data requires converting the size of all files of both geospatial
data to a value under the same unit, such as a uniform KB or MB. The storage
size similarity of geospatial data can be calculated by equation (3).
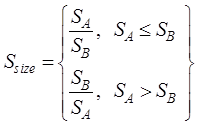 (3)
(3)
where,  is the similarity
between the file sizes of dataset A and dataset B, and SA and
SB are the file sizes of dataset A and dataset B,
respectively.
is the similarity
between the file sizes of dataset A and dataset B, and SA and
SB are the file sizes of dataset A and dataset B,
respectively.
2.3.2 Metadata Similarity Calculation Method
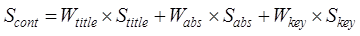
(1) Calculation
method of content theme similarity
The content theme
features of geospatial data mainly consist of metadata titles, keywords and
abstracts. The content topic similarity can be calculated based on the subject
terms of these metadata items. Therefore, the content topic similarity of
geospatial data can be calculated by equation (4).
 (4)
(4)
where,  is the content
subject similarity,
is the content
subject similarity,  is the title
similarity,
is the title
similarity,  is the summary
similarity,
is the summary
similarity,  is the keyword
similarity, and,
is the keyword
similarity, and,  ,
,  and
and  are the
weights of title, summary and keyword respectively. According to Zhu et al. (2017)[8],
the weight of title, keyword and abstract can be set to 0.529, 0.309 and 0.162
respectively.
are the
weights of title, summary and keyword respectively. According to Zhu et al. (2017)[8],
the weight of title, keyword and abstract can be set to 0.529, 0.309 and 0.162
respectively.
The similarity of titles, keywords, and
abstracts is measured by the similarity of the corresponding keywords,
respectively. The calculation process of the similarity of the subject words in
this paper is as follows: (1) Use the word segmentation tool to divide the
continuous text in the extracted title and abstract into multiple words; (2)
Remove the stop words that are meaningless for similarity calculation, such as
??De?? (of) and ??de?? (to) in Chinese, articles in English, etc., and then get the
subject heading; (3) Calculate the feature weight through the term
frequency-inverse document frequency (TF-IDF), which vectorizes subject terms
separately; (4) Use the cosine similarity to calculate the similarity of the
subject terms.
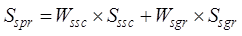
(2) Calculation
method of spatial extent similarity
The spatial extent
of geospatial data is usually represented by the Minimum Bounding Rectangle
(MBR) of the dataset. Therefore, in this paper, the spatial extent of
geospatial data is represented by the MBR. The data spatial extent topological
relationship is first calculated, and then its spatial metric relationship is
further calculated as shown in Equation (5).
 (5)
(5)
where,  is the spatial range similarity,
 and
and are the spatial topological relationship similarity and
spatial metric relationship similarity respectively,
are the spatial topological relationship similarity and
spatial metric relationship similarity respectively,  and
and  are the
corresponding weights, and the specific similarity calculation method and
weight determination method refer to Zhu et al. (2017)[6].
are the
corresponding weights, and the specific similarity calculation method and
weight determination method refer to Zhu et al. (2017)[6].
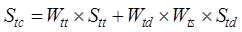
(3) Calculation
method of time range similarity
Time scale of
geospatial data usually has two forms: instantaneous time (time point) and
period (time range). A time horizon usually consists of two time points: the
start time and the end time. Instantaneous time and period are relative and can
be interconverted at different time scales.
According to the
previous analysis, there are three situations in the time range similarity
calculation of geospatial data: (1) Both times are instantaneous; (2) One time
is instantaneous time, the other one is time end; (3) Both are time periods.
For the second case, the instantaneous time can be converted into time interval
by time downscaling method, and the two-time intervals can be unified into the
minimum time scale. For example, if the time scale of one geospatial data is
??year?? (2020) and the time scale of another geospatial data is ??month?? (March
2020?CMarch 2021), then it is necessary to convert the point time with the time
scale of ??year?? (2020) to the time period with the time scale of ??month??
(January 2020?CDecember 2020), so as to keep the two geospatial data with a
unified time scale. From this, the similarity of their time ranges can be
calculated. Therefore, the three cases of time range similarity calculation of
two kinds of geospatial data can be converted to time interval under the same
time scale for calculation.
The time range similarity of geospatial data can be calculated by
combining temporal topological, sequential and measurement relationships[20].
Temporal topological relation is the temporal relation of geographical
phenomena, representing the time when one geospatial data is between, after or simultaneous
with another one. In the case of simultaneous time (equal or intersecting), the
sequence of two-time ranges is also considered. The time measurement
relationship includes two indicators: time overlap ratio and time distance. In
addition, time sequence is also an important indicator to be considered when
calculating time range similarity. It is generally assumed that new data are
better than old data. Therefore, the time range similarity of geospatial data
in this paper is calculated by Equation (6):
 (6)
(6)
where
 is the temporal
range similarity,
is the temporal
range similarity,  and
and are the temporal
topological similarity and temporal distance similarity, respectively,
are the temporal
topological similarity and temporal distance similarity, respectively,  and
and  are the weights
of temporal topological relations and temporal metric relations, respectively,
and
are the weights
of temporal topological relations and temporal metric relations, respectively,
and  is the temporal
order degree, whose specific similarity calculation method and weight
determination method refer to Chen et al. (2018)[20].
is the temporal
order degree, whose specific similarity calculation method and weight
determination method refer to Chen et al. (2018)[20].
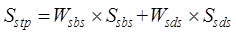
(4)
Calculation method of spatial precision similarity
The
spatial accuracy of geospatial data is usually expressed by the spatial scale
(vector)/resolution (raster) and spatial granularity. The similarity of spatial
accuracy of geospatial data is calculated by equation (7):
 (7)
(7)
where
 denotes the
spatial precision similarity;
denotes the
spatial precision similarity;  and
and  denote the
similarity of spatial scale (resolution) and spatial granularity, respectively;
denote the
similarity of spatial scale (resolution) and spatial granularity, respectively;
 and
and  are the
corresponding weights Its specific similarity calculation method and weight
determination method refer to Zhu et al. (2017)[6].
are the
corresponding weights Its specific similarity calculation method and weight
determination method refer to Zhu et al. (2017)[6].
(5)
Calculation method of time granularity similarity
The
time granularity of geospatial data is generally represented by the data update
frequency. For example, the update interval of the land cover data GlobeLand30
is 10 years. Time granularity is generally measured by the difficulty of
transformation. Different time granularities can be transformed by the time
scale up or down extrapolation method. Upward extrapolation refers to changing
the finer time granularity into the coarser time granularity, which makes the
expression process of geographical entities and phenomena sketchier; downward extrapolation is the opposite. When the
time granularity of two geospatial data is the same, fine-coarse and coarse-fine,
the similarity of time granularity is 1, 0.875 and 0.125[7] respectively.
2.3.3 Dataset Similarity Method
(1) Calculation
method of location similarity of entity elements
Dataset similarity
is a similarity calculation performed at the level of data entity elements. The
premise is that the data types of the datasets to be calculated must be the
same, such as vector data or raster data. The location similarity of entity
elements of raster data is mainly calculated based on the overlapping area of
two raster data. Before calculating the similarity, the coordinate system and
resolution of the two-raster data are unified, and then calculated according to
Equation (8):
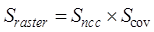 (8)
(8)
where  is the similarity of entity element locations of raster data,
 and
and are the normalized correlation coefficients and overlap
ratios of the overlapping regions of the two raster data, respectively.
are the normalized correlation coefficients and overlap
ratios of the overlapping regions of the two raster data, respectively.
For the normalization coefficient of the
overlapping area of the raster data, the Equation (9) is used to calculate[21]:
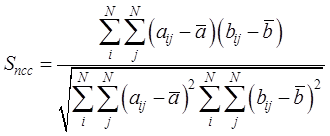 (9)
(9)
where and
and are the image values of raster data A and B with ranks iand
j, respectively,
are the image values of raster data A and B with ranks iand
j, respectively,  and
and  are the average
values of image elements in the overlapping area of raster data A and B,
respectively, and N is the number of image elements in the area.
are the average
values of image elements in the overlapping area of raster data A and B,
respectively, and N is the number of image elements in the area.
For the overlap ratio of two raster data,
use Equation (10) to calculate:
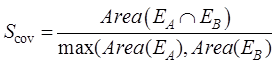 (10)
(10)
where is the overlapping area of raster data A
and B, and
is the overlapping area of raster data A
and B, and  ,
,  are the areas of raster data A and B, respectively.
The location similarity of entity elements
of vector elements is calculated in three cases: point elements, line elements
and polygon elements.
The location similarity of entity elements
of point element data is determined by the topological relationship, distance
relationship, directional relationship, distribution range and density between
point groups, and is calculated by Equation (11):
 (11)
(11)
where is the location similarity of entity elements of point
element data,
is the location similarity of entity elements of point
element data, ,
, ,
,  ,
, and
and are the topological similarity, distribution range similarity,
directional relationship similarity, distance relationship similarity and
distribution density similarity of point element data, respectively, and
are the topological similarity, distribution range similarity,
directional relationship similarity, distance relationship similarity and
distribution density similarity of point element data, respectively, and  ,
, ,
, ,
, and
and are their
corresponding weights, and the specific calculation methods and corresponding
weights of each similarity of the above point elements are referred to the
literature[22].
are their
corresponding weights, and the specific calculation methods and corresponding
weights of each similarity of the above point elements are referred to the
literature[22].
The location
similarity of the entity elements of the line element data is determined by the
topological relationship, distance relationship, direction relationship and
geometric characteristics between the line groups, and is calculated by
Equation (12):
 (12)
(12)
where is the solid element location similarity of the line element
data,,, and
is the solid element location similarity of the line element
data,,, and are the topological similarity, directional relationship
similarity, distance relationship similarity and geometric feature similarity
of the line element data, respectively, and
are the topological similarity, directional relationship
similarity, distance relationship similarity and geometric feature similarity
of the line element data, respectively, and  ,
, ,
, and
and  are their corresponding weights, and the specific
calculation methods and corresponding weights of each similarity of the above
line elements are referred to the literature[12].
are their corresponding weights, and the specific
calculation methods and corresponding weights of each similarity of the above
line elements are referred to the literature[12].
The location
similarity of solid elements for the face element data is calculated in the
same way as for the line elements, and the specific calculation method and
corresponding weights for each similarity of the face elements are referred to
the literature[23].
(2)
Calculation method of attribute similarity of entity elements
The
attributes of geospatial data are usually represented by the attribute item
names and attribute values in the attribute table of the layer, so the
attribute similarity is usually determined by the attribute item names and
attribute values, which is calculated as shown in Equation (13).
 (13)
(13)
where,
 and
and  are the
similarity of attribute item names and attribute values, respectively, and
are the
similarity of attribute item names and attribute values, respectively, and  and
and are their
corresponding weights. According to Tan, et
al (2017)[24], the values of and are 0.4
and 0.6, respectively. The similarity of both attribute item names, and
attribute values is measured overall by the edit distance algorithm.
are their
corresponding weights. According to Tan, et
al (2017)[24], the values of and are 0.4
and 0.6, respectively. The similarity of both attribute item names, and
attribute values is measured overall by the edit distance algorithm.
2.3.4 Similarity Aggregation Method and Application Strategy
(1)
Similarity aggregation method
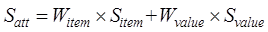
Based
on the similarity of the above single feature or metadata item, the
hierarchical analysis method can be used to calculate the composite similarity
of each level (file similarity, metadata similarity and dataset similarity).
The specific method is shown in Equation (14).
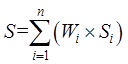 (14)
(14)
where
S is the composite similarity of each
level, Si and Wi are the i-th single
feature similarity and the corresponding weights, n represents the
number of single feature similarities, and Wi are calculated
using hierarchical analysis (Table 1). When a single similarity is missing, the
other similarities at that level are reassigned with local weights according to
the similarity size of the local weights for the composite similarity of that
level.
Table
1 Weights for calculating the composite
similarity at each level
|
Compound similarity
|
Single similarity
|
Local weights
|
|
File information
similarity
|
File name similarity
|
0.500
|
|
File format similarity
|
0.200
|
|
File size similarity
|
0.200
|
|
File number similarity
|
0.100
|
|
Metadata similarity
|
Content theme similarity
|
0.550
|
|
Spatial extent similarity
|
0.100
|
|
Time range similarity
|
0.150
|
|
Spatial precision similarity
|
0.100
|
|
Time granularity similarity
|
0.100
|
|
Dataset similarity
|
Location similarity of entity elements
|
0.625
|
|
Attribute similarity of entity elements
|
0.375
|
(2) Application
strategy
Firstly, the similarity
of the two data is roughly calculated by the file information similarity, and
then the metadata similarity is calculated. If the metadata is missing or
a more accurate similarity is
required, the dataset similarity can be further calculated, thus forming
different levels of data similarity calculation to meet the application
requirements and achieve the objectives of both accuracy and efficiency of
geospatial data confidence calculation.
3 Systems Software
3.1 Geospatial Data Similarity Calculation Software
To
facilitate the understanding and application of geospatial data similarity
calculation, this paper developed Geospatial Data Similarity Calculation
Software (GDSCS V1.0) based on Python language[25]. Due to the
complexity and diversity of geospatial data, this software is implemented only
using the National Tibetan Plateau Data Center as the
data source.
3.2 GDSCS Software Functions and Test Results
GDSCS
is a geospatial similarity computing software which integrates feature
analysis, similarity calculation and result visualization based on geospatial
data similarity calculation method. The functions of the software include
geospatial data input, data feature information extraction, data similarity
calculation, visualization, and derivation of the results. ??Vegetation coverage
data of Sichuan-Tibet traffic corridor (1985?C2020)[26]?? (hereinafter
referred to as Data A) and ??Vegetation cover resilience dataset for countries
along the Belt and Road (2000?C2020)[27]?? (hereinafter referred to as
Data B) were randomly selected from the National Qinghai-Tibet Plateau Data
Center as experimental data to test the operation and results of the GDSCS
system. The file information of data A and data B is shown in Table 2.
The results of the file test, metadata test
and entity data test using GDSCS software are shown in Figure 2, 3 and 4. It
should be noted that the metadata input format is json, and the entity data
input format are vector (.shp) and raster (.tif).
Table
2 File information of data A and data B
|
File information item
|
Data A
|
Data B
|
|
File name
|
CZLD_VFC_1000m_2016-2020
|
vegetation_country
|
|
File format
|
.tif
|
.shp
|
|
File size
|
37.6 MB
|
616 MB
|
|
File number
|
8
|
10
|
|
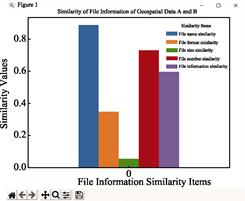
Figure 2 The result of file
information similarity calculation
|
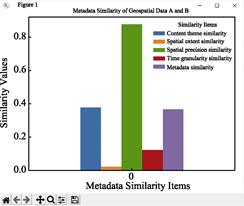
Figure
3 The result of metadata
similarity calculation results
|
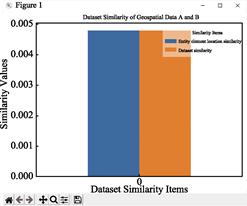
Figure
4 The result of dataset
similarity calculation results
|
4 Discussion and Conclusion
Geospatial
data similarity calculation and application is of great value and significance
for geospatial data sharing and intelligent discovery. The GDSCS method
proposed in this paper provides an operational tool for similarity calculation
and dataset checking of scientific data and lays the foundation for further
improvement. GDSCSV1 has further aspects of improvement in both theoretical
methods and tool implementation. For example, in the calculation of file
information similarity, the degree of file information association, the
diversity of metadata formats, the diversity of data formats of entity
datasets, the content association of spatial data, and the particularity of
similarity calculation of systematic spatial location offset need to be further
improved and perfected.
Author Contributions
Zhu, Y. Q. was responsible for the overall design
of the method and the revision of the paper; Dai, X. L. carried out the method
practice and writing; Yang, J. carried out the method research; Sun, K. was
responsible for the method research; Li, J. D. participated in the design of
the method and the revision of the paper; Song, J. revised the paper.
Conflicts of Interest
The authors declare no conflicts of
interest.
References
[1]
Zhu, Y., Yang, J. Automatic
data matching for geospatial models: a new paradigm for geospatial data and
models sharing [J]. Annals of GIS,
2019, 25(4): 283‒298.
[2]
Chen, Z., Yang, Y. Semantic
relatedness algorithm for keyword sets of geographic metadata [J]. Cartography
and Geographic Information Science,
2020, 47(2): 125‒140.
[3]
Chen,
Z., Song, J., Yang, Y. An approach to measuring semantic relatedness of geographic
terminologies using a thesaurus and lexical database sources [J]. ISPRS
International Journal of Geo-Information, 2018, 7(3): 98.
[4]
Zhao, H. W., Zhu, Y. Q., Yang,
H. W., et al. The semantic relevancy computation model on essential
features of geospatial data [J]. Geographical Research, 2016, 35: 58‒70.
[5]
Guo, H., Liu, Z., Jiang, H., et
al. Big earth data: a new challenge and opportunity for digital earth??s
development [J]. International Journal of Digital Earth, 2017, 10(1): 1‒12.
[6]
Zhu, Y., Zhu, A. X., Song, J., et
al. Multidimensional and quantitative interlinking approach for linked
geospatial data [J]. International Journal of Digital Earth, 2017, 10(9): 923‒943.
[7]
Boubenia, M., Belkhir, A.,
Bouyakoub, F. M. Combining linked open data similarity and relatedness for
cross OSN recommendation [J]. International Journal on Semantic Web and
Information Systems (IJSWIS),
2020, 16(2): 59‒90.
[8]
Zhu, Y., Zhu, A. X., Feng, M., et
al. A similarity-based automatic data recommendation approach for
geographic models [J]. International Journal of Geographical Information
Science, 2017, 31(7):
1403‒1424.
[9]
Sun, J. J., Yu, J. G., Liu, X. T.
Similarity-computing model for P2P file-sharing networks [J]. Computer
Engineering and Applications, 2012,
48(4): 111‒114.
[10]
Kim, T. G., Lee, Y. R., Kang,
B. J., et al. Binary executable file similarity calculation using
function matching [J]. The Journal of Supercomputing, 2019, 75(2): 607‒622.
[11]
Kim, B. K., Oh, S. J., Jang, S.
B., et al. File similarity evaluation scheme for multimedia data using
partial hash information [J]. Multimedia Tools and Applications, 2017, 76(19): 19649‒19663.
[12]
Liu, T., Du, Q. Y., Mao, H. C.
Spatial similarity assessment model and its application in line groups [J]. Geomatics
and Information Science of Wuhan University, 2012, 37(8): 992‒995.
[13]
Zhu, S. Image similarity
computation by using histogram method [J]. Bulletin of Surveying and
Mapping, 2018(12): 96‒100.
[14]
Karschnick, O., Kruse, F. A.,
Töpker, S., et al. The UDK and ISO 19115 standard [C]. EnviroInfo, 2003:
475‒481.
[15]
Authority, T. V. Content
standard for digital geospatial metadata [D]. National Aeronautics and Space
Administration, 1998.
[16]
Jiang, J., Liu, R. China geographic
information??metadata GB/T 19710?D2005 [S]. World Spatial Metadata Standards:
Elsevier Science, 2005.
[17]
Rachmawati, D., Tarigan, J. T.,
Ginting, A. B. C. A comparative study of Message Digest 5 (MD5) and SHA256
algorithm [J]. Journal of Physics: Conference Series, 2018, 978(1): 012116.
[18]
Strube, M., Rapp, S., M??ller,
C. The influence of minimum edit distance on reference resolution [C].
Proceedings of the 2002 Conference on Empirical Methods in Natural Language
Processing (EMNLP 2002), 2002: 312‒319.
[19]
Zhao, Z. P., Yin, Z. M., Wang,
Q. P., et al. An improved algorithm of Levenshtein Distance and its
application in data processing [J]. Journal of computer applications, 2009, 29(2): 424‒426.
[20]
Chen, Z., Song, J., Yang, Y.
Similarity measurement of metadata of geospatial data: an artificial neural
network approach [J]. ISPRS International Journal of Geo-Information, 2018, 7(3): 90.
[21]
Rao, Y. R., Prathapani, N.,
Nagabhooshanam, E. Application of normalized cross correlation to image
registration [J]. International Journal of Research in Engineering and
Technology, 2014,
3(5): 12‒16.
[22]
Duan, X. Q., Liu, T., Wu, D.
Spatial similarity assessment of point clusters in multi-scale map spaces based
on analytic hierarchy process [J]. Journal of Geo-information Science, 2016, 18(10):1312‒1321.
[23]
Liu, C., Yan, G. W. Geometry
similarity assessment model of spatial polygon group [J]. Journal of Geo- Information Science, 2013, 15(5): 635‒642.
[24]
Tan. Y. B., Tang, Y., Li, X. L.,
et al. Semantic-based geographic feature property similarity measurement
model [J]. Remote Sensing Information, 2017, 32(1): 126‒133.
[1]
Dai, X. L., Zhu, Y. Q., Yang,
J., et al. A software for geospatial
data similarity calculation [J/DB/OL]. Digital
Journal of Global Change Data Repository, 2022. https://doi.org/10.3974/geodb.2022.10.02.V1.
https://cstr.escience.org.cn/CSTR:20146.11.2022.10.02.V1.
[25]
Sui, T. Vegetation coverage
data of Sichuan Tibet traffic corridor (1985?C2020) [OL]. National Tibetan
Plateau Data Center, 2021. https://doi.org/10.11888/Soil.tpdc.271618.
[26]
Xu, X. Vegetation cover
resilience dataset for countries along the Belt and Road (2000?C2020) [OL].
National Tibetan Plateau Data Center, 2022.
https://doi.org/10.11888/HumanNat.tpdc.272282.