A Time Series Land Ecosystem Classification
Dataset of China in Five-Year Increments (1990–2010)
Xu, X. L.1* Liu, J. Y1 Zhang, Z. X.2 Zhou, W. C.3 Zhang, S. W.4 Li, R. D.5
Yan, C. Z.6 Wu, S. X7 Shi, X. Z.8
1. Institute of Geographic Sciences and Natural Resources Research, Chinese Academy of Sciences, Beijing 100101, China;
2. Institute of Remote Sensing and Digital Earth, Chinese Academy of Sciences, Beijing 100101, China;
3. Institute of Mountain Hazards and Environment, Chinese Academy of Sciences, Chengdu 610041, China;
4. Northeast Institute of Geography and Agroecology, Chinese Academy of Sciences, Changchun 130012, China;
5. Institute of Geodesy and Geophysics, China Academy of Sciences, Wuhan 430077, China;
6. Cold and Arid Regions Environmental and Engineering Research Institute, Chinese Academy of Sciences, Lanzhou 730000, China;
7. Xinjiang Institute of Ecology and Geography, Chinese Academy of Sciences, Urumqi 830011, China;
8. Institute of Soil Science, Chinese Academy of Sciences, Nanjing 210008, China
Abstract: Because the territories of China are vast and include a large range of different ecosystems, evaluating both their types and function has a profound impact on regional and national sustainable development. Thus, using land use and land cover (LULC) data for 1990, 1995, 2000, 2005, and 2010, we developed a multi-period spatiotemporal distribution dataset for Chinese land ecosystem types. This was accomplished by classifying and processing LULC data by identifying and studying major ecosystem types. The dataset reported in this study is significant because it enables the identification of ecosystem types at regional and national scales, and furthers our knowledge of the geographical distribution of ecosystem types. In addition, we are now able to more completely understand the spatial structure and evolutionary characteristics of Chinese ecological systems, support their ecosystem services, and ensure national ecological security. The dataset reported here comprises six files, five of which contain data and one that outlines our data sources.
Keywords: China; ecosystem; type data; spatiotemporal distribution; five-year increments.
1 Introduction
Ecological system is a dynamic and complex functional unit comprising interactions between plants, animals, microbes, and the inorganic environment. Because this functional unit is a basic component of the system supporting life on Earth, any changes in status will decisively influence human sustainable development. The ecological system is an important part of the biosphere, and plays a critical role in maintaining the dynamic balance between life and the environment, as well as global ecosystem services and functions[1]. Thus, research on terrestrial ecosystem services has become a major strategic requirement enabling ecosystem restoration, the zoning of ecological functions, and the establishment of ecological compensation mechanisms to ensure national ecological security[2]. There are a huge variety of terrestrial ecosystems in China, including forests, grasslands, wetlands, deserts, tundra (including alpine tundra), and complex farmland systems, each of which encompasses a range of climates and soils[3]. China boasts rich biological resources across a vast land area, but also has a large population, and a variety of land use forms. Thus, the evolution of function and the distribution of ecosystem types in China has had a profound influence on regional and national sustainable development. Against the backdrop of economic transition, social change, and improvements in productivity since the 1970s, the types and structure of Chinese ecosystems have changed dramatically. Because of the negative effects caused by huge population pressure and the social economy, all natural ecological systems in China are presently facing different levels of degradation, including enormous decreases in forested area, degradation of grassland and wetland ecosystems, and an expansion of desertification[4]. This degradation of the quality of ecological systems is expressed not only by a decrease in total area, but more seriously by the reduction or loss of structure and function[5], combined with water shortages, soil erosion, desertification, and biodiversity decline. At the same time, a number of other ecological problems continue to increase, creating serious threats to national ecological security. It is therefore of great importance to identify ecosystem types at the regional and national scale in order to develop an enhanced understanding of their geographical distribution, as well as to better understand their spatial structure and evolutionary characteristics. This enhanced level of understanding will also better support Chinese ecosystem services and ensure national ecological security.
The spatiotemporal distribution dataset of Chinese terrestrial ecosystems (ChinaEco100)[6] was an important advance in the monitoring of terrestrial ecosystems using remote sensing (RS). The ChinaEco100 dataset includes distribution data for the main ecological systems of forests, grasslands, farmland, water, wetlands, settlements, and deserts for the time periods 1990, 1995, 2000, 2005, and 2010.
2 Metadata of Dataset
The descriptions of the ChinaEco100 dataset are recorded here. Table 1 summarizes the main metadata elements of the ChinaEco100 dataset.
Table 1 The metadata summary of the ChinaEco100 dataset
|
Items
|
Description
|
|
Dataset full name
|
Time series land ecosystem classification dataset of China in five-year increments
|
|
Dataset short name
|
ChinaEco100
|
(To be continued on the next page)
(Continued)
|
Items
|
Description
|
|
Authors
|
Xu, X. L. L-5222-2016, Institute of Geographic Sciences and Natural Resources Research, Chinese Academy of Sciences, xuxl@lreis.ac.cn
Liu, J. Y. B-9555-2014, IGSNRR/CAS, liujy@igsnrr.ac.cn
Zhang, Z. X. L-6187-2016, Institute of Remote Sensing and Digital Earth, Chinese Academy of Sciences, zhangzx@irsa.ac.cn
Zhou, W. C., Institute of Mountain Hazards and Environment, Chinese Academy of Sciences; zhouwc@imde.ac.cn
Zhang, S. W., Northeast Institute of Geography and Agroecology, Chinese Academy of Sciences, zhangshuwen@neigae.ac.cn
Li, R. D. D-1002-2017, Institute of Geodesy and Geophysics, China Academy of Sciences, lrd@asch.whigg.ac.cn
Yan, C. Z. C-9846-2017, Cold and Arid Regions Environmental and Engineering Research Institute, Chinese Academy of Sciences, yancz@lzb.ac.cn
Wu, S. X. D-1002-2017, Xinjiang Institute of Ecology and Geography, Chinese Academy of Sciences, wushixin@ms.xjb.ac.cn
Shi, X. Z., Institute of Soil Science, Chinese Academy of Sciences; xzshi@issas.ac.cn
|
|
Geographical region
|
Between 18°00¢N and 53°33¢N, and 73°33¢E and 135°05¢ E, covering mainland China
|
|
Years
|
1990, 1995, 2000, 2005, and 2010
|
|
Temporal resolution
|
Five years
|
|
Spatial resolution
|
100 m
|
|
|
|
Data format
|
ArcGIS GRID
|
|
|
|
Data size
|
953 MB
|
|
|
|
Data files
|
The ChinaEco100 dataset comprises six files, they are:
1. Ecosyschina1990.rar. This file contains Chinese ecosystem data for 1990
2. Ecosyschina1995.rar. This file contains Chinese ecosystem data for 1995
3. Ecosyschina2000.rar. This file contains Chinese ecosystem data for 2000
4. Ecosyschina1990.rar. This file contains Chinese ecosystem data for 1990
5. Ecosyschina2010.rar. This file contains Chinese ecosystem data for 2010
6. ChinaEco100_RS.xlsx. describes all basic data sources
|
|
Foundation(s)
|
Ministry of Science and Technology of P. R. China (2013BAC03B01, 2010CB950901, 2006BAC08B03); National Natural Science Foundation of China (78659, 12784); Chinese Academy of Sciences (A75123)
|
|
Data publisher
|
Global Change Research Data Publishing and Repository, http://www.geodoi.ac.cn/
|
|
Address
|
No. 11A, Datun Road, Chaoyang District, Beijing 100101, China
|
|
Data sharing policy
|
Data from the Global Change Research Data Publishing and Repository includes metadata, datasets (data products), and publications (in this case, in the Journal of Global Change Data & Discovery). Data sharing policy includes: (1) Data are openly available and can be downloaded via the Internet; (2) End users are encouraged to use Data subject to citation; (3) Users, who are by definition also value-added service providers, are welcome to redistribute Data subject to written permission from the GCdataPR Editorial Office and the issuance of a Data redistribution license; and (4) If Data are used to compile new datasets, the ‘ten per cent principal’ should be followed such that Data records utilized should not surpass 10% of the new dataset contents, while sources should be clearly noted in suitable places in the new dataset[7]
|
3 Methods
The Chinese spatiotemporal distribution dataset of ecosystem types (ChinaEco100) discussed in this paper encompasses multi-period terrestrial ecosystem types generated via classification following the identification and study of land use and land cover (LULC) data from 1990, 1995, 2000, 2005, and 2010, acquired by interpretation of RS images.
3.1 RS Image Information Sources
The dataset presented in this study is predominantly based on RS images captured by the United States Landsat TM (ETM) satellite in 1990, 1995, 2000, 2005, and 2010. However, information on terrestrial ecosystem types was supplemented with images captured by the Chinese Environmental Disaster Mitigation Satellite (HJ-1A+B) and the Pakistan Resources Satellite (CBERS) when Landsat TM images were either missing or phase poor.
Our RS visualization of Chinese terrestrial ecosystems in 1990 was constructed from 516 Landsat TM images captured between 1988 and 1992, while visualization for 1995 is based on 572 Landsat TM images captured between 1994 and 1995. Similarly, visualization for 2000 is based on 642 Landsat TM images captured between 1990 and 2001, visualization for 2005 is based on 547 Landsat TM images captured between 2004 and 2006, and visualization for 2010 references 673 Landsat TM images captured between 2009 and 2011. Specific information relevant to each Landsat TM (ETM) image can be found in the ChinaEco100_RS.xlsx dataset file. These RS data completely cover the land area of China; indeed, quality is ensured because different sensor types and phase data are often available for the same area, improving the accuracy of both mapping and interpretation.
In addition to data quality (e.g. cloud cover less than 10% of the total image), seasonal differences between different regions were also taken into account when selecting RS data sources. For example, in order to accurately distinguish differences in vegetation cover, it is necessary to select RS images that capture the growing season in northern China, while at the same time choosing those for early spring, late autumn, or winter that cover the denser vegetated areas of southern China. Specifically, we selected cloud-free RS images of northeastern and northwestern China that encompass the period between mid June and late September, including three provinces in NE China, and five provinces in North and NW China ( Inner Mongolia, Qinghai, Gansu, Ningxia, and Xinjiang). At the same time, we selected images covering the period between early May and mid October for the plain and adjacent areas in northern China, including Beijing, Tianjin, Hebei, Henan, Shandong, Shanxi, and Shanxi. Images covering the period between early March and late October were selected for the northern regions of central, eastern, and southwestern China, encompassing Shanghai, Zhejiang, Jiangsu, Anhui, Hubei, Hunan, Jiangxi, Sichuan, Chongqing, Guizhou, and Yunnan, while winter images were selected to cover most areas of southern China and the southern region of southwestern China, including Guangdong, Guangxi, Hainan, Fujian, Taiwan, Hong Kong, and Macao. Finally, we selected images that encompass the period between July and September to cover the high altitude areas of the Qinghai-Tibet Plateau and adjacent regions.
3.2 Correction and Preprocessing of RS Images
The correction and preprocessing of RS images included false color synthesis, geometric correction, and the construction of mosaics at the county level. For example, geometric correction for the 1990 image involved selection of a topographic map as a control image which enabled other images to be rectified. We used the Krasovsky_1940_Albers projection, as follows:
Geographic coordinate system: Geodetic coordinate system;
Projection: Albers;
Southern standard latitude: 25°N; northern standard latitude: 47°N; central meridian: 105°E;
Coordinate origin: Intersection between the central meridian and equator;
Zonal offset: 0°; Radial offset: 0°;
Ellipsoid parameters: Krasovsky, a = 6,378,245.000,0 m, b = 6,356,863.018,8 m;
Uniform metric unit: m.
In all cases, the average positional error of geometric rectification was not more than 50 m (about two pixels). Images were processed using standard false color synthesis, encapsulating 4, 3, and 2 Landsat TM/ETM images, and were subsequently saved in Geotif format.
3.3 LULC Extraction
In order to acquire an objective and scientific understanding of both spatial patterns and dynamic changes in Chinese terrestrial ecosystems, we identified and investigated the land ecosystem types based on the RS data for 1990, 1995, 2000, 2005, and 2010.
As part of the construction of a national thematic LULC database, we also designed a technical scheme for Chinese land use RS mapping. The interpretation of RS images via human-computer interactions is at the core of this approach (referred to as ‘interactive interpretation’) (Figure 1). Thus, we adopted a LULC classification scheme based on RS monitoring, and established a consistent interpretation standard to ensure the accuracy of our manual interpretation of RS images, including six one-level and 25 two-level types. Additional technical details relating to the development of this national scale LULC database have been presented elsewhere[8–20].
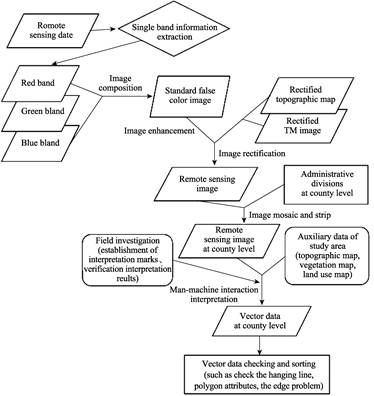
Figure 1 Technical flow chart showing the extraction of LULC information
3.4 Ecosystem Classification and Transformation
The results of this study have enabled us to develop a classification scheme for Chinese terrestrial ecosystems that encompasses seven distinct types.
(1) Farmland ecosystems include all of the different crop types grown by humans, and normally comprise individually structured single-vegetation communities, mainly include paddy fields and dry land.
(2) Forest ecosystems predominantly comprise tree-based biological communities (i.e., plants, animals, and microbes in tropical rainforest ecosystems) and associated abiotic environments (i.e., light, heat, water, air, and soil), mainly include forested land (i.e., forest), scrub, as well as various woodland types.
(3) Grasslands are open ecosystems that contain biological communities and include feed plants, herbivores, and associated environments, include high, middle, and low coverage grasslands.
(4) Water and wetland ecosystems are specific kinds of natural complexes that form in aqueous environments, mainly include swamps, canals, lakes, reservoirs, glaciers, permanent snow, and flooded lands.
(5) Desert ecosystems are the result of the synergy between specific biological communities and their surrounding environment, mainly include sandy, saline, alkali, and alpine deserts, notably the Gobi desert.
(6) Settlement ecosystems refer to residential human accumulations, closely connected with the number of households, and thus population, settled in a particular area or region, mainly include urban, rural residential, and industrial land.
(7) The other ecosystems included in this dataset comprise additional natural geographic units including barren land and rock gravel.
Thus, employing a two-level LULC classification for 1990, 2000, and 2010, we merged several different classification systems that have been used to describe Chinese terrestrial ecosystems (Table 1).
4 Dataset Composition and Validation
4.1 Composition
The spatiotemporal distribution dataset of Chinese terrestrial ecosystems that we present in this paper encompasses five time periods (Figure 2, Table 2), describing the main ecological system types that were present across the country in 1990, 1995, 2000, 2005, and 2010. The dataset therefore includes forests, grasslands, farmland, water and wetland, settlements, and desert ecosystem types.
4.2 Date Validation
In order to ensure the quality of our interpretations as well as the consistency of acquired data, we undertook a process of unified data quality inspection and integration. Results show that it was mostly the fall season in northern China and the spring in southern China when RS interpretation of LULC data was carried out, and that field surveys had been conducted in all provinces with the exception of Taiwan. Thus, we collected a large number of field survey records and photos containing positional information, and conducted random field validation at the county level. This random survey work encompassed 10% of all counties;
Table 2 Area statistics of Chinese terrestrial ecosystem types (km2)
|
No.
|
Ecosystem types
|
1990
|
1995
|
2000
|
2005
|
2010
|
|
1
|
Farmland ecosystems
|
1,771,564.82
|
1,755,171.15
|
1,799,521.95
|
1,792,399.01
|
1,786,892.98
|
|
2
|
Forest ecosystems
|
2,255,265.96
|
2,277,528.81
|
2,243,210.33
|
2,246,308.85
|
2,246,633.86
|
|
3
|
Grassland ecosystems
|
3,038,731.22
|
2,989,558.37
|
3,011,221.13
|
3,000,211.98
|
2,999,098.49
|
|
4
|
Water and wetland ecosystems
|
357,850.26
|
351,847.90
|
356,485.30
|
357,253.50
|
358,178.35
|
|
5
|
Desert ecosystems
|
1,292,556.40
|
1,282,659.32
|
1,286,879.04
|
1,285,728.80
|
1,282,526.70
|
|
6
|
Settlement ecosystems
|
156,474.71
|
168,124.02
|
173,131.77
|
188,973.07
|
198,597.86
|
|
7
|
Other ecosystems
|
629,031.62
|
675,102.58
|
630,897.16
|
631,189.21
|
631,131.25
|
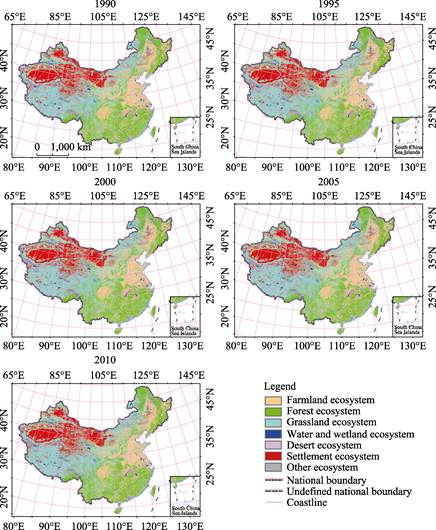
Figure 2 Spatiotemporal distribution map showing Chinese terrestrial ecosystems
during different time periods
for example, we carried out field investigations in 1999 to validate the accuracy of RS interpretations of LULC data for 1995, obtaining more than 7,900 geo-located landscape photos. These images include photos recorded by GPS cameras with average location error less than 50 m. Field surveys show that the average location errors of land use maps generated using RS information are less than 50 m, while the rate of correct interpretations is 98.7%. According to our data quality evaluations within each time period, the comprehensive classification accuracy of one-level land use types across China is greater than 94.3%, and more than 91.2% for two-level types[17].
5 Conclusion
The 100 m resolution dataset for Chinese terrestrial ecosystem types presented in this paper reveals the spatiotemporal distribution of main systems nationwide, including forests, grasslands, farmlands, water and wetlands, settlements, and deserts. The ChinaEco100 dataset encompasses five different time periods, 1990, 1995, 2000, 2005, and 2010, and provides critical basic data to enable the continued smooth service functioning of Chinese terrestrial ecosystems. In addition, data contribute to the efficient monitoring and evaluation of the carbon cycle, a more complete understanding of the security situation of the ecological environment in China, as well as the effective scientific formulation and management of a national sustainable development strategy.
References
[1] Shi, Y., Wang, R. S., Huang, J. L., et al. An analysis of the spatial and temporal changes in Chinese terrestrial ecosystem service functions [J]. Chinese Science Bulletin, 2012, (09): 720-731.
[2] Fu, B. J., Zhou, G. Y., Bai, Y. F., et al. The main terrestrial ecosystem services and ecological security in China [J]. Advances in Earth Science, 2009, 24: 571-576.
[3] Li, L., Zhou, K. X., Guo, L. Criteria and methods for assessing the threatened terrestrial ecosystems of China [J]. Journal of Safety and Environment, 2014, 14(2): 259-265.
[4] Xu, W. H., Ouyang, Z. Y., Huang, H., et al. Priority analysis on conserving China’s terrestrial ecosystems [J]. Acta Ecologica Sinica, 2006, 26(1): 154-163.
[5] Ma, K. P., Qian, Y. Q. Biodiversity conservation and its research progress [J]. Chinese Journal of Applied and Environmental Biology, 1998, 4(1): 95-99.
[6] Xu, X. L., Liu, J. Y, Zhang, Z. X., et al. Time series of land ecosystem classification dataset of China in five yearly steps [DB/OL]. Global Change Research Data Publishing & Repository, 2015. DOI: 10.3974/geodb.
2015.01.01.V1.
[7] GCdataPR Editorial Office. GCdataPR data sharing policy [OL]. DOI: 10.3974/dp.policy.2014.05 (Updated 2017).
[8] Liu, J. Y. Remote Sensing Survey and Dynamic Study of Chinese Resources and Environment [M]. Beijing: Science and Technology of China Press, 1996.
[9] Liu, J. Y. Study on national resources & environment survey and dynamic monitoring using remote sensing [J]. Journal of Remote Sensing, 1997, 1(3): 225-230.
[10] Zhuang, D. F., Liu, J. Y., Liu, M. L. Research activities on land use/cover change in the past ten years in china using space technology [J]. Chinese Geographical Science, 1999, 9(4): 330-334.
[11] Liu, J. Y., Aoser, B. Study on spatial-temporal feature of modern land use change in China: Using remote sensing techniques [J]. Quaternary Sciences, 2000(3): 229-239.
[12] Liu, J. Y., Liu, M. L., Deng, X. Z., et al. The land use and land cover change database and its relative studies in China [J]. Journal of Geographical Sciences. 2002, 12(3): 275-282.
[13] Liu, J. Y., Liu, M. L., Zhuang D. F., et al. Study on spatial pattern of land-use change in China during 1995-2000 [J]. Science in China (Series D), 2002, 32(12): 1031-1040.
[14] Liu, J. Y., Zhang, Z. X., Zhuang, D. F., et al. A study on the spatial-temporal dynamic changes of land-use and driving forces analyses of China in the 1990s [J]. Geographical Research, 2003, 22: 1-12.
[15] Liu, J. Y., Zhang, Z. X., Zhuang, D. F., et al. Study on the Spatial-Temporal Information of Remote Sensing of Chinese Land-use Change in the 1990s [M]. Beijing: Science Press, 2005, 241-243.
[16] Liu, J. Y., Liu, M. L., Tian, H. Q., et al. Spatial and temporal patterns of China's cropland during 1990-2000: an analysis based on Landsat TM data [J]. Remote Sensing of Environment, 2005, 98(4): 442-456.
[17] Liu, J. Y., Zhang, Z. X., Xu, X. L., et al. Spatial patterns and driving forces of land use change in China in the early 21st century [J]. Acta Geographica Sinica, 2009, 64(12): 1411-1420.
[18] Xu, X. L., Liu, J. Y., Zhuang, D. F. Remote sensing monitoring methods of land use/cover change in national scale [J]. Journal of Anhui Agricultural Sciences, 2012, 40(4): 2365-2369.
[19] Liu, J. Y., Kuang, W. H., Zhang, Z. X. Spatiotemporal characteristics, patterns and causes of land use changes in China since the late1980s [J]. Acta Geographica Sinica, 2014, 69(1): 3-13.
[20] Xu, X. L., Pang, Z. G., Yu, X. F. Analysis Methods and Applications of Spatiotemporal Information of Land Use Change [M]. Beijing: Scientific and Technical Documentation Press, 2014, 90-108.