Development of Spatial Distribution Dataset of Buildings in
Haibei Prefecture, Qinghai Province (2020)
Ma, M. F.1 Liu, F. G.1,2* Zhou, Q.1,2 Che, Q.1,2 MA, X. Y.3 Gao, Y.1 Chen, Y. M.1 Gao, H. X.1 Ding, Y. H.1
1. School of Geographical
Sciences, Qinghai Normal University, Xining 810008, China;
2. Academy of Plateau Science
and Sustainability, Xining 810008, China;
3. Hualong Qunke New Area
Middle School, Haidong 810900, China;
Abstract: Haibei Tibetan autonomous prefecture (hereinafter
referred to as Haibei prefecture) is located in the northeastern part of
Qinghai province, and is one of the regions where more earthquakes occur in
Qinghai province, Among them, Menyuan has been the site of several major
earthquakes, the most recent of which occurred on January 8, 2022 with a
magnitude of 6.9 in Menyuan. In earthquakes, there is a lack of data on
buildings as one of the most important substrates of disaster-bearing
bodies.Based on AI Earth platform of Ali cloud and ESA??s 10-m resolution land
use data, the buildings within the counties of Haibei prefecture were extracted
by using the 0.6 m high resolution image of July 2020 and combined with the
construction land use data in the land use. Finally, the spatial distribution
dataset of regional buildings in Haibei prefecture (2020) was obtained,
including building data of Qilian county, Menyuan county, Guncha county and
Haiyan county. The dataset is archived in .shp format with data size of 9.18 MB
(compressed into 1 file, 3.55 MB in total).
Keywords: Haibei prefecture;
Qinghai province; building; spatial distribution; 2020
DOI: https://doi.org/10.3974/geodp.
2022.04.15
CSTR: https://cstr.escience.org.cn/CSTR:20146.14.2022.04.15
Dataset Availability Statement:
The dataset supporting this paper
was published and is accessible through the Digital Journal of Global Change Data Repository
at: https://doi.org/10.3974/geodb.2021.11.01.V1 or
https://cstr.escience.org.cn/CSTR:20146.11.2022.11.01.V1.
1 Introduction
Earthquake
disasters are characterized by high suddenness, destructiveness and
uncertainty. Directly affecting human life safety issues, about 60% of global
land-based destructive seismic hazards occur in the Mediterranean-Himalayan
seismic zone[1], Earthquakes occur frequently in the northeastern
region of Qinghai province, and Haibei prefecture is one of the more frequent
regions in Qinghai province, On January 21, 2016, a 6.4 magnitude earthquake
occurred in Menyuan county, Haibei prefecture, Qinghai province, with a depth
of 10 km, various economic losses were estimated to reach 76 million yuan, 600
houses were damaged, and 9 people were injured. At 1:00 on January 8, 2022, a
6.9 magnitude earthquake occurred in Menyuan county, Haibei prefecture, with a
depth of 10 km, in which 5,831 people from 1,662 households were affected,
4,052 houses were damaged, 3 bridges were damaged, 17 culverts were damaged,
and drainage, heating and roads were damaged to varying degrees. On August 15,
2022, a 4.7 magnitude earthquake occurred in Qilian county, Haibei prefecture,
Qinghai, with a depth of 8 km, and some houses and ecological environment were
damaged to different degrees, where about 95% of the casualties in earthquakes
are caused by building damage and collapse[2].
The total area of Haibei prefecture is
34,068.44 km2, with a population of 265,300 people, the highest
altitude is 5,287 m, the lowest altitude is 2,180 m, and the altitude of more
than 3,000 m accounts for 85% of the state.There are river valleys, basins,
hills, etc. The ecological environment of the region is relatively fragile. In
2017, the state established the Qilian Mountain National Park in Haibei prefecture,
as one of the ten pilot national parks in China, which is of great significance
for the regional ecological security barrier and water connotation, and can
better protect the biodiversity and natural ecological environment of the
Qilian Mountain region.
This paper obtains the spatial distribution
of building contours and building footprint in the study area by using AI Earth
platform and remote sensing images with high accuracy resolution, which
requires high quality of remote sensing images in data processing and has time
limitation in platform computing. Buildings, as one of the most important
substrates of disaster-bearing bodies, are also important basic data for urban
refinement management[3]. An accurate understanding of the spatial
distribution of buildings is important for later exploring the social
development, earthquake emergency response, disaster prevention and mitigation,
and disaster assessment of the region.
2 Metadata of the Dataset
The
metadata of the Spatial distribution dataset of buildings
in Haibei, Qinghai of China (2020)[4]
is summarized in Table 1.
3 Methods
3.1 Study Area and Data Sources
The study area of this paper is the Tibetan autonomous
prefecture of Haibei prefecture, Qinghai province, which includes four
counties, i.e., Menyuan, Qilian, Haiyan and Gangcha counties. It is located in
the northeastern part (36??44??00??N?C39??05??18??N, 98??5??00??E?C102??41??03??E) of the
Qinghai-Tibet Plateau and the western edge of the Loess Plateau and belongs to
the continental climate of the plateau. Among them, Mengyuan
Table 1 Metadata summary of the Spatial distribution
dataset of buildings in Haibei, Qinghai of China (2020)
|
Items
|
Description
|
|
Dataset full name
|
Spatial
distribution dataset of buildings in Haibei, Qinghai of China (2020)
|
|
Dataset short
name
|
BuildingHaibeiQinghai
|
|
Authors
|
Ma, M. F., Qinghai Normal University, 841880419@qq.com
Liu, F. G., Qinghai Normal University, lfg_918@163.com
Zhou, Q., Qinghai Normal University, 598416603@qq.com
Che, Q., Qinghai Normal University, 872636400@qq.com
Gao, Y., Qinghai Normal University, 2480216410@qq.com
MA, X. Y., Hualong Qunke New Area Middle School, 935558381@qq.com
Chen,Y. M., Qinghai Normal University, 15643198582@qq.com
Gao, H. X., Qinghai Normal University, 3506422405@qq.com
Ding, Y. H., Qinghai Normal University, 905087165@qq.com
|
|
Geographical region
|
Haibei prefecture,
Qinghai province
|
|
Year
|
2020
|
|
Data format
|
.shp
|
|
|
|
Spatial
resolution
|
10 m
|
|
|
|
Data size
|
3.55 MB (After
compression)
|
|
|
|
Data files
|
.shp
|
|
Foundation
|
Ministry of
Science and Technology of P. R. China (2019QZKK0906)
|
|
Data publisher
|
Global Change Research Data Publishing & Repository,
http://www.geodoi.ac.cn
|
|
Address
|
No. 11A, Datun
Road, Chaoyang District, Beijing 100101, China
|
|
Data sharing
policy
|
Data from
the Global Change Research Data Publishing & Repository includes metadata, datasets
(in the Digital Journal of Global Change Data Repository), and
publications (in the Journal of Global Change Data & Discovery). Data sharing policy
includes: (1) Data are openly available and can be free downloaded via the
Internet; (2) End users are encouraged to use Data subject to
citation; (3) Users, who are by definition also value-added service
providers, are welcome to redistribute Data subject to written permission
from the GCdataPR Editorial Office and the issuance of a Data redistribution
license; and (4) If Data are used to compile new
datasets, the ??ten per cent principal?? should be followed such that Data
records utilized should not surpass 10% of the new dataset contents, while
sources should be clearly noted in suitable places in the new datase[5]
|
|
Communication and searchable system
|
DOI, CSTR, Crossref, DCI, CSCD, CNKI,
SciEngine, WDS/ISC, GEOSS
|
county has
experienced more frequent large earthquakes in recent years.
For the data, the 10-m resolution land use
data was obtained from ESA, and the 0.6-m high resolution remote sensing image
in July 2020 was obtained from Shuijingjing software platform, based on the
data obtained from AI Earth platform and ArcGIS 10.7 software of AliCloud.
3.2 Technical Route
The technical route
of this study consists of four parts: downloading remote sensing image data,
data processing, importing into the platform and spatialization of buildings
(Figure 1). Firstly, downloading the 0.6-m high precision remote sensing impact
data of 2020 (selected to minimize clouds and fog, etc.) and the 10-m land use
data of ESA 2020. Secondly, the downloaded data are processed and the regional
construction land use data are obtained through the land use data, and then the
processed data are typed into the platform for extraction. Finally, the spatial
distribution dataset of buildings in Haibei prefecture is obtained by
processing with ArcGIS 10.7 software.
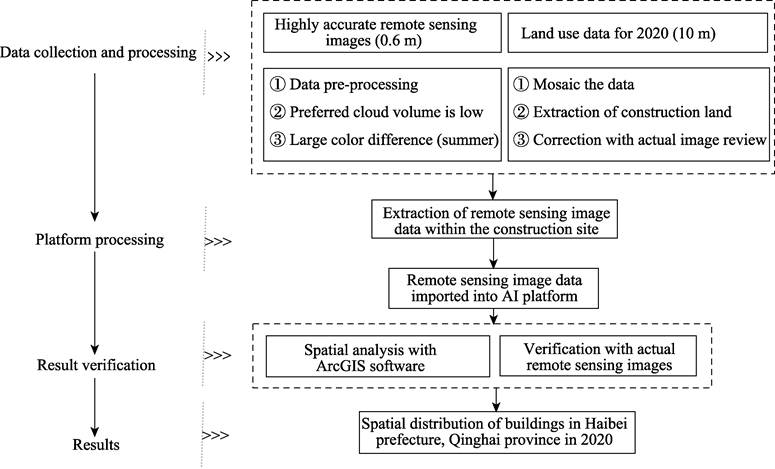
Figure
1 Technicalogy
roadmap of the dataset development
4 Data Results and Validation
4.1 Data Results
The dataset of
Haibei prefecture includes four counties of Haibei prefecture, including
Menyuan county, Qilian county, Gangcha county and Haiyan county, etc. This data
is dated July 2020, and the distribution area of the building distribution data
is urban and rural in the study area, and the final result shipment file format
(Figure 2).
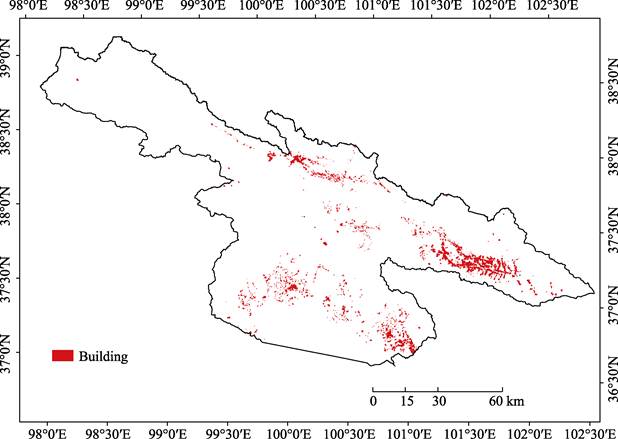
Figure 2 Spatial distribution map of
buildings in Haibei prefecture, Qinghai province
The
distribution of buildings in Haibei prefecture generally shows the spatial
characteristics of dense east and sparse west, dense
south and sparse north. Among the four counties in Haibei prefecture, Mengyuan county
has the largest number of buildings, accounting for 55% of the total regional
buildings, followed by Qilian county with 18.5%, Haiyan county with 15%, and
Gangcha county with 11.5%. Population distribution Mengyuan county accounts for
52.3% of the state, followed by Qilian county with 18.3%, Haiyan county with
15.3% and Gangcha county with 14.1%, the number of buildings is basically the
same compared to the data of the 7th census. The largest area is Qilian county,
accounting for 40.6% of the state??s land and only 18.3% of the population, due
to Qilian county is mainly pastoralism, grass hills cover a large area and the
establishment of the Qilian Mountains National Park, in order to ecological and
biodiversity conservation, to limit human activities.
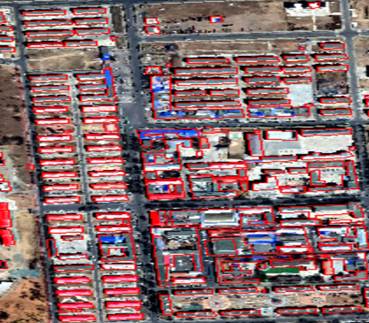
4.2 Data Validation
By comparing some
areas arbitrarily selected with the original downloaded 0.6-m high precision
remote sensing images, the accuracy of urban areas can reach more than 90%.
Residential neighborhoods and office buildings in the city can be well
identified, mainly because of the large building spacing and regular shape
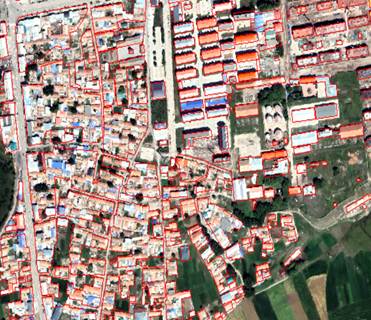
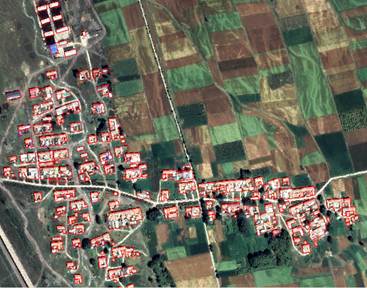
(Figure 3), while the identification is generally poor for irregular or
obsolete houses in the city or in the suburbs (Figure 4). The accuracy of the
rural area can reach 85%, for the agricultural area, mainly the rural areas in
Haibei prefecture of Qinghai province are mainly inhabited by villages, which
are relatively concentrated, which results in a small and irregular shape of
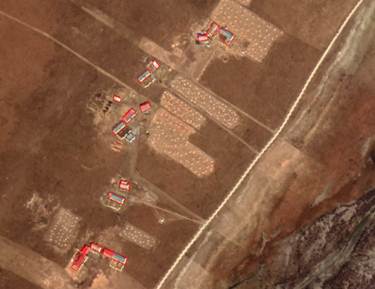
household-to-household spacing and poor recognition (Figure 5). For pastoral
areas, on the other hand, the house buildings are more scattered and each
household is relatively independent, and the buildings are regular in shape and
widely spaced, which are generally better identified but less numerous (Figure
6).
4.3 Exploration
of Preliminary Classification of Building-Related Attributes
After completing
the preparation of spatial distribution data of buildings in Haibei prefecture,
attributes such as spatial location and area (one floor) of buildings were
obtained, while for other attributes such as height, structure type, total
building area and construction year could not be obtained. Therefore, through
my participation in the Qinghai-Tibet second scientific research project, it
was found that the difference between urban and rural buildings in northeastern
Qinghai is obvious. In terms of height, rural areas are generally dominated by
one story with a height of 3.5 m, while urban areas are generally dominated by
two to five stories, with residential houses mainly dominated by five stories
and stores mainly dominated by three stories with a height of 3 m. In terms of
structure types, buildings before 2010 were mainly brick and mortar, while
buildings after 2010 were mainly frame and rural houses were mainly brick and
mortar. As far as the total building area is concerned, the area of the ground
floor in rural areas is the total building area, while in urban areas the
number of floors is obtained through the height of the storey, and the total
building area can be obtained through the number of floors. The year of
construction is obtained by means of field survey. The relevant attributes can
be obtained by the above methods, but they are more time-consuming and
laborious. In the next step, by means of remote sensing, combined with GDP,
population and other data, we can try to get the height, structure type, area,
construction age and other attributes of buildings, which can provide strong
support for regional rescue and disaster relief and disaster damage assessment.
|
|
|
|
Figure 3 Image comparison of urban building
profiles
|
Figure 4 Image comparison of building profiles in the suburbs
|
|
|
|
|
Figure 5 Image comparison of rural building
contours
|
Figure 6 Image comparison of building outlines in
pastoral areas
|
5 Discussion and Conclusion
5.1 Discussion
The spatial
distribution of buildings in Haibei prefecture, Qinghai was obtained through
AliCloud??s AI Earth platform and land use data. However, in the process of data
production, high-precision remote sensing images are required and the platform
import requires data less than 5G, so the data production process takes a long
time. Meanwhile, after this application of land use data, the effect is
relatively good and can reduce the size of remote sensing images. However,
after extracting the buildings within the counties of Haibei prefecture, it is
found that the buildings are much dense in rural gathering areas or urban
suburbs, and there are contiguous buildings, which makes it necessary to
manually review and correct the data subsequently, so as to improve the
accuracy of the data.
5.2 Conclusion
Through this
method, the spatial data of buildings in each county of Qinghai Haibei prefecture
in 2020 was obtained. When natural disasters such as earthquakes, floods and
mudslides occur, the data accuracy is relatively good for buildings in the
city, which can be used for reference, and the buildings in the suburbs are
relatively poor, which can reflect the number of dwellings and other related
information through the density as well. The accuracy of rural areas is
relatively low, where the accuracy of pastoral areas is high, then it can be
used, while agricultural areas can be used due to poor centralized
identification, which can be reflected by density and other methods. This
dataset provides basic data for the local government??s timely emergency plan,
and at the same time, the building, as one of the most important
disaster-bearing base, can improve help for subsequent disaster damage
assessment, prevention and mitigation in a timely and accurate manner.
Author Contributions
Liu,
F. G., Zhou, Q. designed the algorithms of dataset. Ma, M. F. collected and
processed the remote sensing image data; Ma, M. F., Chen, Y. M., Gao, H. X.,
and Ding, Y. H. collected and compared the methods; Chen, Q. and Gao, Y. did
the data validation; Ma, M. F., and Ma, X. Y. wrote the data paper, etc.
Conflicts of Interest
The
authors declare no conflicts of interest.
References
[1]
Hu, S. K., Shi, P. J. Spatial
and temporal characteristics of global land-based destructive earthquakes in
terms of human casualties and their contribution rates from 1970?C2019 [J]. Disaster Science, 2021, 36(4): 163?C167,
174.
[2]
Sun, B. T., Zhang, G. X. Study
on the distribution of seismic hazard risk of buildings in mainland China [J]. Journal of Civil Engineering, 2017,
50(9): 1?C7.
[3]
Liu, Y. F., Lu, B. R., Peng,
L., et al. Training samples dataset
of building identification in urban village [J/DB/OL]. Digital Journal of Global Change Data Repository, 2020. https://doi.org/10.3974/geodb.2020.02.16.V1.
https://cstr.escience.org.cn/CSTR:20146.11.2020.02.16.V1.
[4]
Ma, M. F., Liu, F. G., Zhou,
Q., et al. Spatial distribution
dataset of buildings in Haibei prefecture, Qinghai province (2020) [J/DB/OL]. Digital Journal of Global Change Data
Repository, 2022. https://doi.org/ 10.3974/geodb.2022.22.01.V1.
https://cstr.escience.org.cn/CSTR:20146.11.2022.11.01.V1.
[5]
GCdataPR Editorial
Office. GCdataPR data sharing policy [OL].
https://doi.org/10.3974/dp.policy.2014.05 (Updated 2017).