Methods and Results of
Identifying a Road Material Dataset from GF?C6 Remote Sensing Data in the
Langfang Area
Cui, Y. P.
China Highway Engineering
Consulting Group Co., Ltd., Beijing 100097
Abstract:
Based on high-resolution remote
sensing techniques, the spectral characteristics of different road materials
are compared, and a road material recognition experimental dataset is developed
using machine learning technology. The experimental dataset consists of three
parts: (1) a remote sensing image dataset, including GF-6 WFV and GF-2 data;
(2) a spectral characteristic index dataset, including a spectral difference
index dataset, spectral ratio index dataset, spectral variance index dataset
and a spectral normalization index dataset; (3) a sample dataset which includes
collected road material type samples based on Google Image and Baidu street
view data. In the road material recognition result dataset, the road material
recognition accuracy reaches 80.07%, and the kappa coefficient is 0.70,
reaching acceptable accuracy requirements.
Keywords: Road
material; Machine learning; High-resolution remote sensing
DOI: https://doi.org/10.3974/geodp.2022.04.12
CSTR: https://cstr.escience.org.cn/CSTR:20146.14.2022.04.12
Dataset Availability Statement:
The dataset supporting this paper
was published and is accessible through the Digital Journal of Global Change Data Repository
at: https://doi.org/10.3974/geodb.2022.08.10.V1
or https://cstr.escience.org.cn/CSTR:20146.11.2022.08.10.V1.
1 Introduction
Under the strategical guidance of a country
with a strong transportation sector, China has vigorously promoted the
development of transportation and accelerated the formation of a comprehensive
three-dimensional transportation network. Under the current situation of rapid
development of transportation, the traditional means of technology can no
longer meet the current needs[1]. Information technology represents
an effective means to meet the intelligent and scientific decision-making and
management needs of the transportation industry. Improving the digitalization
of the transportation industry is also an important way to develop
transportation in the new era.
The rapid development of high-definition
remote sensing technology and its increasingly prominent technical advantages
have led to the rapid expansion and deepening of its applications worldwide,
with increasingly obvious application benefits. Currently, remote sensing
technology is widely used in many fields, such as agriculture, forestry,
geology, geography, oceanography, hydrology, meteorology, mapping,
environmental protection, and military reconnaissance. Under the wave of
digitalization sweeping the world, the ??Outline of Planning for National
Comprehensive Three-Dimensional Transportation Network?? issued by the Central Committee
and the State Council has even proposed ??promoting the application of satellite
communication technology, new generation communication technology,
high-definition remote sensing satellite and artificial intelligence in the
industry??. High-definition remote sensing technology provides an opportunity
for the digital transformation of the transport industry. Because of its
advantages of high timeliness, wide coverage, and high spatial resolution,
high-definition remote sensing has become an important means of dynamic
information collection in the transport industry, playing an important role in
the whole life cycle of transport planning, survey, construction, operation,
maintenance, disaster prevention and mitigation, and providing technical
support to improve the level of information associated with the transport
industry. It has played an important role in the whole life cycle of transport
planning, survey, construction, operation, maintenance, disaster prevention,
and mitigation, and has also provided technical support to improve the level of
information technology in the transport industry[2].
As the most common and widely used mode of
transportation[3], road analysis is important for grasping the
different road compositions and distribution in a region. Currently, the types
of road surfaces in China are mainly divided into asphalt concrete pavement,
cement concrete pavement, asphalt through pavement (or asphalt gravel
pavement), gravel pavement, cement gravel pavement, and earth pavement.
Different road surface materials, such as asphalt, cement, and dirt, reflect
different spectral information. Road surface materials can be identified and
differentiated based on the differences in the spectral, texture, direction,
and brightness information of different road materials on the remote sensing
images. At present, many scholars have carried out relevant research work in
the remote sensing extraction of road pavement materials.
Mintzer et
al. have used remote sensing to detect tarmac conditions and provide data
to support research into urban traffic patterns[4]. Gardner et al. acquired remote sensing images
taken by an airborne visible/infrared imaging spectrometer in California to
achieve the extraction of road surface materials in California[5],
Grote et al. achieved the extraction
of roads using high-precision aerial images, providing an accurate data source
for updating the road database[6]. Suchand et al. extracted traffic roads by applying TerraSAR-X track
interferometry[7]. Buslaev et al.
achieved automatic extraction of road networks by investigating deep learning
algorithms such as convolutional neural networks[8].
Domestic scholars have researched pavement
materials using different types of remote sensing data, such as hyperspectral,
multispectral, and LiDAR. She Yuchen et
al. obtained hyperspectral data of different pavement materials, such as
asphalt road, concrete, bare soil, and grass, using a ground feature
spectrometer, and calculated the spectral mean, first-order differentiation,
second-order differentiation and logarithm after inversion. They compared and
analyzed the spectral characteristic curves of four different materials and
concluded that taking the logarithm after inversion was the most effective
method for identifying the type of road pavement materials[9]. Jin et al. used hyperspectral remote sensing
to analyze the spectral reflection absorption characteristics of pavements in
different spectral bands and studied the spectral response change pattern of
asphalt pavements during the aging process to determine the aging degree of
pavements[10]. Lu, et al.
obtained field observations of hyperspectral data of typical roads such as
cement concrete roads, asphalt roads, brick roads, and dirt roads to study the
best waveband to distinguish between different road types[11]. Zhang
et al. applied the combination of
multispectral and hyperspectral to identify road surface materials[12].
They proceeded to identify the road surface materials of the Beijing-Chengdu
Expressway based on the hyperspectral image of Gaoxin-1, combined with the
hyperspectral data measured in the field[12]. In extracting the
pavement material with high-resolution images, Gao et al. avoided the influence of building shadows and low vegetation
groups by using airborne LiDAR data[13].
The structural elements of the road surface are
important factors for interpreting the road grade and are of great significance
for grasping the composition and distribution of different roads in the region[14].
With the construction and development of ??four good rural roads??, ??precise
poverty alleviation??, and the three-year action plan for poverty alleviation in
transportation, the extraction of road surface types has become an
indispensable step[15]. Timely, objective, accurate, and
comprehensive data on rural road surface structural elements can be used to
provide objective data support for road planning, which is of great
significance. Using the new spectral information of the yellow-light band of
the Gaofen-6 satellite and the high-resolution characteristics of the Gaofen-2
satellite, different material compositions of rural road surfaces (such as dirt
roads) can be identified, forming a complete dataset that can be used in the
identification and collection of road surface information. This study develops
a method for producing road material identification datasets based on the
characteristics of the HRS technology and validates the accuracy of the results
to form a complete set of datasets to support road planning.
2 Metadata of
the Dataset
The metadata of the Experimental
dataset of identifying road material using GF-6 images[16] is summarized in Table 1. It includes the dataset full
name, short name, authors, year of the dataset, temporal resolution, spatial
resolution, data format, data size, data files, data publisher, and data
sharing policy, etc.
3 Data
Sources and Production
The remote sensing data
include GF-6 WFV data, GF-2 data, Google images, and Baidu Street view data.
The GF-6 WFV and GF-2 data were obtained from the China Resources Satellite
Application Centre[18] and mainly used for the identification of
road surface material types. Google images and Baidu Street View data were used
to collect road material type samples. The satellite parameters of GF-6 and
GF-2 data are shown in Table 2.
3.1 Remote Sensing Image
Pre-processing
When imaging remote sensing images,
there is a certain amount of geometric distortion, atmospheric extinction, and
distortion of radiation levels that occur for various reasons. These geometric
and radiation-level distortions can affect the identification of road surface
materials. The acquired HMS-2 and HMS-6 data are preliminary L1-level products
and require pre-processing sessions to correct distortions, blurring, and noise
generation during the image acquisition process. The pre-processing process
includes geometric alignment, orthorectification, atmospheric correction,
radiometric correction, etc. After pre-processing, the images can meet the
needs of road material identification. The steps for pre-processing remote
sensing images are already very mature technologies and will not be repeated in
this paper.
3.2 Image Fusion Processing Based On Spectral Unmixing
In this paper, we
use the data taken by the multi-spectral medium-resolution Wide Field
Table 1 Metadata summary of the Experimental
dataset of identifying road material using GF-6 images
|
Items
|
Description
|
|
Dataset full name
|
Experimental
dataset of identifying road material using GF-6 images
|
|
Dataset short
name
|
GF_RoadMaterial
|
|
Author
|
Cui, Y. P.
EVU-6053-2022, China Highway Engineering Consulting Group Co., Ltd.,
songzl0906@163.com
|
|
Geographical
region
|
Langfang city,
Hebei province
|
|
Year
|
2020
|
|
Spatial resolution
|
0.8 m
|
|
Data format
|
.dat, .shp, .xlsx, .tif
|
|
Data size
|
3.69 GB (1.62 GB after
compression)
|
|
Dataset composition
|
Remote sensing
image data, spectral feature index data, sample data, and road material
identification result data
|
|
Foundations
|
GF-6 (07-Y30B03-9001-19/21,
87-Y50G28-9001-22/23)
|
|
Data
publisher
|
Global Change Research Data Publishing & Repository,
http://www.geodoi.ac.cn
|
|
Address
|
No.
11A, Datun Road, Chaoyang District, Beijing 100101, China
|
|
Data
sharing policy
|
Data from the Global Change Research Data
Publishing & Repository includes metadata, datasets (in the Digital Journal of Global
Change Data Repository), and publications (in the Journal of Global
Change Data & Discovery).
Data sharing
policy includes: (1) Data are openly available and can
be free downloaded via the Internet; (2) End users are encouraged to use Data
subject to citation; (3) Users, who are by definition also value-added
service providers, are welcome to redistribute Data subject to written
permission from the GCdataPR Editorial Office and the issuance of a Data
redistribution license; and (4) If Data are used to compile new
datasets, the ??ten per cent principal?? should be followed such that Data
records utilized should not surpass 10% of the new dataset contents, while
sources should be clearly noted in suitable places in the new dataset[17]
|
|
Communication and searchable system
|
DOI, CSTR, Crossref, DCI, CSCD, CNKI, SciEngine, WDS/ISC, GEOSS
|
Table 2 Parameters of GF-6 and GF-2 satellite
|
Satellite
Parameters
|
GF-6
|
GF-2
|
|
High resolution cameras (PMS)
|
Wide format cameras (WFV)
|
High resolution cameras (PMS)
|
|
Spectral range
|
Panchromatic
|
0.45-0.90 ??m
|
??
|
??
|
Panchromatic
|
0.45-0.90 ??m
|
|
B1 (Blue Band)
|
0.45-0.52 ??m
|
B1 (Blue Band)
|
0.45-0.52 ??m
|
B1 (Blue Band)
|
0.45-0.52 ??m
|
|
B2 (Green Band)
|
0.52-0.60 ??m
|
B2 (Green Band)
|
0.52-0.60 ??m
|
B2 (Green Band)
|
0.52-0.59 ??m
|
|
B3 (Red Band)
|
0.63-0.69 ??m
|
B3 (Red Band)
|
0.63-0.69 ??m
|
B3 (Red Band)
|
0.63-0.69 ??m
|
|
B4 (Near Infrared)
|
0.76-0.90 ??m
|
B4 (Near Infrared)
|
0.76-0.90 ??m
|
B4 (Near Infrared)
|
0.77-0.89 ??m
|
|
??
|
??
|
B5 (Red edgeI)
|
0.69-0.73 ??m
|
??
|
??
|
|
??
|
??
|
B6 (Red edgeII)
|
0.73-0.77 ??m
|
??
|
??
|
|
??
|
??
|
B7 (Purple Band)
|
0.40-0.45 ??m
|
??
|
??
|
|
??
|
??
|
B8 (Yellow Band)
|
0.59-0.63 ??m
|
??
|
??
|
|
Resolution
|
Panchromatic
|
2 m
|
Panchromatic
|
/
|
Panchromatic
|
1 m
|
|
Multispectral
|
8 m
|
Multispectral
|
??16 m
|
Multispectral
|
4 m
|
|
Width
|
??90 km
|
??800 km
|
45 km
|
Camera (WFV) with a resolution of 16 m for the HMS-6 remote sensing
satellite data and a spatial resolution of 0.8 m for the HMS-2 remote sensing
satellite image data. As the roads are linear in length, this paper uses the
spectral unmixing method to fuse the HMS-6 and HMS-2 images, which improves the
spatial resolution of the images while retaining the features of the eight
bands of HMS-6. The basic principle of image fusion by spectral unmixing is
described by the following method: first, the GF-6 multi-spectral data and the
high-resolution GF-2 panchromatic data are unmixed to obtain the multispectral
image spectral basis matrix, then the multi-spectral image spatial coefficient
matrix, the panchromatic image spectral basis matrix, and the panchromatic
image coefficient matrix, and then the 1-m
resolution 8-band image is obtained by multiplying the optimally solved
multi-spectral image spectral basis matrix with the panchromatic image
coefficient matrix. The fused data were obtained by multiplying the optimally
solved multi-spectral image spectral basis matrix with the panchromatic image
coefficient matrix. In this paper, we refer to the spectral unmixing method of
Zhang et al.[19] and do
not repeat the detailed procedure.
4 Method of
Producing Road Material Datasets
4.1 Study Area
An area in the eastern part of Langfang city
was chosen as the test bed for the study area (Figure 1), which has a full
range of traffic road types and basically has complete coverage by Baidu Street
View data. Langfang is located in the central-eastern part of Hebei province, bordering
Beijing to the north, Tianjin to the east, Cangzhou to the south, and Baoding
to the west, with a total area of 6,429 km2. Langfang is located in
the core hinterland of the ??Golden Triangle?? of Beijing, Tianjin, and Xiong??an
New Area, and is an important node city in the world-class city cluster with
Beijing as the core. By the end of 2021, Langfang had 857 km of national roads,
497 km of provincial roads, 778 km of county roads, 1,793 km of township roads,
42 km of special roads, and 7,489 km of village roads. The total mileage of
roads in the city is 11,460,000 km, and the road density is 178 km/100 km2,
ranking first in the province.

Figure 1 Maps of location of the experimental area
4.2 Technical Routes
The BP neural network regression is used to
predict the importance of each index band on the identification of road surface
material type, and the SVM classification filters the best combination of
bands. This approach is based on GF-6 WFV data and GF-2 data fusion to obtain
high-resolution data containing eight bands, combined with the calculated four
road spectral indices and first-order spectral derivatives using the
road-material type sample dataset obtained from Baidu Street View. In this way,
the road surface material types were identified as illustrated by the technical
route shown in Figure 2.
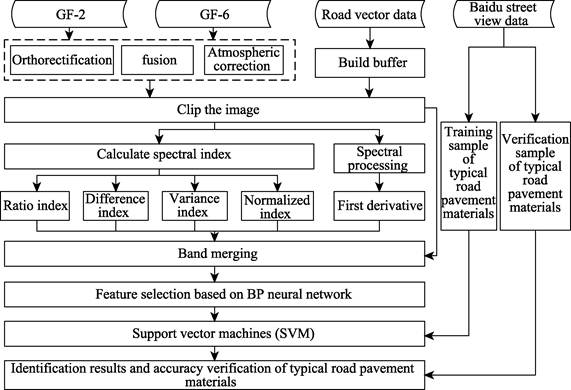
Figure 2 Technical
flowchart of dataset development
4.3 Principles of Road Material Dataset Production
4.3.1 Spectral Characteristic Index Calculation
According
to previous research, the spectral feature index of pavement is involved in the
pavement material identification as a band, which can enhance the spectral
characteristics of roads with different material types[20] and help
improve the accuracy of identification results. In this paper, different
spectral feature indices are constructed using the operation of the
near-infrared band and blue light band, and the difference between their
reflectances can serve as a basis to construct the spectral difference index
(Equation 1), the ratio of the reflectance of the two constructs the spectral
ratio index (Equation 2), the variance of the ratio of the reflectance of the
two constructs the spectral variance index (Equation 3), and the normalized
value of the reflectance of the two constructs the spectral normalized index
(Equation 4).
 (1)
(1)
 (2)
(2)
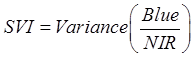 (3)
(3)
 (4)
(4)
4.3.2 Optimal Waveband Selection Based on BP Neural
Networks
After
obtaining the spectral feature indices, the first-order derivatives of each
band in the original image were calculated, and a total of 20 bands of data
were obtained by band merging with eight bands of the remote sensing image. The
samples of asphalt roads, concrete roads, and dirt roads are selected from
Baidu Street View by visual inspection, and then the spectral feature
information of the samples is obtained from the merged image data. To improve
the accuracy of road material recognition, it is necessary to rank the
importance of numerous bands and select the best band to distinguish road
material recognition. In this paper, the BP neural network (Back-ProPagation
Network) can be used for data prediction and classification[20], is
applied to select the best band. The wavebands with relatively high
contributions can be included in the best combination of wavebands for road
material identification.
4.3.3 Support Vector Machines
After the optimal band selection was completed for the images, the
images were classified according to the samples of different materials to
obtain classification results for asphalt roads, concrete roads, and dirt
roads. The classification method chosen in this paper uses a Support Vector
Machine (SVM), which was first proposed by Cortes and Vapnik in 1995 and is a
binary classification model with obvious advantages in solving small sample and
non-linear recognition problems; therefore, an SVM has obvious superiority in
remote sensing image classification. This paper uses the SVM method to achieve
fast recognition of road materials.
4.3.4 Identification of Road Surface Material Types
The SVM approach to remote sensing image classification is oriented
towards the pixel level and the classification results obtained are also in the
form of pixel levels. Therefore, there is fragmentation in the results of
SVM-based road material recognition. In general, a road consists of the same
material, and the fragmentation problem can be solved by the plural. First,
this paper constructs a buffer (three pixels) of the road based on the road
centerline vector data with the intent of avoiding the influence of other
features. The plural of the statistical pavement type is counted for the
identification result; for example, the plural of a road is the attribute value
indicating asphalt road, which means that the road is an asphalt road, and the
statistical plural is the attribute value of the pavement type of the road.
4.4 Dataset Accuracy
Validation Methods
Accuracy verification refers to the
comparison of the results of remote sensing image recognition with the actual
results to determine the accuracy of the recognition process. The common
accuracy evaluation method is the confusion matrix (also known as error
matrix), which calculates the recognition accuracy in the form of an n-row and
n-column matrix, which mainly include: precision, recall, overall accuracy, and
the kappa coefficient.
The relationship between the hypothetical
identification results and the true results is shown in Table 3.
Table 3 Hypothetical relationship between
identification results and real results
|
Hypothetical
relationship
|
Forecast-positive example
|
Forecast-negative example
|
|
Real-positive example
|
TP-true example
|
FN-false counterexample
|
|
Real-counter examples
|
FP-false positive example
|
TN-true counterexample
|
(1) Precision: the number of correctly
classified positive samples as a proportion of the number of all positive
samples classified by the classifier.
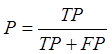 (5)
(5)
(2) Recall: the number of correctly
classified positive samples as a proportion of the number of all positive
samples classified by the classifier.
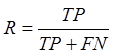 (6)
(6)
(3) Overall Accuracy: the number of correctly
classified samples as a proportion of the number of all samples.
 (7)
(7)
4) Kappa coefficient: indicates the
proportion of the evaluated classification that produces fewer errors than a
completely random classification.
 (8)
(8)
where
TP denotes positive samples correctly classified by the model; FN denotes positive samples incorrectly
classified by the model; FP denotes
negative samples incorrectly classified by the model; TN denotes negative
samples correctly classified by the model;  denotes the total number of samples; xii
denotes the values in row i and
column i (main diagonal); r denotes the number of rows in the
error matrix; xi+ and x+i
denote the sum of row i and column i, respectively.
denotes the total number of samples; xii
denotes the values in row i and
column i (main diagonal); r denotes the number of rows in the
error matrix; xi+ and x+i
denote the sum of row i and column i, respectively.
5 Data Results and Validation
5.1 Dataset Composition
The dataset consists of four folders.
(1) Remote sensing image dataset: including
the GF-6 Wide Format (WFV) and GF-2 remote sensing image data for the study
area.
(2) Spectral feature index dataset: including
the spectral difference index dataset, spectral ratio index dataset, spectral
variance index dataset, and spectral normalized index dataset.
(3) Sample dataset: based on Google images
and Baidu Street View data to collect samples of road material types.
(4) Road material recognition result dataset.
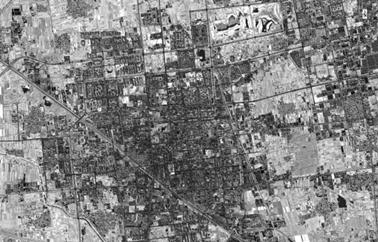
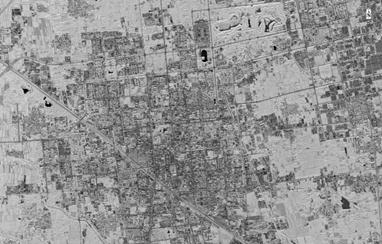
5.2 Data Results
(1) Data Fusion Results
The GF-6 WFV data has a resolution of better
than 16 m, which is relatively coarse and cannot be directly used for
road surface type identification. The experiment fused the GF-6 WFV data with
the contemporaneous GF-2 data by the GS fusion method (Definition needed) to
obtain high-resolution fused data (as shown in Figure 3). Before fusion, the
GF-6 WFV and GF-2 data were pre-processed with radiometric correction, atmospheric
correction, and orthorectification correction to remove the influence of the
atmosphere and cloud interference so that the fused data could effectively indicate the reflectance of the surface. The fused data consists of eight bands
with a resolution of 1 m. This ensures the high spatial resolution of the data
but also adds two red-edge bands, a violet band, and a yellow band, which
allows the recognition of road surface materials with clear road texture and
good visual effects.
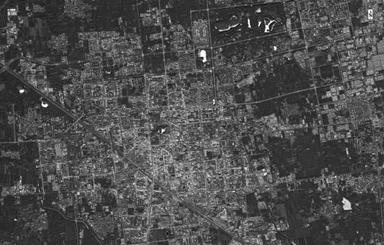
(2) Spectral index results
The spectral index formula was used to obtain
spectral feature maps for the spectral difference index, spectral ratio index,
spectral variance index, and spectral normalization index (Figure 4). The four
types of spectral index feature maps are calculated based on the blue and
near-infrared bands to enhance the spectral characteristics of different
material types of roads, while the index calculation eliminates the variation
in the images themselves and systematic errors. The addition of spectral indices
can complement the spectral features of the original data and improve the
accuracy of road surface type identification. It is important to note that in
the calculation of the ratio index, there are cases where the inverse color
ratio in the NIR band is 0. In this case, the ratio index is set to a special
value of 9,999 for the region where this condition is met.
|
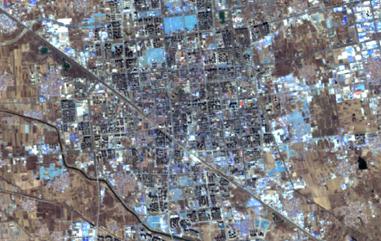
|
|
|
(a) Image before fusion
|
(b) Image after fusion
|
Figure 3 GF-6 WFV satellite images before and
after fusion
|
|
|
|
(a) Spectral difference index
|
(b)
Spectral
ratio index
|
|
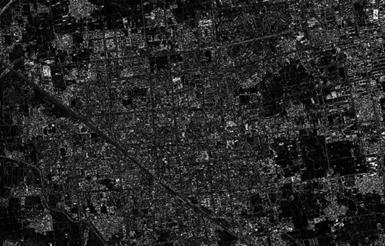
|
|
|
(c) Spectral Variance
Index
|
(d) Spectral Normalized Index
|
Figure 4 The
spectral indexes of road material
(3) Band feature selection
The experiments used the BP neural network
model, combined with the acquired road pavement type sample data, to establish
a band importance (contribution) model that can easily distinguish between
pavement material types. The model results are shown in Figure 5. As can be
seen from the figure, there are a total of 20 bands involved in the whole
model, of which 8 bands consist of the original data, 4 bands of the spectral
index and 8 bands of the first-order derivatives of the original data (where
Red_deriv represents the red band derivatives, NIR_deriv represents the NIR
band derivatives, SNI represents the normalized spectral index, SRI represents
the ratio spectral index, Red_edge2 _deriv stands for the red edge II band
derivative, NIR stands for the near-infrared band, Red_edge1_deriv stands for
red edge I band derivative, Red_edge2 stands for red edge II band, Red stands
for the red band, Purple stands for the purple band, Red_edge1 stands for the
red edge I band, Blue stands for the blue band, Yellow stands for the yellow
band, Blue_deriv for the blue band derivative, Yellow_deriv for the yellow band
derivative, Green for the green band, Purple_deriv for the purple band
derivative, Var for the variance spectral index, Green_deriv for the green band
derivative, and SDI for difference spectral index). The bands were ranked
according to the importance of participation, and the top six accounted for
more than 5% of feature importance. The accuracy of the model was calculated by
adding the bands one by one according to feature importance, and it was found
that the accuracy of the model was highest when the eight band was added, so
the experiment used the top eight bands with larger importance values for road
pavement type identification, which include: the red band derivative,
near-infrared band derivative, normalized spectral index, the ratio spectral
index, the red edge II band derivative, the NIR representing the NIR band, the
derivative of the red edge I band, and the red edge II band.
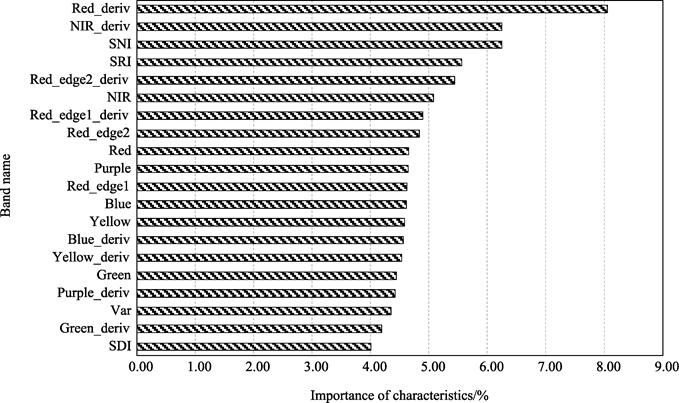
Figure
5 Importance
of band features in BP neural network model
(4) Identification results
To improve the recognition accuracy of
road-pavement types, a road buffer zone (5 m) is established based on the road
centerline, and the interference of features outside the buffer zone is
excluded, allowing for the recognition of road-pavement material types to be carried
out only within the road buffer zone. Based on the visually acquired sample
data of concrete roads, asphalt roads, and dirt roads, the SVM method is
facilitated to identify the road-pavement types. The road-pavement type
extraction results and the actual results are shown in Figure 6. In the study
area, the asphalt road pavement is wider and has the best extraction results
with stronger road connectivity; the concrete and dirt road pavements are
narrower, and the extracted pavement type connectivity is weaker, and the
surrounding features will also have some influence on the road-pavement type
identification.
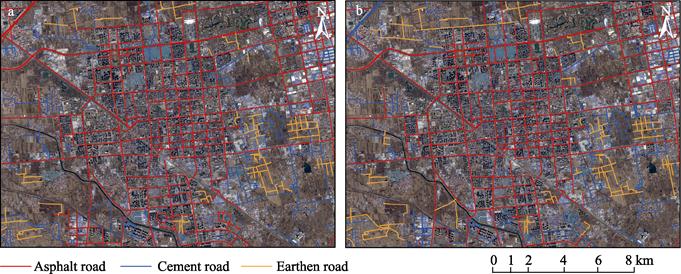
(a) Real results
(b) Recognition results
Figure 6 Comparison images of road material between recognition results and real
results
5.3 Data Validation Applications
In the results of road-pavement material
identification based on GF-6 WFV and GF-2 fusion data, a total of 271 roads
were selected in the study area, and information on each road-pavement material
type was obtained through visual interpretation, i.e., pavement material type
verification samples. A confusion matrix was used to validate the experimental
results, as shown in Table 4. The overall accuracy of the road-pavement
material type recognition results was 80.07%, with a kappa coefficient of 0.70.
In terms of overall road-pavement recognition accuracy, the highest accuracy
rate (92.65%) was achieved for asphalt road-pavement type recognition, and the
lowest accuracy rate (75.00%) was achieved for cement road-pavement type
recognition; the highest recall rate (79.65%) was achieved for cement
road-pavement type recognition, and the lowest recall rate (75.00%) was
achieved for asphalt road-pavement type identification. The overall
road-pavement type identification results are more accurate, the precision
meets certain requirements, and the method can be used for a wide range of
road-pavement material type identification work.
Table 4 The results of precision validation
|
Roads (stripes)
|
Identification results
|
Recall rate (R)
|
|
Asphalt roads
|
Concrete roads
|
Dirt roads
|
Total
|
|
Actual results
|
Asphalt roads
|
63
|
20
|
1
|
84
|
75.00%
|
|
Concrete roads
|
5
|
90
|
18
|
113
|
79.65%
|
|
Dirt roads
|
0
|
10
|
64
|
74
|
77.11%
|
|
Total
|
68
|
120
|
83
|
271
|
|
|
Accuracy (P)
|
92.65%
|
75.00%
|
86.49%
|
|
|
|
Overall accuracy OA = 80.07%
|
|
Kappa factor: 0.70
|
6 Discussion and Conclusion
Based on GF-6 WFV and GF-2 data, a
high-resolution dataset (0.8 m resolution) was obtained by fusing the data
using a GS algorithm. In this way, the spectral difference index, ratio index,
variance index, normalized index, and the first-order derivative of the image
were calculated. The sample dataset of road-pavement material types were
visually interpreted by applying Baidu Street View data, and the importance of
band features was predicted by BP neural network. The optimal band combination
was selected, and the SVM method was used to recognize road-pavement material
types. We arrived at the following conclusions.
(1) The fused data has multi-band
characteristics and high spatial resolution, which meets the recognition of
road-pavement types.
(2) The best waveband combinations based on
the BP neural network are the red band derivative, NIR band derivative,
normalized spectral index, ratio spectral index, red edge II band derivative,
NIR representing the NIR band, derivative of red edge ?? band, and the red edge
?? band, for a total of eight bands.
(3) The overall recognition accuracy of road
pavement material is 80.07%, and the kappa coefficient is 0.70. The dataset
meets acceptable accuracy requirements.
Conflicts of Interest
The authors
declare no conflicts of interest.
References
[1]
Zhang, L. Modern transportation
information network and communication technology [M]. Shanghai: Tongji
University Press, 2007.
[2]
Manzo, C., Mei, A., Salvatori,
R., et al. Spectral modeling used to
identify the aggregates index of asphalted surfaces and sensitivity analysis
[J]. Construction & Building Materials, 2014, 61: 147?C155.
[3]
Fu, C. Opportunities and
challenges of highway survey and design in the era of big data [D]. Xi??an: Chang??an
University, 2016.
[4]
Minter, O. W. Manual of remote
sensing second interpretations and applications [S]. American society of
photogrammetry, Falls Church, VA, 1983, 2: 1955?C2109
[5]
Gardner, M., Roberts, D. A.,
Funk, C., et al. Road extraction from
AVIRIS using spectral mixture and Q-tree filter techniques [C]. Technical
Report, May, 2001. University of California, Santa Barbara, National Consortium
on Remote Sensing and Transportation: Infrastructure, 2001.
[6]
Grote, A., Heipke, C. Road
extraction for update of road databases in suburban areas [J]. Remote Sensing and Spatial Information
Science, 2008, XXXVII-B3b: 563?C568.
[7]
Suchandt, S., Runge, H., Breit,
H., et al. Automatic Extraction of
Traffic Flows Using TerraSAR-X Along-Track Interferometry [J]. IEEE Transactions on Geoscience & Remote
Sensing, 2010, 48(2): 807?C819.
[8]
Buslaev, A., Seferbekov, S.,
Iglovikov, V., et al. Fully
convolutional network for automatic road extraction from satellite imagery [C].
Conference on Computer Vision and Pattern Recognition Workshops (CVPRW). IEEE,
2018.
[9]
She, Y. C., Lin, F., Sun, H.
Hyperspectral characterization of major road pavement materials [J]. Journal of Central South University of
Forestry Science and Technology, 2014, 34(11): 120?C139.
[10]
Jin, X., Zhang, X. F., Luo, L.,
et al. A preliminary investigation on
the spectral feature analysis of highway pavement and remote sensing monitoring
method of asphalt pavement deterioration [J].
Journal of Geoinformation Science, 2017, 19(5): 672?C681.
[11]
Lu, P. P., Dai, J. G., Shi, X.
Z. Analysis of spectral features of four typical roads based on hyperspectral
remote sensing [J]. Mapping and Spatial
Geographic Information, 2019, 42(5): 141?C144.
[12]
Zhang, Y. X., Xu, W., Wang, Y.,
et al. Discriminative analysis of
pavement materials based on spectral features [J]. Journal of Changsha University of Technology (Natural Science Edition), 2017, 14(4): 1?C9.
[13]
Gao, L. P. Research on road
extraction based on airborne LiDAR and high-resolution remote sensing images [D].
Xuzhou: China University of Mining and Technology, 2014.
[14]
Zhang, X. B., Cheng, R. S.,
Wang, L. J. Investigation and analysis of the current situation of asphalt
pavement thickness of highways in China [J].
Henan Transportation Science and Technology, 1999(1): 3?C5.
[15]
Li, X. P. Make up for shortcomings
to build ??four good rural roads?? [J]. China
Road, 2017(17): 20?C25.
[16]
Cui, Y. P. Experimental dataset
of identifying road material using GF-6 images [J/DB/OL]. Digital Journal of Global Change Data Repository, 2022. https://doi.org/10.3974/geodb.2022.08.10.V1.
https://cstr.escience.org.cn/CSTR:20146.11.2022.08.10.V1.
[17]
GCdataPR Editorial Office.
GCdataPR data sharing policy [OL]. https://doi.org/10.3974/dp.policy.2014.05
(Updated 2017).
[18]
China Resources Satellite
Application Centre. http://www.cresda.com/CN/.
[19]
Zhang, Y. L., Fu, Y. H., Ren, K.,
et al. Fine identification of road material by fusion of multi-source remote
sensing data [J]. Highway, 2021,
66(3): 206?C214.
[20]
Xiao, G. F., Zhang, Y. L., Yang,
X., et al. Identification of typical
road pavement types based on GF-2 remote sensing images [J]. Highway, 2020, 65(10): 8.