Dataset Development on Moisture
Sources of Precipitation in Southern and Northern Qinghai-Xizang Plateau
(1979?C2016)
Zhang,
C.
Key Laboratory of Land
Surface Pattern and Simulation, Institute of Geographic Sciences and Natural
Resources Research, Chinese Academy of Sciences, Beijing
100101, China
Abstract: The
massive topography of the Qinghai-Xizang Plateau not only influences the
climate of Asia and even globally, but also appearances significant climatic
variations within itself: the southern plateau is mainly influenced by
monsoons, forming a warm and humid plateau monsoon climate; while the northern
plateau is primarily affected by westerlies, resulting in a cold and arid
plateau continental climate. To quantify the differences in precipitation
sources between the southern and northern plateau and reveal their distinct
changing characteristics under global warming, the research team used a
numerical model to track the moisture sources for seasonal (May?CSeptember)
and annual precipitation in both the southern (south of 30??N) and northern
(north of 35??N) plateau regions over approximately 40 years. The study used
ERA-Interim reanalysis data, CMA precipitation and GLDAS evaporation as model
drivers, and conducted comparative experiments for validation, ultimately
generating precipitation source data for both the southern and northern plateau
regions annually and during the rainy season. The dataset includes: (1) the
boundaries of southern and northern plateau regions; (2) annual and seasonal
precipitation source data for southern and northern plateau regions from 1979?C2016,
with a spatial resolution of 1??x1??, measured in mm; (3) regional average annual
and seasonal precipitation data for southern and northern plateau regions from
1979?C2016. The dataset is archived in
.nc, .shp, and .xlsx formats, consisting of 17 data files with a total size of
66.4 MB. (compressed into 1 file, 53.7 MB).
Keywords: Qinghai-Xizang Plateau;
climate change; precipitation; moisture source; southern and northern; 1979?C2016
DOI: https://doi.org/10.3974/geodp.2024.03.08
CSTR: https://cstr.escience.org.cn/CSTR:20146.14.2024.03.08
Dataset Availability Statement:
The dataset
supporting this paper was published and is accessible through the Digital Journal of
Global Change Data
Repository at: https://doi.org/10.3974/geodb.2024.08.03.V1 or
https://cstr.escience.org.cn/CSTR:20146.11.2024.08.03.V1.
1 Introduction
The
Qinghai-Xizang Plateau plays a crucial role in the global climate system, and
its environmental changes have drawn widespread attention from the
international climatology community[1?C3].
Research has shown that while the Qinghai-Xizang Plateau as a whole shows a
wetting trend, precipitation changes display significant regional characteristics[4,5]. There are
notable differences in precipitation changes between the northern and southern Qinghai-Xizang
Plateau, with increased precipitation in the north and decreased precipitation
in the south[1,6]. Yao et al. pointed out that the Northern Qinghai-Xizang
Plateau (NTP, north of 35??N) is mainly influenced by westerlies, while the
Southern Qinghai-Xizang Plateau (STP, south of 30??N) is primarily controlled by
the Indian monsoon[7]. Different
circulation systems bring moisture from various sources to different regions of
the Qinghai-Xizang Plateau, resulting in spatial variations in precipitation.
The contrasting
precipitation trends between STP and NTP may indicate changes in both
circulation patterns and moisture sources. To reveal the causes of these
opposing precipitation changes between the northern and southern plateau, the
authors designed water vapor tracking experiments, using a numerical model to
track the sources for both seasonal (May?CSeptember) and annual precipitation in
the southern and northern plateau from 1979?C2016. This generated nearly 40
years of moisture source data for annual and seasonal precipitation, providing
a solid data foundation for quantifying the precipitation contributions of
plateau circulations, and evaluating north-south differences, interannual fluctuations,
and climate change impacts on circulation patterns.
2 Metadata of the Dataset
The
metadata of Precipitation moisture source simulating dataset on southern and northern
Qinghai-Xizang Plateau[8] is
summarized in Table 1. It includes the dataset full name, short name, authors,
year of the dataset, temporal resolution, spatial resolution, data format, data
size, data files, data publisher, and data sharing policy, etc.
3 Methods
3.1 Data Sources
This
study uses the 0.5?? gridded monthly precipitation data based on ground
observations provided by the China Meteorological Administration (CMA)[10]. This gridded data product is
derived from quality-controlled observational data from approximately 2,400
national stations across China since 1961, using the thin-plate smoothing
spline interpolation method while taking topographic effects into account. The
study utilizes data from 1979?C2016.
The 3-hourly 1??
gridded evaporation data provided by the Community Land Model (CLM) within the
Global Land Data Assimilation System (GLDAS)[11]
is selected for this study. Data from 1996 contains a suspicious anomaly due to
erroneous precipitation[12], and
it is recommended to exclude the evaporation and related simulation results for
1996.
Atmospheric data
is sourced from the European Centre for Medium-Range Weather Forecasts (ECMWF)
reanalysis data ERA-Interim[13],
with a spatial resolution of 1????1??. ERA-Interim provides a series of datasets,
including 6-hourly model-level zonal wind, meridional wind, and specific
humidity; 6-hourly surface pressure and a set of vertically integrated moisture
and flux variables (vertically integrated water, vertically integrated
northward/eastward moisture flux, including water vapor, liquid water, and ice
fluxes); as well as 3-hourly precipitation and evaporation data.
Table 1 Metadata summary of precipitation moisture source simulating dataset
on Southern and Northern Qinghai-Xizang Plateau
|
Items
|
Description
|
|
Dataset full name
|
Precipitation
moisture source simulating dataset on southern and northern Qinghai-Xizang
Plateau
|
|
Dataset short
name
|
MoistureSourceNSPlateau
|
|
Authors
|
Zhang, C., Institute of
Geographic Sciences and Natural Resources Research, Chinese Academy of
Sciences, zhangchi@igsnrr.ac.cn
Tang, Q. H., Institute of Geographic
Sciences and Natural Resources Research, Chinese Academy of Sciences,
tangqh@igsnrr.ac.cn
Huang, J. C., Institute of Geographic
Sciences and Natural Resources Research, Chinese Academy of Sciences,
huangjc@igsnrr.ac.cn
Xu, X. M., Institute of
Geographic Sciences and Natural Resources Research, Chinese Academy of
Sciences, xuxm@igsnrr.ac.cn
Gaffney, P. P. J., Institute
of Geographic Sciences and Natural Resources Research, Chinese Academy of
Sciences, gafppj@igsnrr.ac.cn
Zhou, Y. Y., Institute of
Geographic Sciences and Natural Resources Research, Chinese Academy of
Sciences, zhouyy@igsnrr.ac.cn
|
|
Geographical
region
|
Qinghai-Xizang
Plateau
|
|
Year
|
1979?C2016
|
|
Temporal
resolution
|
Annual, monthly
from May to September
|
|
Spatial
resolution
|
1????1??
|
|
Data format
|
.nc, .xlsx, .shp
|
|
|
|
Data size
|
53.7 MB??after
compression??
|
|
|
|
Data files
|
The geographical extent of
NTP and STP, annual and rainy season monthly precipitation in the NTP and
STP, moisture sources for annual and rainy season monthly precipitation in
the NTP and STP
|
|
Foundations
|
Chinese Academy of Sciences
(XDA2006040202); National Natural Science Foundation of China (U2243226)
|
|
Data publisher
|
Global Change Research Data Publishing & Repository,
http://www.geodoi.ac.cn
|
|
Address
|
No. 11A, Datun
Road, Chaoyang District, Beijing 100101, China
|
|
Data sharing policy
|
(1) Data are openly available and can be free downloaded via the
Internet; (2) End users are encouraged to use Data subject to citation; (3) Users, who are by definition also
value-added service providers, are welcome to redistribute Data subject to written permission
from the GCdataPR Editorial Office and the issuance of a Data redistribution license; and (4) If Data are used to compile new datasets, the ??ten per cent
principal?? should be followed such that Data
records utilized should not surpass 10% of the new dataset contents, while
sources should be clearly noted in suitable places in the new dataset[9]
|
|
Communication and
searchable system
|
DOI,
CSTR, Crossref, DCI, CSCD, CNKI, SciEngine, WDS, GEOSS, PubScholar, CKRSC
|
3.2 Model and Experimental Design
This
study uses the WAM2Layers (Water Accounting Model using 2 layers) model to
track the sources for precipitation over the NTP and STP. WAM2Layers is a
quasi-three- dimensional Eulerian numerical tracking model that represents a
significant improvement over the first-generation model WAM. The model
introduces a layered (two-layer) structure in the vertical direction,
effectively addressing the tracking bias issues caused by vertical wind shear.
This design significantly improves the accuracy and reliability of moisture
tracking, enabling the model to more accurately simulate moisture movement and
distribution in complex atmospheric environments[14,15].
The model??s main equation is based on the atmospheric water balance equation,
as shown in Equation (1):
 (1)
(1)
where
l represents the upper or lower atmospheric layer, ?? represents
moisture from a specific source region, the left side of the equation
represents the temporal change in atmospheric precipitable water (W),
and the right side includes moisture convergence caused by horizontal winds (u,
v), moisture supply from surface evaporation (E), moisture loss
due to precipitation (P), vertical moisture transport between layers (Fv),
and a residual term (??). The model??s water vapor tracking algorithm has
been described in the previous literature[16]
and is therefore omitted here.
This study focuses
on comparing the effects of different surface evaporation (E) and
precipitation (P) fluxes on moisture tracking. Therefore, the team
conducted two sets of experiments using different E and P fluxes.
One set uses observation-based data, specifically CMA precipitation and GLDAS
evaporation. The other set uses ERA-Interim??s E and P, combined
with ERA-Interim atmospheric data, forming a complete ERA-based dataset,
referred to as ERA-Suite, which has a more self-consistent water cycle. The experiment
using ERA-Suite serves as a supplement to compare with the main experiment and
verify the reliability of the results.
3.3 Data Pre-processing
When
using observational precipitation data, the study calibrates the 3-hourly
ERA-Interim precipitation data using CMA monthly precipitation data to preserve
diurnal precipitation variation while ensuring monthly values match the CMA
data. The specific steps are as follows: First, CMA precipitation data is
converted to the same spatial resolution as ERA-Interim by averaging the 0.5??
grids that fall within each 1?? grid. The monthly precipitation from ERA-Interim
is then calculated. Using CMA monthly precipitation as the reference, scaling
factors for ERA-Interim are determined. Subsequently, all 3-hourly ERA-Interim
precipitation data within each month are scaled proportionally.
Since GLDAS
evaporation data only covers land areas, ERA-Interim data is still used for
ocean regions?? evaporation. To ensure numerical stability in the moisture
tracking process, all model input data is discretized to 15-minute time steps.
Data with 6-hour or 3-hour intervals is converted to 15-minute intervals using
either linear interpolation or equal distribution methods.
3.4 Data Post-processing
The
simulation results provide spatiotemporal field data of moisture content from
the specific source region (i.e., tagged water) at 15-minute time steps. Using
the tagged water content variable W??_down
in the lower atmosphere, at any time step, e??r?? of the
evaporation e will ultimately form direct precipitation in the target
area, which can be expressed through Equation (2):
 (2)
(2)
The water vapor
contributions at monthly and regional scales are obtained through temporal
integration and areal integration, respectively.
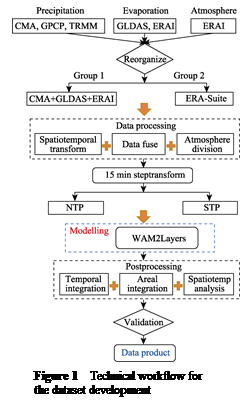
3.5 Technical Route
In
summary, the technical workflow for developing this dataset is shown in Figure
1.
4 Data Results and Validation
4.1 Data Composition
The
dataset consists of 17 data files, including: (1) geographical locations of the
NTP and STP (in .shp format); (2) annual and rainy season precipitation data in
the NTP and STP from 1979 to 2016 (mm, in .xlsx format); (3) simulated moisture
source data for the rainy season and annual precipitation in the NTP and STP
from 1979 to 2016, with a spatial resolution of 1????1?? (mm, in .nc format).
 4.2 Data Results
According
to statistics, precipitation during the rainy season (May?CSeptember) dominates
over the Qinghai-Xizang Plateau, with average rainy season precipitation
accounting for 77.1% and 88.4% of annual precipitation in the southern and
northern plateau, respectively. The distribution of moisture sources for annual
and rainy season precipitation in the northern and southern plateau is shown
in Figure 2. There are notable differences between the northern and southern plateau. Precipitation in the northern
plateau mainly originates from the northwestern westerlies that traverse the
Eurasian continent, while the contribution from southern moisture sources is
less extensive for the same intensity. Precipitation in the southern
plateau primarily comes from southern moisture sources, including the
Indochina Peninsula, Arabian Sea, Bay of Bengal, and the west-central tropical
Indian Ocean; the westerlies zone also contributes but is generally weaker.
Moisture north of the plateau contributes significantly to the northern plateau
but barely affects the southern plateau; similarly, moisture from the tropical
Indian Ocean hardly influences the northern plateau.
The comparison
between annual and rainy season precipitation moisture source distributions
further demonstrates the decisive role of rainy season precipitation. Taking
the northern plateau as an example, the annual precipitation source shows a
narrow band of moisture contribution over the western Indian Ocean, which comes
from the rainy season??s contribution to the precipitation (Figures 2a and 2b).
When the rainy season begins and the southwest monsoon breaks out, large
amounts of moisture from the western Indian Ocean are transported to the
northern plateau through the Somali Jet, forming precipitation and leaving a
significant imprint.
The northern and
southern plateau show different precipitation trends. From a moisture source
perspective, the increase in northern precipitation is mainly due to increased
moisture contribution from the plateau and monsoon regions. In contrast,
changes in moisture sources for southern plateau precipitation are more
complex??the decrease in moisture contribution from the Indian Peninsula and
westerlies is the direct cause of reduced precipitation in the southern plateau[17].
4.3 Data Validation
Due to the scarcity of ground
station data in the northern plateau, there is significant uncertainty in
northern precipitation data. Zhang et al.
introduced the TRMM satellite precipitation product 3B42 to further track and
simulate moisture sources in the northern plateau[17]. Results show
that during the overlapping time period (1998?C2016), despite some

Figure 2 Spatial
distribution maps of moisture sources for annual (a, c) and rainy (wet) season
(b, d) mean precipitation in the Northern (a, b) and Southern (c, d) Qinghai-Xizang
Plateau (NTP and STP)
differences
in specific values in certain local areas, the moisture sources and their trend
distributions derived from different precipitation datasets demonstrate high
spatial structural similarity. This finding indicates that the qualitative
conclusions based on CMA data are reliable. Additionally, alongside the main
experiment, Zhang also designed control group experiments[17], using
complete ERA-Interim data to simulate moisture sources for the northern and
southern plateau. By comparing with the main experimental results, they
quantified the uncertainty caused by different input data, strengthening the
credibility of the main experimental results and research conclusions.
5 Discussion and Conclusion
The
northern and southern Qinghai-Xizang Plateau, controlled by different
circulation systems, display distinctly different precipitation patterns: the
northern region shows significant precipitation increase, while the southern
region exhibits a slight decreasing trend. This study employed the numerical
model WAM2Layers, using the CMA precipitation product, GLDAS model evaporation
data and ERA-Interim atmospheric reanalysis as driving data to track moisture
sources for precipitation in the northern and southern plateau regions, thereby
establishing a simulation dataset of moisture sources for precipitation in the
northern and southern plateau. This dataset has a spatial resolution of 1????1??,
covers the period 1979?C2016, and includes moisture source distributions for
both annual and rainy season precipitation. The reliability of this dataset has
been thoroughly validated through comparative experiments and supplementary
precipitation experiments.
Preliminary
analysis results show that precipitation sources on the Qinghai-Xizang Plateau
exhibit distinct seasonal characteristics and regional differences, with rainy
season precipitation playing a decisive role in both precipitation amount and
moisture sources. This complex precipitation pattern reflects the unique
geographical and atmospheric circulation characteristics of the Qinghai-Xizang
Plateau. Based on this dataset, future research directions may include:
in-depth analysis of how different circulation changes affect precipitation;
investigation of moisture source differences during extreme precipitation
years; and study of the synchronous and asynchronous relationships between
northern and southern plateau precipitation systems. These studies will help
further reveal the mechanisms of precipitation change and moisture transport
processes on the plateau, providing important scientific evidence for
understanding the region??s water cycle.
Conflicts of Interest
The
authors declare no conflicts of interest.
References
[1]
Chen, D. L.,
Xu, B. Q., Yao, T. D., et al.
Assessment of past, present and future environmental changes on the Qinghai-Xizang
Plateau [J]. Chinese Science Bulletin,
2015, 60: 3025?C3035.
[2]
Yao, T. D.,
Thompson, L., Yang, W., et al.
Different glacier status with atmospheric circulations in Tibetan Plateau and
surroundings [J]. Nature Climate Change,
2012, 2(9): 663?C667.
[3]
Klein, J. A.,
Hopping, K. A., Yeh, E. T., et al.
Unexpected climate impacts on the Tibetan Plateau: local and scientific
knowledge in findings of delayed summer [J]. Global Environmental Change, 2014, 28: 141?C152.
[4]
Yang, K., Ye,
B., Zhou, D., et al. Response of
hydrological cycle to recent climate changes in the Tibetan Plateau [J]. Climatic change, 2011, 109: 517?C534.
[5]
Gao, Y., Cuo,
L., Zhang, Y. Changes in moisture flux over the Tibetan Plateau during
1979?C2011 and possible mechanisms [J]. Journal
of Climate, 2014, 27(5): 1876?C1893.
[6]
Jiang, J.,
Zhou, T., Qian, Y., et al.
Precipitation regime changes in High Mountain Asia driven by cleaner air [J]. Nature, 2023, 623(7987): 544?C549.
[7]
Yao, T. D., Masson-Delmotte,
V., Gao, J., et al. A review of
climatic controls on ??18O in precipitation over the Tibetan Plateau:
observations and simulations [J]. Reviews
of Geophysics, 2013, 51(4): 525?C548.
[8]
Zhang, C., Tang, Q. H.,
Huang, J. C., et al. Precipitation moisture
source simulating dataset on sou- thern and northern
Qinghai-Xizang Plateau [J/DB/OL]. Digital
Journal of Global Change Data Re-pository, 2024.
https://doi.org/10.3974/geodb.2024.08.03.V1. https://cstr.escience.org.cn/CSTR:20146.11.2024.08.03.V1.
[9]
GCdataPR
Editorial Office. GCdataPR data sharing policy [OL].
https://doi.org/10.3974/dp.policy.2014.05 (Updated 2017).
[10] Zhao, Y., Zhu, J., Xu, Y. Establishment and
assessment of the grid precipitation datasets in China for recent 50 years [J]. Journal of the
Meteorological Sciences, 2014, 34(4):
414?C420.
[11] Rodell, M., Houser, P. R., Jambor, U. E. A., et al. The global land data assimilation
system [J]. Bulletin of the American
Meteorological society, 2004, 85: 381?C394.
[12] Zhou, X., Zhang, Y., Yang, Y., et al. Evaluation of anomalies in GLDAS-1996 dataset [J]. Water science and technology, 2013,
67(8): 1718?C1727.
[13] Dee, D. P., Uppala, S. M., Simmons, A. J., et al. The ERA-Interim reanalysis:
configuration and performance of the data assimilation system [J]. Quarterly Journal of the Royal
Meteorological Society, 2011, 137: 553?C597.
[14] van der Ent, R. J., Tuinenburg, O. A., Knoche, H.
R., et al. Should we use a simple or
complex model for moisture recycling and atmospheric moisture tracking? [J]. Hydrology and Earth System Sciences,
2013, 17: 4869?C4884.
[15] van der Ent, R. J., Wang-Erlandsson, L., Keys, P.
W., et al. Contrasting roles of
interception and transpiration in the hydrological cycle??part 2: moisture
recycling [J]. Earth System Dynamics,
2014, 5(2): 471?C489.
[16] Zhang, C. Dataset development for water vapor
sources of Meiyu Season precipitation in the middle and lower reaches of the
Yangtze River (26.5??N?C33.5??N, 104.5??E?C122.5??E, 1991?C2020) [J]. Journal of Global Change Data & Discovery, 2024, 8(2): 171?C177.
https://doi.org/10.3974/geodp.2024.02.07.
https://cstr.escience.org.cn/CSTR:20146.14.2024.02.07.
[17] Zhang, C., Tang, Q. H., Chen, D. L., et al. Moisture source changes
contributed to different precipitation changes over the northern and southern Tibetan
Plateau [J]. Journal of Hydrometeorology,
2019, 20(2): 217?C229.