Vegetation Health Index 1-km Grid Dataset in
Yellow River?CHuangshui River Valley (2000?C2020)
Sun, N. S.1 Chen, Q.1,2* Liu, F. G.1,2 Zhou, Q.1,2 Guo, Y. Y.1,3
1. School of Geographic
Science, Qinghai Normal University, Xining, Qinghai 810008, China;
2. Academy of Plateau
Science and Sustainability, Xining, Qinghai 810008, China;
3. Center for
Agricultural Resources Research, Institute of Genetics and Developmental
Biology, Chinese Academy of Sciences, Shijiazhuang, Hebei 050022, China
Abstract: Yellow
River?CHuangshui River valley (YHV) is the most
important agricultural area and grain production base in Qinghai province. The
analysis of the evolution trend of the agricultural drought in YHV is of great
significance for ensuring the healthy development of agriculture in Qinghai
province. The dataset is obtained using the vegetation health index (VHI)
calculation model and the daily land reflectance MOD09GA and daily land
temperature MOD11A1 data. VHI is the metric parameter that can couple the
normalized differential vegetation index (NDVI) and land surface temperature
(LST) to reflect the agricultural drought level of the region. The area covered
by this dataset is YHV, and the observation duration is from March to November
(Vegetation growing season) during 2000?C2020. The dataset is in the GeoTiff
format, has a spatial resolution of 1 km, comprises 406 files, has a data size
of 20.9 MB.
Keywords: Yellow River?CHuangshui River valley; agricultural
drought; vegetation health index; growing season
DOI: https://doi.org/10.3974/geodp.2022.04.10
CSTR: https://cstr.escience.org.cn/CSTR:20146.14.2022.04.10
Dataset Availability Statement:
The dataset supporting this
paper was published and is accessible through the Digital Journal of Global Change Data Repository at: https://doi.org/10.3974/geodb.2022.08.03.V1
or https://cstr.escience.org.cn/CSTR:20146.11.2022.08.03.V1.
1 Introduction
Agricultural
drought is characterized by long duration and wide impact, which can seriously
affect agricultural production, human activities, and economic development as
well as the stability and security of society. It is one of the major
agricultural disasters[1?C3]. Intergovernmental Panel on Climate
Change stated in its Sixth Assessment Report that continued global warming will
lead to enhanced evapotranspiration and an increase in the agricultural drought
area in the future[4]. The accumulated agricultural drought disaster
in China in 2021 damaged 3,426.2 thousand hectares of crops and caused direct
economic losses of 20.09 billion Yuan[5]. Thus, studying the
agricultural drought problem in China is significant for ensuring food supply
and maintaining social stability.
YHV is located in the northeast of Qinghai
province; it is the alluvial formation of the valley of Yellow River and its
tributaries Huangshui River[6]. The total area of the YHV region is
about 3.3 ?? 104 km2, accounting for
only about 4.5% of the total area of the province. Nearly 70% of the province??s
population is concentrated in this region, and more than 80% of the land is
arable. Therefore, studying the agricultural drought in the YHV region is
essential for promoting sustainable agricultural development in the Qinghai
province. Compared to other indices, the vegetation health index (VHI) has better
applicability in the field of agricultural drought monitoring[7] and
is widely employed by scholars worldwide. The dataset compiled herein is based
on the MODIS remote sensing data with the use of the VHI calculation model to
calculate the annual VHI and seasonal VHI from 2000 to 2020 and the threshold
method to determine the agricultural drought. This dataset can intuitively
reflect the location of agricultural drought areas and agricultural drought
area changes in YHV and provide reference for drought policy formulation and
agricultural production and management in YHV.
2 Metadata of the Dataset
The metadata
summary of the dataset[8] is provided in Table 1, including the
dataset name, short name, authors, year, temporal resolution, spatial
resolution, data format, data size, data files, publisher, and sharing policies, etc.
3 Methods
3.1 Algorithm
VHI was proposed by
Kogan et al. and was calculated from
the vegetation condition index (VCI) and temperature condition index (TCI)[10].
When crops are affected by agricultural drought, VCI and TCI beneficially
reflect the crop growth status and temperature, respectively[11].
When a drought occurs, the vegetation growth will be stressed and the VCI index
will decrease. Additionally, a drought is usually accompanied by an abnormal
increase in temperature, and consequently, the TCI index will decrease. In this
study, the weighted combination index VHI[12], which integrates the
respective advantages of VCI and TCI, is adopted to study the agricultural
drought in the YHV. The specific calculation methods of VCI, TCI, and VHI are
as follows:
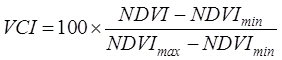 (1)
(1)
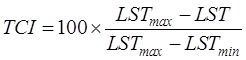 (2)
(2)
Table
1 Metadata
summary of the Grid dataset of 1-km vegetation health index in Yellow
River-Huangshui River valley (2000?C2020)
|
Item
|
Description
|
|
Dataset full name
|
Grid dataset of
1-km vegetation health index in Yellow River-Huangshui River valley
(2000?C2020)
|
|
Dataset short
name
|
YHV_VHI_2000-2020
|
|
Authors
|
Sun, N. S.
GNW-6596-2022, School of Geographic Science, Qinghai Normal University,
say0524@163.com
Chen, Q.
AAB-3346-2021, School of Geographic Science, Qinghai Normal University,
qhchenqiong@163.com
Liu, F. G.
L-8795-2018, School of Geographic Science, Qinghai Normal University,
lfg_918@163.com
Zhou, Q.
AAB-3351-2021, School of Geographic Science, Qinghai Normal University,
zhouqiang729@163.com
|
|
Guo, Y. Y.
GOG-8661-2022, School of Geographic Science, Qinghai Normal University,
821709854@qq.com
|
|
Geographical
region
|
Yellow
River?CHuangshui River valley
|
|
Year
|
2000?C2020
|
|
Temporal
resolution
|
Annually and
seasonally
|
|
Spatial
resolution
|
1 km
|
|
Data format
|
.shp, .tif
|
|
Data size
|
14.3M (after
compression)
|
|
Data files
|
406 data files,
including annually and quarterly vegetation health index data files
|
|
Foundations
|
Ministry of Science
and Technology of P. R. China (2019YFA0606902)
|
|
Computing
environment
|
Google
Earth Engine (GEE), ArcGIS
|
|
Data publisher
|
Global Change
Research Data Publishing & Repository, http://www.geodoi.ac.cn
|
|
Address
|
No. 11A, Datun
Road, Chaoyang District, Beijing 100101, China
|
|
Data sharing
policy
|
Data from the Global Change Research Data
Publishing & Repository includes metadata, datasets (in the Digital Journal of Global
Change Data Repository), and publications (in the Journal of Global
Change Data & Discovery).
Data sharing
policy includes: (1) Data are openly available and can
be free downloaded via the Internet; (2) End users are encouraged to use Data
subject to citation; (3) Users, who are by definition also value-added
service providers, are welcome to redistribute Data subject to written
permission from the GCdataPR Editorial Office and the issuance of a Data
redistribution license; and (4) If Data are used to compile new
datasets, the ??ten per cent principal?? should be followed such that Data
records utilized should not surpass 10% of the new dataset contents, while
sources should be clearly noted in suitable places in the new dataset[9]
|
|
Communication
and
searchable
system
|
DOI, CSTR, Crossref, DCI, CSCD, CNKI, SciEngine, WDS/ISC, GEOSS
|
 (3)
(3)
where, the value of ?? is
generally 0.5[13]. Kogan et al. proposed the agricultural
drought discrimination threshold based on VHI[14]:
 (4)
(4)
where G(VHI)
is the drought value, with 1 representing agricultural drought and 0 representing
no agricultural drought.
3.2
Data Development Process
Based on MOD09GA
and MOD11A1 data of the study area from 2000 to 2020, the following steps were
conducted (Figure 1):
(1) The scope of the study area was
imported into GEE to obtain the MOD09GA and MOD11A1 data of the study area from
2000 to 2020.
(2) NDVI was calculated based on MOD09GA ( , where
  is the
near-infrared band and
is the
near-infrared band and  is the infrared
band), and the quality. Mosaic() function in GEE was used to synthesize the
maximum value of NDVI. The S-G filter was used to smooth NDVI, and the mean()
function in GEE was used to synthesize the average of LST.
is the infrared
band), and the quality. Mosaic() function in GEE was used to synthesize the
maximum value of NDVI. The S-G filter was used to smooth NDVI, and the mean()
function in GEE was used to synthesize the average of LST.
(3) Projection conversion and resampling of
NDVI and LST were performed in ArcGIS, and the annual and seasonal VCI and TCI
were calculated. Finally, the annual and seasonal VHI were calculated.
(4) The temporal variation and spatial
distribution of the agricultural drought in YHV were obtained.
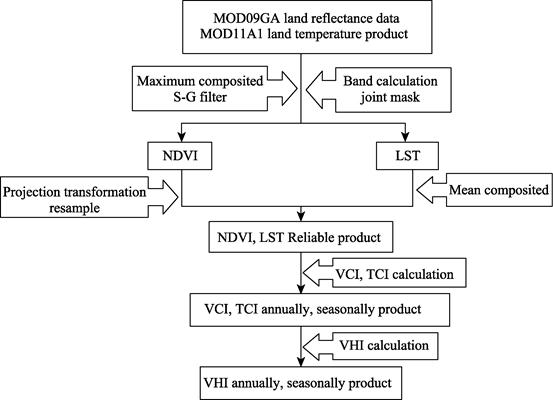
Figure
1 Flowchart of the
dataset development
4 Data Results and Validation
4.1 Data Products
The 1-km grid VHI
dataset in YHV was named as VHI.YYYY.1_km_season.tif and
VHI.YYYY.1_km_GSeason.tif. The specific respective meanings are as follows: (1)
VHI: represents the vegetation health index product; (2) YYYY: represents that
the production year; (3) 1_km: represents the spatial resolution of 1 km; (4)
GSeason: represents annual data. (5) season: represents seasonal data.
4.2
Data Results
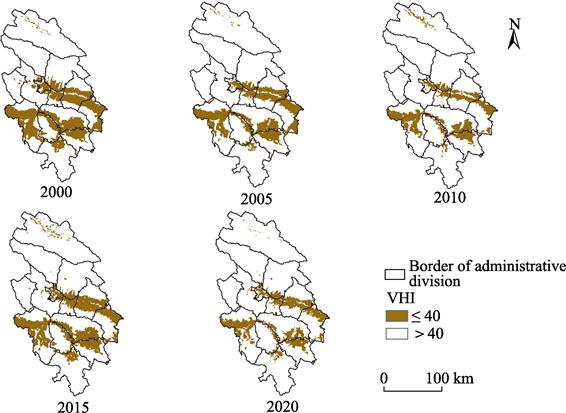
4.2.1 Interannual Spatial and Temporal Variation of Agricultural Drought
in Growing Season
VHI in the growing
season of YHV from 2000 to 2020 is shown in Figure 2. The figure shows that the
agricultural arid area in the annual growing season of YHV in the recent 20
years exhibits a decreasing trend, from more than 1.0 ?? 104 km2
in 2000 to less than 0.7 ?? 104 km2 in 2020, with an
average annual decrease of 142.85 km2. Thus, the agricultural
drought area greatly decreased. The agricultural arid areas of YHV are mainly
located in the central and southern regions of YHV, i.e., the low-heat valley
zone of the Yellow River and Huangshui River.
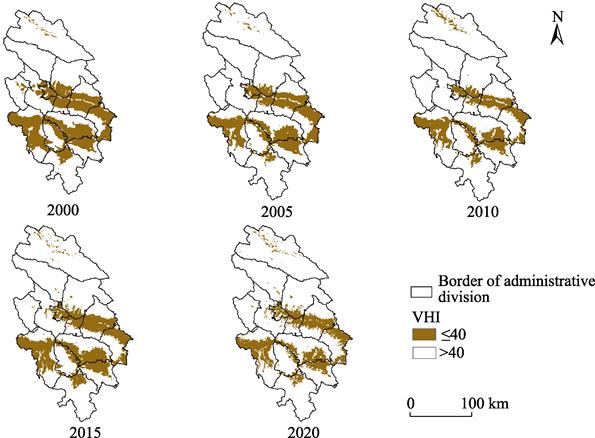
Figure
2 Maps of VHI in growing season during 2000?C2020
4.2.2 Temporal and Spatial Variations of the Agricultural Drought in the
Growing Season
The VHI of the YHV region in the spring,
summer, and autumn from 2000 to 2020 (Figure 3, 4 and 5) intuitively shows that
(1) the agricultural dry areas in spring are mainly located in the northern,
central, and southern regions of YHV, (2) the annual agricultural drought areas
in summer and autumn are mainly located in the central and southern parts of
YHV, and (3)

Figure
3 Maps of VHI in
spring during 2000?C2020
Figure
4 Maps of VHI in
summer during 2000?C2020
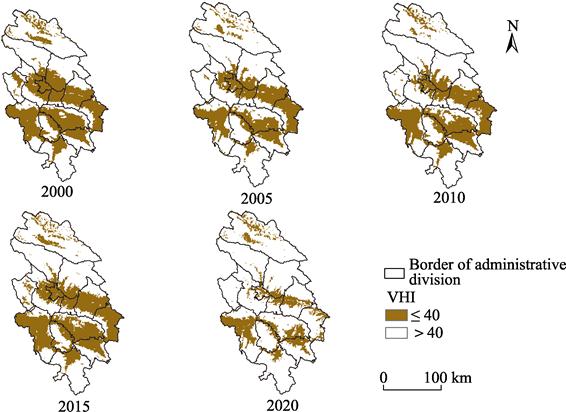
Figure
5 Maps of VHI in autumn during 2000?C2020
the agricultural
dry areas in each season are basically located in the low-heat valley area with
large evapotranspiration. The changes of the agricultural arid area in the YHV
region in the spring, summer, and autumn from 2000 to 2020 are shown in Figure
6, respectively. In the YHV region, the agricultural arid area in the spring
exhibits almost no change in the past 20 years and is always above 1.4 ?? 104
km2, while that in the summer and autumn exhibits a very obvious
downward trend. The decrease is significantly greater in the summer than in the autumn. In the 20 years, agricultural drought
area annually decreased by an average of 187.09 km2, the summer and
autumn agricultural drought area annually decreased by average of 369.64 km2,
but the whole spring of YHV agricultural drought area biggest, next
autumn, summer minimum of YHV agricultural drought is given priority to with
spring drought. The severity of autumn and summer drought is less severe than
that of the spring drought.
Figures 7 shows that in the YHV in the
recent 20 years, the average of spring VHI is basically less than 40, the
average of summer VHI is between 50 and 60, and the average of autumn VHI is
between 40 and 50. In the YHV region, the average of summer VHI is the largest,
followed by that of the autumn VHI and spring VHI. In the YHV region, the
severity of the agricultural drought is the highest in spring, followed by
autumn and summer. Moreover, the trend fitting of the average VHI of the three
seasons shows that the average VHI of each season increases to different
degrees. Among them, the average VHI of autumn exhibits the largest increase,
followed by summer and spring. Therefore, during the period from 2000 to 2020,
the severity of agricultural drought in each season in YHV alleviated, but spring
was the drought prone season in the YHV region.

Figure
6 Agricultural
drought area in spring, summer and autumn during 2000?C2020
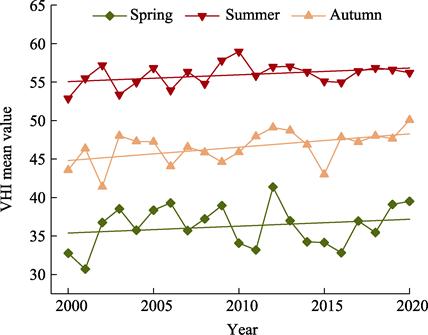
Figure
7 The averaged VHI
in spring, summer and autumn during 2000?C2020
5 Discussion and Conclusion
The study of agricultural
drought in the YHV region is of great practical significance for the healthy
agricultural development in the Qinghai province. In this study, the VHI in the
growing season of YHV from 2000 to 2020 were calculated based on remote sensing
data, and the agricultural drought characteristics in this period were annually
and seasonally obtained.
Based on the
research results, the agricultural drought in the entire YHV region is
continuously alleviated, reflecting the continuous improvement of the natural
conditions in this region, which is consistent with the conclusion that the
natural environment of the Qinghai?CTibet Plateau is warming and wetting[15].
Furthermore, from the interannual and seasonal perspectives, the agricultural
arid areas in the YHV region are all located in the valley region formed by the
Datong River, Huangshui River, and Yellow River, which is the most concentrated
agricultural area in the YHV region. The study results denote that using VHI to
identify agricultural arid areas in the YHV region is reasonable. In the
future, VHI can be used as an indicator to monitor agricultural drought in the
YHV region as well as the Qinghai province.
Author Contributions
Chen,
Q. proposed the idea; Liu, F. G. and Zhou, Q. designed the framework; Sun, N.
S. and Guo, Y. Y. collected and processed the data; and Sun, N. S. wrote the
paper.
Conflicts of Interest
The
authors declare no conflicts of interest.
References
[1]
Zhang,
L. F., Jiao, W. Z., Zhang, H. M., et al.
Studying drought phenomena in the continental United States in 2011 and 2012
using various drought indices [J]. Remote
Sensing of Environment, 2017, 190: 96?C106.
[2]
Cong,
D. M., Zhao, S. H., Chen, C., et al.
Characterization of droughts during 2001?C2014 based on remote sensing: a case
study of Northeast China [J]. Ecological
Informatics, 2017, 39: 56?C67.
[3]
Wu,
Z. M., Qiu, J. X., Liu, S. X., et al.
Advances in agricultural drought monitoring based on soil moisture [J]. Progress in Geography, 2020, 39(10):
1758?C1769.
[4]
IPCC.
Climate change 2021: the physical science basis [OL]. http://www.ipcc.ch.
[5]
Ministry of Emergency Management of the People??s Republic
of China. Basic situation of natural disasters in China in 2021 [EB/OL]. [2022-01-23].
https://www.mem.gov.cn/xw/yjglbgzdt/202201/t20220123_407204.shtml.
[6]
Luo,
J., Zhang, Y. L., Liu, F. G., et al.
Reconstruction of cropland spatial patterns for 1726 on Yellow River-Huangshui
River valley in Northeast Qinghai-Tibet Plateau [J]. Geographical Research, 2014, 33(7): 1285?C1296.
[7]
Mou,
L. L., Wu, B. F., Yan., N. N., et al. Validation
of agricultural drought indices and their uncertainty analysis [J]. Bulletin of Soil and Water Conservation,
2007(2): 119?C122.
[8]
Sun, N. S., Chen, Q., Liu, F. G.., et al. Grid dataset of 1-km vegetation health index in Yellow
River-Huangshui River valley (2000?C2020) [J/DB/OL]. Digital Journal of Global Change Data Repository, 2022.
https://doi.org/10.3974/geodb.2022.08.03.V1.https://cstr.escience.org.cn/CSTR:20146.11.2022.08.03.V1.
[9]
GCdataPR
Editorial Office. GCdataPR data sharing policy [OL].
https://doi.org/10.3974/dp.policy.2014.05 (Updated 2017).
[10]
Kogan,
F. N. Application of vegetation index and brightness temperature for drought
detection [J]. Advances in Space Research,
1995, 15(11): 91?C100.
[11]
Bayarjargal, Y., Karnieli, A.,
Bavasgalan, M., et al. A comparative
study of NOAA-AVHRR derived drought indices using change vector analysis [J]. Remote Sensing of Environment, 2006,
105(1): 9?C22.
[12]
Eskinder,
G., Oagile, D., Reuben, S., et al.
Analysis of the long-term agricultural drought onset, cessation, duration,
frequency, severity and spatial extent using vegetation health index (VHI) in
Raya and its environs, Northern Ethiopia [J]. Environmental Systems Research, 2018, 7(1): 1?C18.
[13]
Zhang,
A. X., Jia, G. S. Monitoring meteorological drought in semiarid regions using
multi-sensor microwave remote sensing data [J]. Remote Sensing of Environment, 2013, 134: 12?C23.
[14]
Kogan,
F. N. Operational space technology for global vegetation assessment [J]. Bulletin of the American Meteorological
Society, 2001, 82(9): 1949?C1964.
[15]
Ding, J., Liu, X. Y., Guo, Y. C., et al. Study on Vegetation Change in Qinghai-Tibet Plateau From
1980 to 2015 [J]. Ecology and
Environmental Sciences, 2021, 30(2): 288?C296.