Industrial Upgrading Dataset Development for the Cities of Pearl
River Delta of China (1999-2018)
Huang,
K. X.1 Liu, Y.2, 3 Zhang, Y. F.4* Liu, Y. T.2
1. Department of Geography, National University of
Singapore, Singapore 117570, Singapore;
2. School of Tourism Management, Sun Yat-Sen University,
Guangzhou 510275, China;
3. Key Laboratory of Intelligent Assessment Technology for
Sustainable Tourism, Ministry of Culture and Tourism, Zhuhai 519080, China;
4. College of Urban and Environmental Sciences, Peking
University, Beijing 100080, China
Abstract: Based on the
statistical yearbook data of the Pearl River Delta (PRD) region, the authors
analyzed the evolution process of industrial upgrading of nine cities in the
PRD region (including Guangzhou, Shenzhen, Zhuhai, Dongguan, Foshan, Zhongshan,
Zhaoqing, Huizhou, and Jiangmen) from two dimensions, industrial structure
upgrading and firm efficiency upgrading, and developed the dataset of the
evolution process of industrial upgrading of the PRD (1999–2018). The dataset includes the
following data of nine cities in the PRD: (1) the proportion of output value of
high-tech industries in the PRD from 1994 to 2020; (2) the upgrading of
industrial structure in the PRD from 1998 to 2020; (3) average industrial value
added of firms in the PRD from 1998 to 2018; (4) the upgrading of firm
efficiency in the PRD from 1999 to 2018; (5) firm efficiency and industrial
structure of the PRD from 1998 to 2018; (6) the industrial upgrading in the PRD
from 1999 to 2018; (7) panel data on firm efficiency of the PRD cities from
1998 to 2018; (8) panel data on industrial structure of the PRD cities from
1998 to 2018. The dataset is archived in .xlsx format, and consists of one data
file with data size of 187 KB.
Keywords: industrial upgrading; Pearl River Delta;
Guangzhou-Shenzhen-Zhuhai
DOI: https://doi.org/10.3974/geodp.2023.01.11
CSTR: https://cstr.escience.org.cn/CSTR:20146.14.2023.01.11
Dataset Availability Statement:
The dataset
supporting this paper was published and is accessible through the Digital Journal of
Global Change Data Repository at: https://doi.org/10.3974/geodb.2023.05.02.V1 or
https://cstr.escience.org.cn/CSTR:20146.11.2023.05.02.V1.
1 Introduction
Since
the beginning of the reform and opening-up policy, the Pearl River Delta (PRD)
has effectively integrated into the global economic system, benefiting from the
impetus provided by national market-oriented reforms and the proactive response
of local authorities[1]. Consequently, it has achieved sustained and rapid economic growth.
However, in recent years, the industrial upgrading in this region has faced the
challenges of declining regional assets and rising costs concerning land use
and human resource, as well as external shocks such as globalization setbacks,
trade frictions, and the COVID-19 pandemic, resulting in a decline in its
position in the global production network. Therefore, quantitatively measuring
the path of industrial upgrading in the PRD is essential for a deeper
understanding of the process of industrial upgrading of this region under
globalization.
Currently, the
research on industrial upgrading primarily draws from economics, management,
and development studies based on a series of representative theories, such as
the flying-geese paradigm. However, these studies have failed to
comprehensively capture the geographical dimension of industrial upgrading.
Furthermore, the economic geography perspective has largely ignored the
industrial upgrading in latecomer regions, especially the initiatives of local
actors, and associated geographical variables[2].
Therefore, this
dataset focuses on the nine cities in the PRD and includes data on the
evolution of industrial structure upgrading and firm upgrading from 1999 to
2018. The dataset takes into account the geographical aspects of industrial
upgrading and provides quantitative measurement indicators, technical routes,
and results. It has certain technical value and basic data value and can
provide new references for regional industrial upgrading research.
2 Metadata of the Dataset
The
metadata of the Dataset of the
evolution of industrial upgrading of nine cities in the Pearl River Delta of
China (1999-2018) is
summarized in Table 1[3]. It includes the dataset’s full name, short name, authors, year of
the dataset, data format, data size, data files, data publisher, and data
sharing policy, etc.
3 Methods
In
terms of indicator development, the dataset measured the trajectory of
industrial upgrading in the PRD through two dimensions: firm-level production
efficiency (this type of upgrading will be phrased as “firm upgrading” hereafter) and industrial structure. It measured
the average value added per enterprise and the proportion of high-tech industry
output value in the total industrial output value, respectively. According to
the Circular on the Statistical Classification
Catalogue of High-tech Industries issued by the National Bureau of
Statistics of China in 2002, the statistical scope of high-tech industries
includes aerospace and equipment manufacturing, electronic and communication
equipment manufacturing, computer and office equipment manufacturing, pharmaceutical
manufacturing, and medical equipment and instrument manufacturing.
The data source
comes from the statistical yearbooks of various cities in the PRD, including
Guangzhou, Shenzhen, Zhuhai, Dongguan, Foshan, Zhongshan, Zhaoqing, Huizhou,
and Jiangmen, from the years of 1999 to 2018[5–14]. It should be
noted that data from Hong Kong and Macau is currently unavailable.
Based on the
statistical yearbooks of the cities aforementioned above, the data is further
processed to achieve a quantitative measure of industrial upgrading. Taking the
nth year as an
Table 1 Metadata summary of the Dataset
of the evolution of industrial upgrading of nine cities in the Pearl River
Delta of China (1999-2018)
|
Items
|
Description
|
|
Dataset full name
|
Dataset of the
evolution of industrial upgrading of nine cities in the Pearl River Delta of
China (1999-2018)
|
|
Dataset short
name
|
EvolutionIndustrialPRD1999-2018
|
|
Authors
|
Huang, K. X.
HOF-0893-2023, Department of Geography, National University of Singapore,
h.kaixuan@u.nus.edu
Liu, Y.
GMY-4030-2022, School of Tourism Management, Sun Yat-Sen University and Key Laboratory
of Intelligent Assessment Technology for Sustainable Tourism,
liuyi89@mail.sysu.edu.cn
Zhang, Y. F.
HKO-3368-2023, College of Urban and Environmental Sciences, Peking University,
zhangyifan2022@stu.pku.edu.cn
Liu, Y. T.
HOA-5542-2023, School of Tourism Management, Sun Yat-Sen University,
liuyt95@mail2.sysu.edu.cn
|
|
Geographical
region
|
The Pearl River
Delta, China
|
|
Year
|
1999–2018
|
|
Data format
|
.xlsx
|
|
|
|
Data size
|
187 KB
|
|
|
|
Data files
|
This dataset
includes 8 tables: (1) data on the proportion of high-tech industry output
value in the PRD from 1994 to 2020; (2) data on the level of industrial
structure upgrading in the PRD from 1998 to 2020; (3) data on the average
industrial value added by firms in the PRD from 1998 to 2018; (4) data on the
level of firm-level efficiency upgrading in the PRD from 1999 to 2018; (5) data
on the efficiency and industrial structure of firms in the PRD from 1998 to
2018; (6) data on industrial upgrading in the PRD from 1999 to 2018; (7) and
(8) panel data on firm-level efficiency and industrial structure in the
cities of the PRD from 1998 to 2018. These panel datasets are mainly used to
calculate the aforementioned indicators
|
|
Foundation
|
National Natural
Science Foundation of China (42271182)
|
|
Data publisher
|
Global Change Research Data Publishing & Repository,
http://www.geodoi.ac.cn
|
|
Address
|
No. 11A, Datun
Road, Chaoyang District, Beijing 100101, China
|
|
Data sharing
policy
|
Data from the Global
Change Research Data Publishing & Repository includes metadata, datasets (in the Digital Journal of Global Change Data Repository), and
publications (in the Journal of Global Change Data & Discovery). Data sharing policy includes: (1) Data are openly
available and can be free downloaded via the Internet; (2) End users are
encouraged to use Data subject to citation; (3) Users, who are by definition
also value-added service providers, are welcome to redistribute Data
subject to written permission from the GCdataPR Editorial Office and the
issuance of a Data redistribution license; and (4) If Data are used to
compile new datasets, the ‘ten per cent principal’ should be followed such
that Data records utilized should not surpass 10% of the new
dataset contents, while sources should be clearly noted in suitable places in
the new dataset[4]
|
|
Communication and
searchable system
|
DOI, CSTR, Crossref, DCI, CSCD, CNKI,
SciEngine, WDS/ISC, GEOSS
|
example,
the measurement of industrial structure upgrading is divided into three steps:
(1) calculating the ratio of high-tech industry output value to total
industrial output value, i.e., the proportion of high-tech industry; (2) the
increase in the proportion of high-tech industries in a city in the nth
year can be used to measure the level of industrial structural upgrading in
that city for the nth year; and (3) then summing the industrial
structure upgrading levels of all cities year by year to obtain the industrial
structure upgrading level of the PRD from 1999 to 2018.
The measurement of
firm upgrading also includes three steps: (1) calculating the ratio of
industrial value added to the total number of industrial firms year by year,
i.e., the average industrial value added per firm; (2) calculating the annual
increase in the average industrial value added per firm in a city for the nth
year; and (3) summing the firm upgrading of all cities year by year to obtain
the level of the region from 1999 to 2018. The technical route is shown as
follows.
4 Data Results and Validation
|
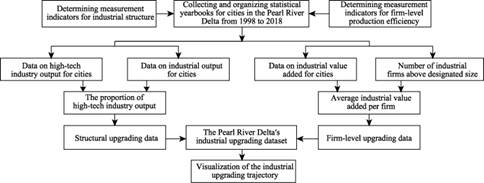
Figure
1 Technical route of dataset development
|
4.1 Data Composition
The
dataset of the evolution of industrial
upgrading of nine cities in the Pearl River Delta of China (1999-2018) is archived in
a .xlsx format and consists of one data file with a size of 187 KB. The data
mainly includes the industrial structure upgrading and firm-level efficiency
upgrading data of the PRD as a whole as well as each city from 1999 to 2018 and
the panel data used to calculate the aforementioned indicators.
4.2 Data Products
Figure
2 reports the annual data of structural upgrading and firm upgrading of each
city in the PRD from 2004 to 2018. From 2004 to 2008, most cities in the PRD
experienced a round of structural upgrading, followed by three years of
firm-level efficiency upgrading. From 2009 to 2011, the region entered a phase
of continuous enterprise upgrading. Through the dual effect of government
capacity elimination policies and voluntary relocation of firms, a number of
backward industries in the region were phased out. After 2013, most cities entered
a phase of regional upgrading, where both firm efficiency and industrial
structure were upgraded simultaneously.
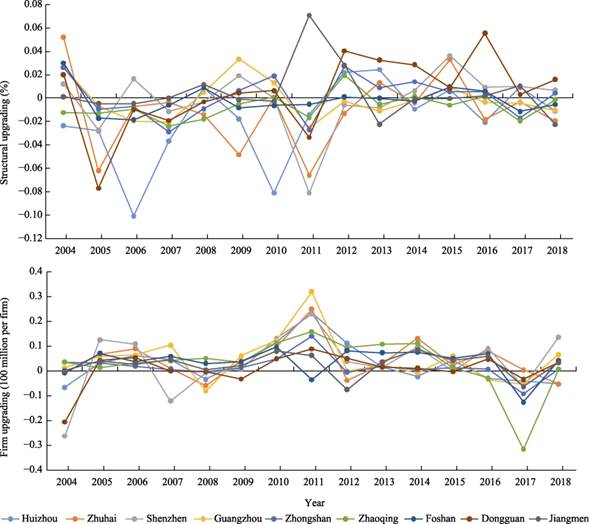
Figure 2 Structural and firm upgrading of each of
nine cities in the PRD (2004-2018)
|
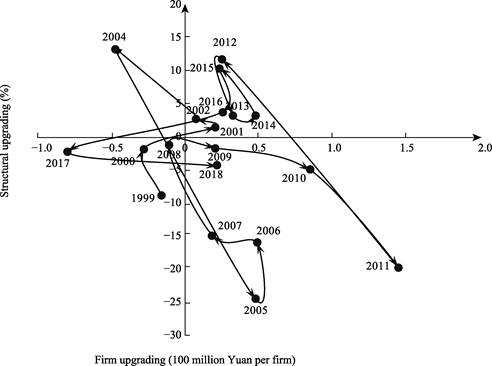
Figure 3 Map of industrial upgrading pattern of
the PRD (1999-2018)
|
Figure 3 presents
the trajectory of industrial upgrading patterns in the PRD from 1999 to 2018 Due
to statistical reasons, the results of the industrial structural upgrading in
2003 were anomalous and have been excluded from the analysis. Before 2000, the
PRD went through the involutional stage of the industrialization process during
the reform and opening up period. In 2003, due to flaws in statistical data,
there was a deviation in the result of structural upgrading, which greatly
interfered with the characterization of the annual track of industrial
upgrading pattern in the PRD, so the track result presented in this year was excluded.
Since the early 21st century, the PRD has embarked on a new round of
regional upgrading. From 2001 to 2007, the PRD successively experienced
firm-level and structural upgrading. In 2008, it suffered from the impact of
the financial crisis and exhibited mild involutional tendencies. Subsequently,
from 2009 to 2011, it entered a sustained firm upgrading phase. From 2012 to
2016, the PRD underwent regional upgrading with a significant improvement in
industry structure and firm-level efficiency. In 2017, the efficiency of firms
and the upgrading of industrial structures in the PRD experienced a setback,
showing a short-lived period of regional industrial involution. In early 2018,
with another round of technological transformation of industrial firms, the PRD
emerged from the involutional phase and started a new phase of firm upgrading.
Based on the
trajectory of industrial upgrading in the PRD, this research proposes a “Dragon-shape
Paradigm” for capturing the trajectory of regional industrial upgrading, which
means that the pathway of industrial upgrading is not a linear or gradual
trajectory, but a circuitous or roundabout development process, like a crawling
snake. According to the framework of the four quadrants of industrial upgrading
analysis, the dynamic of the regional industrial curve shows a certain degree
of oscillation, which oscillates between firm upgrading, structural upgrading,
regional upgrading, and regional industrial involution.
5 Discussion and Conclusion
This
study measures the industrial upgrading trajectory of the PRD based on two dimensions:
firm upgrading and industrial structure upgrading, and proposes the Dragon-shape
Paradigm to term the regional pathway of industrial upgrading. Following the
end of involutional stage under the process of industrialization in the early
21st century, the industrial upgrading path in the PRD can be divided into
three stages. Stage 1 (2001-2007)
witnessed sequential upgrades in both firm efficiency and industrial structure.
Stage 2 (2009-2011) experienced sustained firm
upgrading. Stage 3 (2012-2016) saw
rapid regional upgrading. However, in 2008 and 2017, the region faced external
shocks, leading to temporary involutional stage. However, in 2018, a new round
of technological transformation in industrial firms brought the region back to
the stage of firm upgrading.
The core
contribution of this dataset lies in its active promotion of the theoretical
and empirical research progress of industrial upgrading under globalization.
The evolution process of industrial upgrading in the PRD has been empirically
demonstrated, including four types of industrial upgrading patterns: firm
upgrading, structural upgrading, regional upgrading, and regional involution.
This breakthrough has overcome the limitations of the firm-centric or
space-centric analysis, which helps to better understand the geographical and
multi-scale nature of industrial upgrading. Furthermore, this study has
innovatively discovered the “Dragon-shape Paradigm” for capturing the niche of
the unstable process of upgrading, which differs from the “flying-geese
paradigm” that describes industrial upgrading as a continuously incremental
process. This new concept offers a better explanation for the dynamics of
industrial upgrading under globalization.
Author Contributions
Huang, K. X. and Liu, Y. designed the algorithms of
the dataset. Zhang, Y. F. and Liu, Y. T. contributed to the data
processing and analysis. Zhang, Y. F. and Liu, Y. T. wrote the data paper.
Conflicts of Interest
The authors declare no conflicts of
interest.
References
[1] Sit,
V. F. S., Yang, C. Foreign-investment-induced Exo-urbanisation in the Pearl
River Delta, China [J]. Urban Studies,
1997, 34(4): 647‒677.
[2] Liu,
Y., Zhang, Y. F., Huang, K. X., et al.
Patterns and evolution path of regional industrial upgrading under globalization
[J]. Acta Geographica Sinica, 2023,
78(2): 351‒370.
[3] Huang, K. X., Liu,
Y., Zhang, Y. F., et al. Dataset of the evolution of industrial
upgrading of nine cities in the Pearl River Delta of China (1999‒2018) [J/DB/OL].
Digital Journal of Global Change Data
Repository, 2023.
https://doi.org/10.3974/geodb.2023.05.02.V1. https://cstr.escience.org.cn/CSTR:20146.11.2023.05.02.V1.
[4] GCdataPR
Editorial Office. GCdataPR data sharing policy [OL].
https://doi.org/10.3974/dp.policy.2014.05 (Updated 2017).
[5] Guangdong
Provincial Bureau of Statistics, Survey Office of the National Bureau of
Statistics in Guangdong. Guangdong Statistical Yearbook: 1995‒2021[M]. Beijing:
China Statistics Press, 1995‒2021.
[6] Statistics
Bureau of Dongguan, Survey Office of the National Bureau of Statistics in
Dongguan. Dongguan Statistical Yearbook: 1995‒2021 [M]. Beijing: China
Statistics Press, 1995‒2021.
[7] Statistics
Bureau of Foshan, Survey Office of the National Bureau of Statistics in Foshan.
Foshan Statistical Yearbook: 1995‒2021 [M]. Beijing: China Statistics Press,
1995‒2021.
[8] Guangzhou
Statistics Bureau, Survey Office of the National Bureau of Statistics in
Guangzhou. Guangzhou Statistical Yearbook: 1995‒2021 [M]. Beijing: China
Statistics Press, 1995‒2021.
[9] Statistics
Bureau of Huizhou, Survey Office of the National Bureau of Statistics in
Huizhou. Huizhou Statistical Yearbook: 1995‒2021 [M]. Beijing: China Statistics
Press, 1995‒2021.
[10] Statistics
Bureau of Jiangmen, Survey Office of the National Bureau of Statistics in
Jiangmen. Jiangmen Statistical Yearbook: 1995‒2021 [M]. Beijing: China
Statistics Press, 1995‒2021.
[11] Statistics
Bureau of Shenzhen, Survey Office of the National Bureau of Statistics in
Shenzhen. Shenzhen Statistical Yearbook: 1995‒2021 [M]. Beijing: China
Statistics Press, 1995‒2021.
[12] Statistics
Bureau of Zhaoqing, Survey Office of the National Bureau of Statistics in
Zhaoqing. Zhaoqing Statistical Yearbook: 1995‒2021 [M]. Beijing: China
Statistics Press, 1995‒2021.
[13] Statistics
Bureau of Zhongshan, Survey Office of the National Bureau of Statistics in
Zhongshan. Zhongshan Statistical Yearbook: 1995‒2021 [M]. Beijing: China Statistics
Press, 1995‒2021.
[14] Statistics
Bureau of Zhuhai, Survey Office of the National Bureau of Statistics in Zhuhai.
Zhuhai Statistical Yearbook: 1995‒2021 [M]. Beijing: China Statistics Press,
1995‒2021.