Development of the Spatio-temporal Variations Dataset
of NDVI in Qinling-Daba Mountains of China (2000?C2019)
Bai Yan1, 2, 3
1. State Key Laboratory of Resources and Environmental
Information System, Institute of Geographic Sciences and Natural Resources Research,
Chinese Academy of Sciences, Beijing 100101, China;
2. National Earth System Science Data Center, National
Science & Technology Infrastructure of China, Beijing 100101, China
Abstract: The
Qinling-Daba Mountains region (Qinba) is an important geographical and ecological
transitional zone between the north and south of China. Based on MOD13Q1 V006
data at spatial and temporal resolutions of 250 m and 16 d, respectively, from
2000 to 2019, the seasonal and annual Normalized Difference Vegetation Index
(NDVI) values were estimated using the maximum value composites and the mean
value approaches. Then, the dataset of spatio-temporal variations of NDVI in
the Qinba over the past two decades was developed using linear regression
analysis and F test. The following parameters were included in the dataset: (1)
spatial distribution of the slope of
the annual and seasonal NDVI, (2) annual and seasonal variations in their
significance (P values and the slope
of NDVI through a test of 95% confidence levels), and (3) annual and seasonal
average NDVI values in the Qinba during 2000?C2019. The dataset was archived in
.tif and .xlsx formats and consisted of 47 data files with a total data size of
994 MB (compressed into a single file of 385 MB).
Keywords: vegetation; NDVI; variation; annual; seasonal; Qinling Mountains;
Daba Mountain
Dataset Availability Statement:
The dataset supporting this paper was published and
is accessible through the Digital Journal of Global Change Data Repository at: https://doi.org/10.3974/geodb.2020.06.10.V1.
1 Introduction
As a crucial component of terrestrial ecosystems[1],
vegetation plays an important role in connecting the atmosphere, soil, and
water, and in regulating global material and energy cycles, maintaining climate
stability, and monitoring ecosystem changes[2?C4]. Vegetation is also
an extremely sensitive indicator of natural and anthropogenic effects on the environment[5?C6].
Vegetation variation has become a critical issue in the field of global terrestrial
ecosystem change[7?C10]. Normalized Difference Vegetation Index
(NDVI), a robust and simple measure in characterizing vegetation photosynthetic
activity and monitoring ecological environments at different spatial scales,
has been widely used to characterize the global range of vegetation states and
processes[11?C15].
The
Qinling-Daba Mountains region (Qinba), spanning from the subtropical zone to
the warm temperate zone, is adjacent to the eastern edge of the Qinghai-Tibet
Plateau in the west and to the North China Plain in the east. Qinba is the only
large-scale ecological corridor connecting the east and west of China, and has
been recognized as an essential geographical and ecological transitional zone
between the north and south of China[16]. In addition, as an area
that is vulnerable to climate change and ecological variations, the spatio-temporal
pattern of vegetation dynamics in the Qinba is one of the key issues in the
global change research. Therefore, several relevant studies have been conducted,
including Chen (2019) [15] , Chen (2019) [16],
Deng (2018)[17],
Liu (2015) [18], Chui (2012) [19], Ren (2012)[20], Sun (2010)[21], Luo (2009)[22] . However, previous studies that investigated vegetation
dynamics in the Qinba have been focused on their annual variations, and primarily
carried out in partial regions, such as the Qinling region in the Shannxi province.
There is a lack of understanding of the vegetation variations and their dynamic
trends across the entire Qinba as a single geographical and geomorphic unit.
Moreover, characteristics of seasonal differences in vegetation changes have
rarely been reported from this area. In this study, the dataset of spatio-temporal
variations of NDVI in the Qinba was developed using linear regression and F
test, based on MODIS (MODerate resolution Imaging Spectroradiometer) NDVI time
series data (MOD13Q1-NDVI). This dataset comprehensively indicates the multi-temporal
(i.e., annual and seasonal) variations and dynamic trends of vegetation over
the Qinba during the past two decades, which is significant for promoting
sustainable development of the regional ecological environment in this area.
2 Metadata of
the Dataset
The metadata of the ??Spatio-temporal variation trends
dataset of NDVI in Qinling-Daba Mountains and surrounding area of China
(2000?C2019)??[23] is summarized in Table 1, including the dataset
full name, short name, author, geographical region, year of the dataset,
temporal resolution, spatial resolution, data format, data size, data files,
data publisher, and data sharing policy, etc.
3 Methods
3.1
Basic Data Collection
The boundary data of the Qinba was acquired from Program funded
by Ministry of Science and Technology of P. R. China[15]. The 16 d
composites for 250 m MODIS NDVI product (MOD13Q1 V006) were downloaded from
Earth Observing System Data and Information System[25], covering the period from February 2000 to
December 2019. Two tiles (h26v05 and h27v05) were required to cover the Qinba.
The original HDF format and sinusoidal projection of MOD13Q1 were transformed
into a Geotiff format and Albers Equal Area Conic projection with WGS84 datum
separately, and were re-sampled at a resolution of 250 m employing the nearest
neighbor method, using the MODIS Reprojection Tool.
Table
1 Metadata
summary of the ??Spatio-temporal variation trends dataset of NDVI in Qinling-Daba
Mountains and surrounding area of China (2000?C2019)??
|
Items
|
Description
|
|
Dataset full name
|
Spatio-temporal variation
trends dataset of NDVI in Qinling-Daba Mountains and surrounding area of
China (2000?C2019)
|
|
Dataset short name
|
QinbaNDVItrend_2000-2009
|
|
Author
|
Bai, Y. AAW-8595-2020,
Institute of Geographic Sciences and Natural Resources Research, Chinese
Academy of Sciences; National Earth System Science Data Center,
baiy@lreis.ac.cn
|
|
Geographical region
|
The Qinling-Daba Mountains
region: 30??43??N-35??29??N, 102??21??E?C113??40??E
|
|
Year
|
2000?C2019
|
|
Data format
|
.tif, .xlsx
|
Data size
|
382 MB (after compression)
|
|
Time resolution
|
Annual, seasonal
|
Spatial resolution
|
250 m
|
|
Data files
|
The significant
characteristics and statistical data of annual and seasonal variations of
NDVI in the Qinba from 2000 to 2019
|
|
Foundations
|
Ministry of Science and
Technology of P. R. China (2017FY100900, 2005DKA32300); Chinese Academy of
Sciences (XXH-13514)
|
|
Computing
environment
|
Python, MATLAB, ArcGIS
|
|
Data publisher
|
Global Change Research Data
Publishing & Repository, http://www.geodoi.ac.cn
|
|
Address
|
No. 11A, Datun Road, Chaoyang
District, Beijing 100101, China
|
|
Data sharing policy
|
Data from the Global Change
Research Data Publishing &Repository includes metadata, datasets (in the Digital Journal of Global Change Data Repository), and
publications (in the Journal of Global Change Data & Discovery). Data
sharing policy includes: (1) Data are openly available
and can be free downloaded via the Internet; (2) End users are encouraged to
use Data subject to citation; (3) Users, who are by definition
also value-added service providers, are welcome to redistribute Data subject
to written permission from the GCdataPR Editorial Office and the issuance of
a Data redistribution license; and (4) If Data are
used to compile new datasets, the ??ten per cent principal?? should be followed
such that Data records utilized should not surpass 10% of the
new dataset contents, while sources should be clearly noted in suitable
places in the new dataset [24]
|
|
Communication and searchable
system
|
DOI, DCI, CSCD, WDS/ISC, GEOSS,
China GEOSS, Crossref
|
3.2
Algorithm Principle
(1) Maximum Value
Composite
The monthly NDVI data from
2000 to 2019 were generated using the universal maximum value composite (MVC)
method (Equation 1), which could eliminate the impact of atmosphere, clouds,
and solar altitude angle[26].
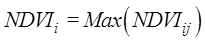 (1)
(1)
where NDVIi is the NDVI value of the month i,
NDVIij is the NDVI value on the day j of the month i.
Due to the absence of the
original MODIS NDVI data in January 2000, the average value of NDVI for January
2001?C2019 was taken as the corresponding values of NDVI for the missing data.
The annual average NDVI was defined as the average monthly NDVI from January to
December. Further, average monthly composite NDVI from March to May, June to
August, September to November, and December to February were defined as spring,
summer, autumn, and winter NDVI, respectively.
(2)
Linear
Regression
The least-squares-based
linear regression trend analysis was used extensively to detect the vegetation
dynamics based on time series NDVI data. This method has the advantage of effectively
eliminating the influence of occasional abnormal factors on vegetation growth,
and truly exhibiting its variation in the long-term period[27?C28].
The equation is as follows:
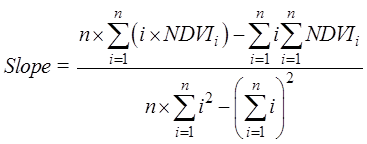 (2)
(2)
where Slope is the index to quantify the dynamic trend of vegetation
using linear regression over the study period, n is the accumulated years of monitoring time range, i is the serial year number (valued from
1 to n), and NDVIi is the NDVI value in year i. When Slope > 0,
there was an increasing dynamic trend in vegetation, and when Slope < 0, there was a decreasing
dynamic trend in vegetation. The greater the Slope value is, the more significant the increasing trend will be.
The significance of the
dynamic trend was conducted using the F test, and the results were classified
into five categories: (i) extremely
significant decrease (Slope < 0, P < 0.01), (ii) significant decrease (Slope
< 0, 0.01 < P < 0.05), (iii) no significant change (P > 0.05), (iv) significant increase (Slope
> 0, 0.01 < P < 0.05),
and (v) extremely significant
increase (Slope > 0, P < 0.01).
4 Data Results
and Validation
4.1
Data Products
The spatio-temporal variation trends dataset of NDVI in
Qinling-Daba Mountains and surrounding area of China (2000?C2019) consists of
spatial and statistics data at multi-temporal scales, i.e., annual and seasonal
(Table 2). The dataset is archived in .tif and .xlsx formats.
Table
2 Composition
of the ??Spatio-temporal variation trends dataset of NDVI in Qinling-Daba Mountains
and surrounding area of China (2000?C2019)??
|
Main
files
|
Description
|
Format
|
Data
size
|
|
Spatial
distribution
data
|
Spatial
distribution of annual Slope in
NDVI from 2000 to 2019
|
.tif
|
76 MB
|
|
Spatial
pattern of variations with significance in annual NDVI from 2000 to 2019
|
.tif
|
153 MB
|
|
Spatial
distribution of seasonal Slope in
NDVI from 2000 to 2019
|
.tif
|
153 MB
|
|
Spatial
pattern of variations with significance in seasonal NDVI from 2000 to 2019
|
.tif
|
612 MB
|
|
Statistical
data
|
Statistics
of annual and seasonal average NDVI from 2000 to 2019
|
.xlsx
|
12.1 KB
|
4.2
Data Results
4.2.1 Temporal Changes in Vegetation
(1)
Annual change
From 2000 to 2019, the annual change in average NDVI shows
a significant increasing trend across the Qinba, with an increasing rate of
0.048/10a (R2 = 0.91, P < 0.05) (Figure 1(a)). The annual
average NDVI value ranged between 0.53 and 0.63, reaching a peak in 2018
(0.632) and a trough in 2001 (0.533), while there were three periods with a
sharp decrease during 2009?C2010, 2013?C2014, and 2016?C2017.
(2)
Seasonal changes
The linear trendline in Figure 1(b) indicates that NDVI
increased significantly across all seasons in the Qinba during 2000?C2019. The
largest increase in the magnitude of NDVI was in spring, with a rate of
0.058/10a (R2 = 0.74),
followed by that in winter (0.049/10a, R2
= 0.76), summer (0.042/10a, R2
= 0.89), and autumn (0.042/10a, R2
= 0.77).
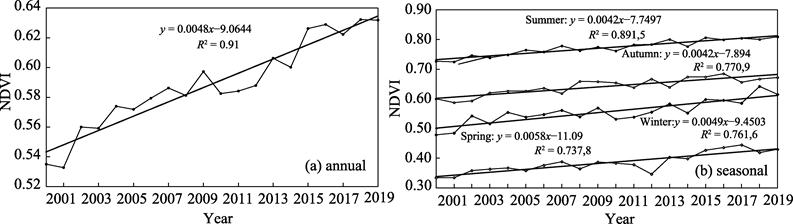
Figure 1
Temporal changes in average NDVI over the Qinba (2000?C2019)
4.2.2 Spatial Variations in Vegetation
(1) Annual variations
The Slope
of annual NDVI was between −0.032 and 0.039 from 2000 to 2019, as shown in
Figure 2(a), and distinct spatial differences in the annual variations of vegetation
were observed over the Qinba. In particular, the results from linear regression
and F test of annual NDVI (Figure 2(b), Table 3) indicated that: (i) 87.81% of the entire region showed
significant and extremely significant increasing trends, where the area ratio
of extremely significant increase accounted for more than 81%; (ii) The regions with significant and extremely
significant decreasing trends accounted for less than 1%, mainly concentrated
in a few areas in the southwest of the Qinba (such as the junction of northern
Chengdu and northern Deyang), and scattered in the Hanzhong basin, the western
edge of Nanyang, and the northern part of Shangluo; and (iii) The regions with no significant change accounted for 11.36%,
primarily distributed in the high-altitude areas of western Qinling Mountains
(i.e., the northeastern part of the Tibetan and Qiang autonomous prefecture of
Aba, and the north western part of the Mianyang and Deyang cities), the
junction of Hanzhong and Bazhong
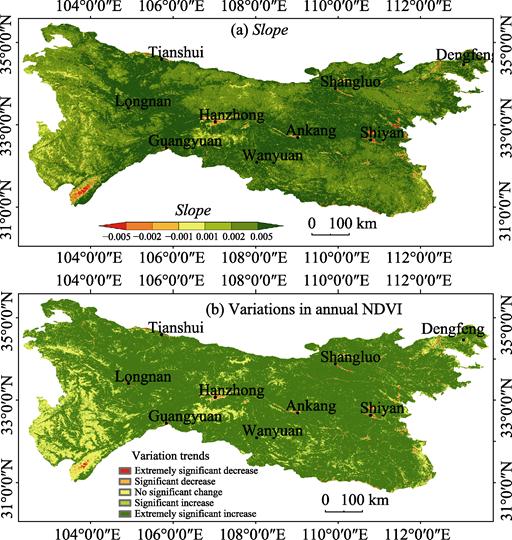
Figure 2 Spatial distribution of Slope, and variations in annual NDVI
over the Qinba (2000?C2019)
cities,
as well as the low-altitude areas in the east of Qinba (i.e., the central
regions of Luoyang and Xiangyang cities).
Table 3 Area proportion (%) of annual and
seasonal NDVI variations in the Qinba (2000?C2019)
|
Classification
|
Trend
|
Annual
|
Spring
|
Summer
|
Autumn
|
Winter
|
|
Area (%)
|
Area (%)
|
Area (%)
|
Area (%)
|
Area (%)
|
|
Slope <
0, P < 0.01
|
Extremely significant decrease
|
0.55
|
0.48
|
0.44
|
0.34
|
0.49
|
|
Slope <
0, 0.01 < P < 0.05
|
Significant decrease
|
0.29
|
0.36
|
0.33
|
0.31
|
0.40
|
|
P > 0.05
|
No significant change
|
11.36
|
24.54
|
31.49
|
35.18
|
22.75
|
|
Slope >
0, 0.01 < P < 0.05
|
Significant increase
|
5.99
|
14.32
|
10.20
|
14.25
|
10.60
|
|
Slope >
0, P < 0.01
|
Extremely significant increase
|
81.82
|
60.30
|
57.54
|
49.92
|
65.76
|
(2) Seasonal variations
Table 3 and Figure 3 indicate that the seasonal variations
in NDVI over the Qinba during the study period were dominated by extremely
significant increase and no significant change. The proportion of area with no
significant seasonal change was more than twice that of the annual change. In
particular, the area ratios of no significant change in summer and autumn were
both higher than 30%, which was clearly higher than those in spring and winter
(Table 3). In spring, NDVI tended to increase in the West Qinling Mountains and
the low altitude areas (i.e., central Ankang and the northern part of the
Shiyan city, Figure 3(a)). Compared with spring, summer NDVI showed a stronger
no significant trend in the western Qinba, southern part of Baoji, and south
and north of Hanzhong (Figure 3(b)). The area characterized by no significant
change in vegetation in autumn NDVI had expanded markedly in the central Qinba,
whereas the areas with significant and extremely significant increase were
mainly distributed in the Longnan region (i.e., Wudu, Xihe, and Lixian) in the
western Qinling Mountains, Ningqiang county at the junction of the Qinling and
Daba Mountains, northeast of Bazhong city, and low-altitude areas such as
northern Shiyan and western Xiangyang (Figure 3(c)). The spatial variations in
winter NDVI were similar to those observed in the spring (Figure 3(d)).
4.3 Data Validation
Results based on multi-temporal MODIS
NDVI revealed that vegetation had an overall significant increasing trend in
the Qinba over the past two decades, which is similar to the results from
previous studies based on annual NDVI [17, 19, 24]. Seasonal
variations of NDVI, reflecting more detailed temporal and spatial variations of
vegetation over long time periods, were further described in the dataset.
Seasonal variations were found to be consistent to the annual variations in the
Qinba. However, the dominating category of variations in vegetation was different
at seasonal and annual scales. The seasonal variations were primarily in the
categories of ??extremely significant increase?? and ??no significant change??,
whereas the annual variations were dominated by the categories ??significant
increase?? and ??extremely significant increase??.
5 Conclusion
Annual and seasonal variations are prominent
characteristics of vegetation[27]. Based on MODIS NDVI data with
relatively high spatial and temporal resolution in the long time series, the
dataset of spatio-temporal variations of NDVI at annual and seasonal scales in
the Qinba from 2000 to 2019 were generated at a spatial resolution of 250 m
based on Python and MATLAB, using MVC, linear regression, and F test methods.
The results showed that in the past 20 years, variations in both annual and
seasonal NDVI increased significantly and extremely significantly across the
Qinba, but the dynamic trend with no significant change was much more distinct
at the seasonal scale. Moreover, vegetation variations in this area
demonstrated the achievements of national ecological protection and restoration
programs, such as the Grain to Green Program (GTGP) implemented since 1999.
This would provide scientific support for comprehensively revealing the
response mechanism of vegetation to climate change, human activities or other
driving factors, and for assisting local governments to develop or implement
policies and projects to promote ecological security and sustainable
development in the Qinba.
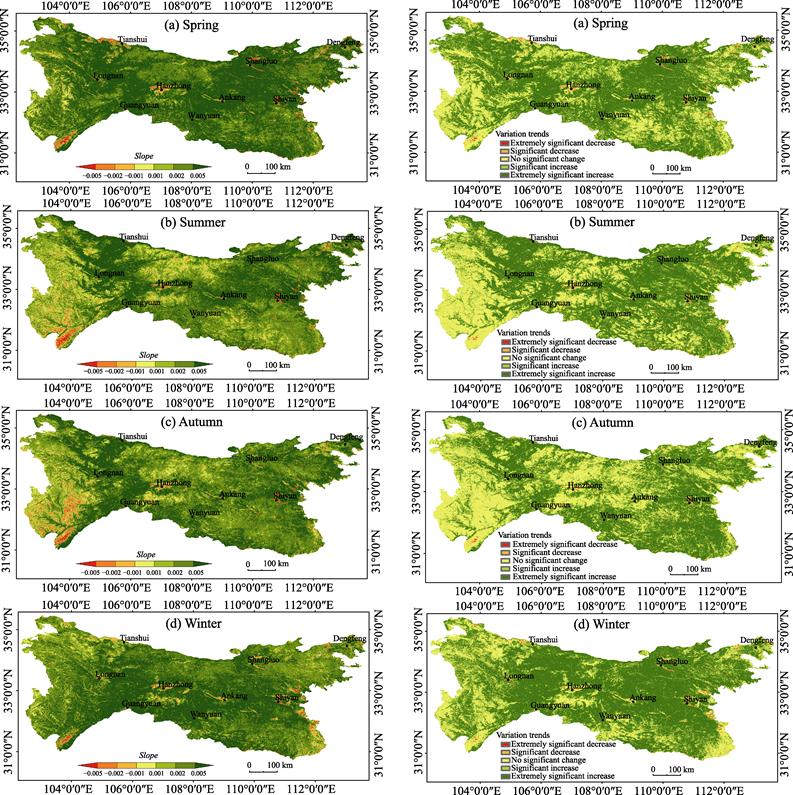
Figure 3
Map of Slope and variation
trend in seasonal NDVI over the Qinba (2000?C2019)
References
[1]
Piao, S.,
Fang, J. Seasonal changes in vegetation activity in response to climate changes
in China between 1982 and 1999 [J]. Acta
Geographica Sinica, 2003, 58(1): 119?C125.
[2]
Schimel,
D., Melillo, J., Tian, H., et al.
Contribution of increasing CO2 and climate to carbon storage by
ecosystems in the United States [J]. Science,
2000, 287(5460): 2004?C2006.
[3]
Hu, C. J., Fu, B. J., Liu, G. H., et
al. Vegetation patterns influence on soil microbial biomass and functional
diversity in a hilly area of the Loess Plateau, China [J]. Journal of Soils and Sediments, 2010, 10(6): 1082?C1091.
[4]
Liu, Y. L.,
Lei, H. M. Responses of natural vegetation dynamics to climate drivers in China
from 1982 to 2011 [J]. Remote Sensing,
2015, 7(8): 10243?C10268.
[5]
Reichstein,
M., Bahn, M., Ciais, P., et al.
Climate extremes and the carbon cycle [J]. Nature,
2013, 500(7462): 287?C295.
[6]
Cai, B.,
Yu, R. Advance and evaluation in the long time series vegetation trends
research based on remote sensing [J]. Journal
of Remote Sensing, 2009, 13(6): 1170?C1186.
[7]
Suzuki, R.,
Masuda, K., Dye, D. G. Interannual covariability between actual
evapotranspiration and PAL and GIMMS NDVIs of northern Asia [J]. Remote Sensing of Environment, 2007,
106(3): 387?C398.
[8]
Fu, B., Li,
S., Yu, X., et al. Chinese ecosystem
research network: progress and perspectives [J]. Ecological Complexity, 2010, 7(2): 225?C233.
[9]
Kelly, M., Tuxen, K. A., Stralberg, D. Mapping changes to vegetation
pattern in a restoring wetland: finding pattern metrics that are consistent
across spatial scale and time [J]. Ecological
Indicators, 2011, 11(2): 263?C273.
[10]
Yuan,
J., Xu, Y., Xiang, J., et al. Spatio-temporal
variation of vegetation coverage and its associated influence factor analysis
in the Yangtze River Delta, eastern China [J]. Environmental Science and Pollution Research, 2019, 26(10):
32866?C32879.
[11]
Nanzad, L.,
Zhang, J., Tuvdendorj, B., et al.
NDVI anomaly for drought monitoring and its correlation with climate factors
over Mongolia from 2000 to 2016 [J]. Journal
of Arid Environments, 2019, 164: 69?C77.
[12]
Kern, A.,
Marjanović, H., Barcza, Z. Spring vegetation green-up dynamics in Central
Europe based on 20-year long MODIS NDVI data [J]. Agricultural and Forest Meteorology, 2020, 287: 107969.
[13]
Zewdie, W.,
Csaplovics, E., Inostroza, L. Monitoring ecosystem dynamics in northwestern
Ethiopia using NDVI and climate variables to assess long term trends in dryland
vegetation variability [J]. Applied
Georaphy, 2017, 79: 167?C178.
[14]
Sun, Z.,
Chang, N. B., Opp, C. Using SPOT-VGT NDVI as a successive ecological indicator
for understanding the environmental implications in the Tarim River Basin,
China [J]. Journal of Applied Remote Sensing,
2010, 4(1): 043554.
[15]
Zhang, B.
P. Ten major scientific issues concerning the study of China??s north-south
transitional zone [J]. Progress in
Geography, 2019, 38(3): 305?C311.
[16]
Chen, C.
N., Zhu, L. Q., Tian, L., et al.
Spatial-temporal changes in vegetation characteristics and climate in the
Qinling-Daba Mountains [J]. Acta
Ecologica Sinica, 2019, 39(9): 3257?C3266.
[17]
Deng, C. H., Bai, H. Y., Gao, S., et
al. Spatial-temporal variations of the vegetation coverage in Qinling Mountains
and its dual response to climate change and human activities [J]. Journal of Natural Resources, 2018,
33(3): 425?C438.
[18]
Liu, X. F.,
Pan, Y. Z., Zhu, X. F., et al. Spatio-temporal
variation of vegetation coverage in Qinling-Daba Mountains in relation to
environmental factors [J]. Acta
Geographica Sinica, 2015, 70(5): 705?C716.
[19]
Cui, X. L.,
Bai, H. Y., Shang, X. Q. The vegetation dynamic in Qinling area based on MODIS
NDVI [J]. Journal of Northwest University
(Natural Science Edition), 2012,
42(6): 1021?C1026.
[20]
Ren, Y. Y.,
Zhang, Z., Hou, Q. L., et al.
Response of vegetation cover changes to climate change in Daba Mountains [J]. Bulletin of Soil and Water Conservation,
2012, 32(2): 56?C59.
[21]
He, Y. N.,
Bai, H. Y., Gao, X., et al. Analysis
on the variation tendency of vegetation cover of Micang Mountains [J]. Acta Botanica Boreali-Occidentalia Sinica,
2011, 31(8): 1677?C1682.
[22]
Luo, X. P.
Spatial-temporal changes of NDVI and the response to the regional climate in
the Qinling?CDaba Mountains for 25 years [D]. Xi??an: Northwest University, 2009.
[23]
Bai, Y. Spatio-temporal
Variation Trends Dataset of NDVI in Qinling-Daba Mountains and Surrounding Area
of China (2000?C2019) [J/DB/OL]. Digital Journal of Global Change Data Repository, 2020. https://doi.org/10.3974/geodb.2020.06.10.V1.
[24]
GCdataPR
Editorial Office. GCdataPR Data Sharing Policy [OL]. https://doi.org/10.3974/dp.policy.2014.05
(Updated 2017).
[25]
NASA, USA. MOD13Q1
NDVI. https://earthdata.nasa.gov.
[26]
Holben N.
Characteristics of maximum-value composite images from temporal AVHRR data [J].
International Journal of Remote Sensing,
1986, 7(11): 1417?C1434.
[27]
Sun, H. Y.,
Wang, C. Y., Niu, Z., et al. Analysis
of the vegetation cover change and the relationship between NDVI and
environmental factors by using NOAA times series data [J]. Journal of Remote Sensing, 1998, 2(3): 204?C210.
[28]
Fan, N.,
Xie, G. D., Zhang, C. S., et al.
Spatial-Temporal Dynamic Changes of Vegetation Cover in Lancang River Basin
during 2001?C2010 [J]. Resources Science,
2012, 34(7): 1222?C1231.