Dataset of Water Conservation of Forest Ecosystem in the Upper Reaches of Wujiang River, China
Tang, Y. Z.1,2 Shao, Q. Q.1,2*
1. Institute of Geographic Sciences and Natural Resources Research, Chinese Academy of Sciences, Beijing 100101, China;
2. University of Chinese Academy of Sciences, Beijing 100049, China
Abstract: Water conservation is function of forest ecosystems, and is vital in flood control, drought relief, soil erosion, and alleviation of regional water shortage. In this study, we estimated water conservation quantity (WCQ) of forest ecosystems in the upper reaches of the Wujiang River (URWR) using integrated storage capacity method of modeling, using forest inventory data in 2010 of Bijie city, Guizhou province. We applied linear regression method to analyze the relationship between forest ecosystem unit water conservation quantity (UWCQ), as a metric of forest water conservation capacity, and elevation. We derived elevation, slope gradient, aspect, and slope position in the study area from digital elevation model (DEM), using slope information extraction method based on hydrological analyses. Results showed that total URWR forest ecosystem WCQ was 563.05×10⁶ m3 and UWCQ was 774.73 t/hm2 in 2010. There was a negative relationship between UWCQ and elevation, where average UWCQ decreased by 90.56 t/hm2 with every 1-km increase in elevation. The dataset includes: (1) geographical location map data; (2) elevation classes; (3) forest ecosystem water conservation data, comprising site conditions (aspect, slope position, slope gradient, and forest type), and computed results that include total and individual WCQ of three forest hydrological layers, UWCQ in forest sub-compartment polygons (.shp format), and forest information, such as soil thickness and forest crown density (.shp format). The dataset was archived to 26 data files in .shp and .tif data formats, which amount to 261 MB (144 MB after compressed to one .rar file). The results of the analysis of this dataset were published in the Journal of Geo-Information Science in No.7, Vol. 18, 2016.
Keywords: Wujiang River; forest; ecosystem; conservation; Guizhou
1 Introduction
The Wujiang River is one of the main tributaries of the Yangtze River: it is 1,037 km long and covers an area of 87.9×10² km2. The Wujiang River basin is located in the central area of the karst region of southwest China, stretching from east of the Yunnan-Guizhou plateau in the west, to the mountains and hills of western Hunan in the east[1]; approximately 76.79% of the basin is distributed in Guizhou province. The upper reaches of the Wujiang River (URWR) at Bijie city are in the karst hinterlands of Yunnan, Guizhou, and Guangxi[2] that are characterized by severely-incised terrain, deep valleys, thin soils and fragile ecological environment[3]. There was widespread deforestation in this area in the 1960s that resulted in reductions in forest coverage (from 12.84% in 1957 to 5.80% in the 1960s) and forest-grass coverage (from 27.49% in the 1950s to 19.17% in the 1960s)[4]. These changes led to soil erosion and land degradation, and frequent occurrence of drought, flood, and debris flow events[5]. A series of ecological restoration programs, including the Grain for Green Program, have been implemented in the karst areas of southwest China since 2000 to control soil losses[3]. Forest, as the main body in preventing and controlling soil erosion, its ecosystem function of water conservation plays an important role in retaining soil moisture, mitigating runoff and replenishing groundwater[6–7], thus is helpful for flood and drought control, soil fixation and fertilizer preservation, and regional water shortage alleviation.
The water conservation ecosystem service provided by forest ecosystems of the URWR, one of the important water sources in southwestern China, is vital to the local, and middle and lower reaches of the Yangtze River. Here, we used the integrated storage capacity method to estimate the water conservation quantity (WCQ) of forest ecosystems in the URWR, based on the forest inventory of Bijie city, Guizhou province in 2010[8]. Our dataset involved forestland information including slope gradient, slope position, elevation, forest age, etc. The relationship between elevation, one of the site condition, and unit water conservation quantity (UWCQ) of forest ecosystem that is considered as forest water conservation capacity (WCC) was also analyzed.
2 Metadata of Dataset
The metadata for dataset of water conservation of forest ecosystem and its spatial variation in the upper reaches of Wujiang River[8] is summarized in Table 1, including dataset name, authors, year, spatial resolution, data format, data size, data files, data publisher, and data sharing policy, etc.
3 Methods
3.1 Basic Data Collection
Basic reference data, based on the municipal boundary of Guizhou province and map of national secondary water resources partition, were provided by the local government and our research group, respectively. Forest vegetation map data were derived from the forest inventory of Bijie city, Guizhou province in 2010, which included abundant forest land information such as forest sample plot coordinates, area, dominant tree species, soil thickness, and land degradation type. We used ASTER GDEM V2 (http://www.jspace-systems.or.jp/ ersdac/GDEM/E/1.html)[10], with spatial resolution of 30 m, as the digital elevation data source.
3.2 Data Processing
3.2.1 Estimation of Forest Ecosystem Water Conservation
We used the integrated storage capacity method (ISCM) to estimate the WCQ of the URWR forest ecosystem, because it considers water conservation as a synthesis of three hydrological processes: canopy interception, litter containment, and soil storage[11]. ISCM was calculated as:
 (1)
(1)
where Q is the total quantity of forest water conservation (m3), CI is canopy interception (m3), LC is litter containment (m3), and SS is soil storage (m3).
Table 1 Metadata summary for dataset of water conservation of forest ecosystem and its spatial variation in the upper reaches of Wujiang River
|
Items
|
Description
|
|
Dataset full name
|
Dataset of water conservation of forest ecosystem and its spatial variation in the upper reaches of Wujiang River
|
|
Dataset short name
|
WaterConsvUpWujiang
|
|
Authors
|
Tang, Y. Z. E-6912-2018, Institute of Geographic Sciences and Natural Resources Research, Chinese Academy of Sciences, tangyz.14b@igsnrr.ac.cn
Shao, Q. Q. E-7614-2018, Institute of Geographic Sciences and Natural Resources Research, Chinese Academy of Sciences, shaoqq@ igsnrr.ac.cn
|
|
Geographical region
|
The eastern to central region of Bijie city, Guizhou province (26°21′N-27°35′N, 104°15′E-106°43′E)
|
|
Year
|
2010
|
|
Spatial resolution
|
30 m
|
|
Data format
|
.rar, .dbf, .prj, .sbn, .sbx, .shp, .xml, shx, .pdf, .tfw, .tif
|
|
Data size
|
261 MB (144 MB after compression)
|
|
Data files
|
The dataset consists of 1 compressed data file package, including 3 data folders and 26 data files:
1_StudyArea: geographical location map data of the URWR (boundary), composed of 7 data files with data volume of 464 KB
2_WaterConservation: forest ecosystem water conservation dataset of the URWR, composed of 15 data files with data volume of 258 MB
3_ElevationClusters: elevation classes dataset of the URWR, composed of 4 data files with data volume of 3.23 MB
|
|
Foundations
|
Ministry of Science and Technology of P. R. China (2013BAC03B00); Chinese Academy of Sciences (GHJ-ZLZX-2018-14)
|
|
Data publisher
|
Global Change Research Data Publishing & Repository, http://www.geodoi.ac.cn
|
|
Address
|
No. 11A, Datun Road, Chaoyang District, Beijing 100101, China
|
|
Data sharing policy
|
Data from the Global Change Research Data Publishing & Repository includes metadata, datasets (data products), and publications (in this case, in the Journal of Global Change Data & Discovery). Data sharing policy includes: (1) Data are openly available and can be free downloaded via the Internet; (2) End users are encouraged to use Data subject to citation; (3) Users, who are by definition also value-added service providers, are welcome to redistribute Data subject to written permission from the GCdataPR Editorial Office and the issuance of a Data redistribution license, and; (4) If Data are used to compile new datasets, the ‘ten percent principal’ should be followed such that Data records utilized should not surpass 10% of the new dataset contents, while sources should be clearly noted in suitable places in the new dataset[9]
|
(1) As the initial allocation of forest to precipitation, CI is not only related to canopy structure, density, and leaf shape, but is also strongly influenced by the amount and intensity of rainfall and wind[12]; it was estimated as
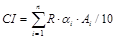 (2)
(2)
where R is the single maximum precipitation (mm), αi is the canopy interception rate of forest type i (%), and Ai is the area of forest type i (hm2).
(2) Litter layer, the second hydrological layer for precipitation retention, is important in the evaluation of water conservation function of forest ecosystems, and LC depends on litter layer structure, decomposition status, litter accumulation, and water-holding capacity. LC was calculated as
 (3)
(3)
where βi is maximum litter water-holding capacity of forest type i (t/hm2) and Ai is the area of forest type i (hm2).
(3) The water-holding capacity of forest soil is a primary indicator of water conservation assessment, and is determined by soil infiltration velocity, soil porosity, and soil thickness. SS was defined as
 (4)
(4)
where γi is the soil non-capillary porosity beneath forest type i (%), hi is soil thickness beneath forest type i (cm), and Ai is the area of forest type i (hm2).
3.2.2 Estimation of Forest Ecosystem Water Conservation
We adopted the slope information extraction method (SIEM), based on hydrological analysis[13], to generate the slope position of each forest sub-compartment polygon in the URWR. SIEM obtains water network and small watershed units from the digital elevation model (DEM) using ArcGIS10.4 tools, extracts ridge and valley lines according to flow paths and catchment according to the small watershed units, distinguishes the slope position units, and classifies the slope position units according to the main flow path. For details of SIEM, refer to the literature[13]. With reference of the National Forest Resources Continuous Inventory Technology[14], slope position in the study area was classified into six categories: ridge, upper slope, middle slope, lower slope, valley, and flat ground. Ridge is the watershed borderline of a mountain chain, along with a 15-m vertical height range down on its both sides; Upper slope, middle slope and lower slope are respectively the upper, middle and lower part of a slope where locate between the ridge and valley; valley lies at the base of both sides of the catchment line (it is also recognized as valley if the plot locates at pits in other mountain parts); flat ground locates in a plain or terrace.
3.2.3 Statistical Analysis
We used linear regression to analyze the relationship between UWCQ and elevation, at P< 0.05[15].
3.3 Data Development
Data were analyzed and modeled according to the procedure shown in Figure 1. The forest vegetation map, which was delimited by the Wujiang River basin according to the national secondary water resources zone map, was generated from the 2010 forest inventory data. Vegetation was categorized into nine types, according to the classification system of Chinese
|
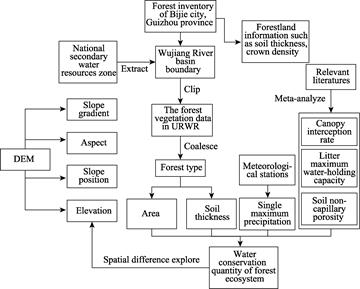
Figure 1 Technical route map
|
Vegetation and National Forest Resources Continuous Inventory Technology, and accounting for density, area, biological, and ecological characteristics of more than 60 dominant tree species[9] that comprised temperate coniferous, warm temperate coniferous, warm temperate coniferous and mixed broad-leaf, deciduous broad-leaf, evergreen and mixed deciduous broad-leaf, evergreen broad-leaf, warm temperate bamboo, and economic forests; and, shrubbery. Single maximum precipitation was obtained from meteorological stations adjacent to the study area.
Meta-analyses of geographic environment, climate, and site condition data were used to obtain key parameters of canopy interception rate, maximum litter water-holding capacity, and soil non-capillary porosity in the nine forest types. Based on ArcGIS 10.4 software, site conditions data, which included forest elevation, slope gradient, aspect, and slope position, were derived from the DEM; and, forest information data, such as soil layer thickness, forest age group, and canopy density, were extracted from the forest inventory. We then explored the spatial relationship between UWCQ and elevation.
4 Results and Validation
4.1 Data Products
The dataset is consisted of three data files:
(1) Geographical location data file of the URWR (boundary)
The URWR lies between 26°21′N-27°35′N and 104°15′E-106°43′E, covering an area of 1.8×10⁴ km2, and accounting for nearly 20.23% of the Wujiang River basin. Six tributaries of the Wujiang River flow through the study area (Liuchong, Sancha, Luojiao, Erhai, Yachi, and Pianyan Rivers; Figure 2).
(2) URWR forest ecosystem water conservation data file
The data file was archived in ArcGIS .shp format and contains data on site conditions (aspect, slope position, slope gradient, and forest type), and computed results that include individual and cumulative WCQ of the three forest hydrological layers, UWCQ in each forest sub-compartment polygon (shp polygon), and forest information at points (soil thickness, forest age group, crown density, living wood growing stock, and land degradation type).
(3) Elevation classes dataset of the URWR
We divided forestland elevation in the URWR into 22 classes, comprising elevations <800 m and >2,800 m, and at every 100 m between 800 and 2,800 m. The area statistic and spatial distributions of each elevation class are shown in Table 2 and Figure 3 respectively.
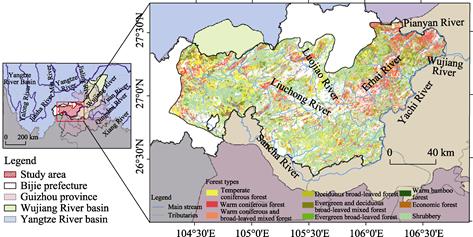
Figure 2 Location and distribution of URWR forest types
Table 2 Area of each elevation class in the URWR
|
Elevation class (m)
|
Area (km2)
|
Elevation class (m)
|
Area (km2)
|
Elevation class (m)
|
Area (km2)
|
Elevation class (m)
|
Area (km2)
|
|
<800
|
54.53
|
1,300-1,400
|
1,757.92
|
1,900-2,000
|
1,132.36
|
2,500-2,600
|
57.43
|
|
800-900
|
272.79
|
1,400-1,500
|
2,099.73
|
2,000-2,100
|
883.07
|
2,600-2,700
|
28.77
|
|
900-1,000
|
497.51
|
1,500-1,600
|
2,007.11
|
2,100-2,200
|
610.24
|
2,700-2,800
|
6.66
|
|
1,000-1,100
|
466.26
|
1,600-1,700
|
1,797.33
|
2,200-2,300
|
471.28
|
>2,800
|
0.61
|
|
1,100-1,200
|
854.66
|
1,700-1,800
|
1,508.36
|
2,300-2,400
|
323.64
|
|
|
|
1,200-1,300
|
1,554.57
|
1,800-1,900
|
1,273.84
|
2,400-2,500
|
130.35
|
|
|
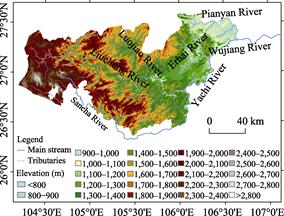
Figure 3 Spatial distribution of elevation classes in the URWR[16]
4.2 Results
In 2010, the URWR forest ecosystem represented a total WCQ of 563.05×10⁶ m3, with the area of forestland comprising 726.77×10³ hm2 that equated to a UWCQ of 774.73 t/hm2. Canopy interception, litter containment, and soil storage were 269.84×10⁶, 18.04×10⁶, and 275.17×10⁶ m3, respectively, representing 42.92%, 3.20%, and 48.87% of the total WCQ, respectively. WCQ gradually declined from the southwest and northeast to the middle region (Figure 4a); spatial distribution of UWCQ was less distinct, where it was shown to decrease from the northeast to southwest in the east, with patchiness in the west (Figure 4b).Forest types were sorted in descending order by their WCQs as follow: shrubbery (38.98%), temperate coniferous forest (21.05%), warm coniferous forest (18.13%), evergreen and deciduous broad-leaved mixed forest (10.73%), deciduous broad-leaved forest (8.61%), warm coniferous and broad-leaved mixed forest (1.50%), evergreen broad-leaved forest (0.51%), economic forest (0.46%), warm bamboo forest (0.03%); decreasing UWCQs were evergreen and deciduous mixed broad-leaf forest, temperate bamboo forest, warm temperate coniferous and mixed broad-leaf forest, temperate coniferous forest, economic forest, warm temperate coniferous forest, deciduous broad-leaf forest, shrubbery, evergreen broad-leaf forest (Table 3).
Table 3 The WCQ of different forest types in the URWR[16]
|
Code
|
Forest types
|
Area
(103 hm2)
|
Canopy interception (106 m3)
|
Litter containment (106 m3)
|
Soil storage (106 m3)
|
WCQ
(106 m3)
|
UWCQ
(t/hm2)
|
|
I
|
Temperate coni-
ferous forest
|
135.086
|
56.702
|
3.468
|
58.334
|
118.503
|
877.245
|
|
II
|
Warm coniferous forest
|
125.837
|
52.397
|
4.743
|
44.942
|
102.081
|
811.216
|
|
III
|
Warm coniferous and broad-leaved mixed forest
|
9.427
|
3.351
|
0.321
|
4.754
|
8.426
|
893.807
|
|
IV
|
Deciduous broad-leaved
forest
|
67.856
|
20.016
|
2.203
|
26.279
|
48.497
|
714.705
|
|
V
|
Evergreen and deciduous broad-leaved mixed forest
|
64.007
|
21.106
|
2.090
|
37.225
|
60.421
|
943.975
|
|
VI
|
Evergreen broad-leaved
forest
|
4.173
|
1.106
|
0.078
|
1.700
|
2.883
|
690.942
|
|
VII
|
Warm bamboo forest
|
0.202
|
0.056
|
0.004
|
0.129
|
0.189
|
934.861
|
|
VIII
|
Economic forest
|
3.103
|
1.329
|
0.074
|
1.172
|
2.575
|
829.922
|
|
IX
|
shrubbery
|
317.078
|
113.775
|
5.064
|
100.635
|
219.473
|
692.174
|
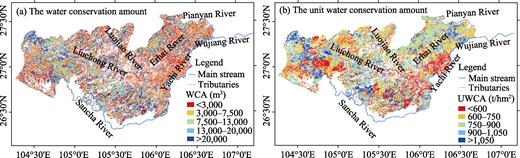
Figure 4 Spatial distribution of WCQ and UWCQ of URWR forest ecosystems[16]
UWCQ decreased with an increase in elevation (P<0.01), where there was an average 90.56 t/hm2 decline in UWCQ with every 1-km increase inelevation (Table 4). At elevations below 1,000 m and between 1,300 and 2,000 m, there was an increase in UWCQ, whereas there was a decrease above 2,100 m and between 1,000 and 1,300 m, which was basically consistent with the change characteristics of proportion of area of each forest type with elevation.
Based on remote sensing data, Zhang et al.[17] found that forest WCC initially increased before it declined with an increase in elevation in Liuhe county, Jilin province; these results are in contrast with our findings that forest WCC declined with an increase of elevation. However, the elevation range in the study by Zhang et al.[17] was less than in our study (303-1,257 m), and its forest WCQ increased with elevations below 750 m, reaching a maximum at 750-850 m, before decreasing at higher elevations. We conclude that our
findings are valid, because the elevation range in our study (between 700 and 2,900 m) coincided with that when forest WCQ began to fall in the study of Zhang et al.[17].
Table 4 The area proportion of each forest type and UWCQ in each elevation class
|
Elevation class (m)
|
Area proportion of each forest type (%)
|
UWCQ
(t/hm2)
|
|
Temperate coniferous
|
Warm temperate coni-
ferous
|
Warm temperate coni-
ferous and mixed broad-leaf
|
Deci-
duous broad-leaf
|
Evergreen and mixed deci-
duous broad-leaf
|
Evergreen broad-leaf
|
Warm temperate bamboo
|
Economic
|
Shrubbery
|
|
<800
|
0.00
|
0.32
|
0.07
|
0.05
|
0.02
|
0.04
|
0.69
|
0.65
|
0.10
|
756.822
|
|
800-900
|
0.03
|
3.83
|
0.44
|
0.97
|
0.80
|
0.37
|
7.84
|
3.75
|
0.96
|
746.343
|
|
900-1,000
|
0.12
|
7.69
|
1.61
|
2.86
|
3.28
|
2.61
|
16.30
|
4.39
|
1.45
|
799.691
|
|
1,000-1,100
|
0.30
|
6.73
|
3.73
|
3.12
|
4.28
|
6.16
|
6.06
|
4.24
|
1.67
|
767.326
|
|
1,100-1,200
|
0.66
|
8.25
|
3.62
|
6.08
|
7.55
|
11.53
|
6.83
|
3.84
|
2.64
|
716.920
|
|
1,200-1,300
|
2.11
|
11.96
|
5.25
|
10.52
|
9.41
|
20.55
|
9.60
|
8.33
|
5.91
|
675.710
|
|
1,300-1,400
|
4.71
|
9.56
|
4.46
|
12.10
|
7.71
|
17.84
|
7.13
|
8.74
|
7.91
|
704.378
|
|
1,400-1,500
|
7.52
|
10.22
|
4.93
|
14.85
|
6.57
|
15.99
|
7.19
|
10.93
|
8.82
|
711.882
|
|
1,500-1,600
|
10.16
|
10.19
|
9.46
|
15.59
|
4.12
|
6.48
|
5.13
|
16.34
|
9.77
|
709.599
|
|
1,600-1,700
|
12.42
|
7.76
|
11.75
|
14.11
|
4.56
|
1.30
|
5.63
|
11.06
|
11.39
|
729.391
|
|
1,700-1,800
|
12.39
|
6.09
|
7.56
|
9.38
|
5.31
|
0.72
|
7.59
|
10.44
|
10.94
|
738.660
|
|
1,800-1,900
|
11.16
|
4.36
|
7.40
|
6.17
|
6.74
|
0.42
|
11.87
|
6.81
|
10.36
|
735.845
|
|
1,900-2,000
|
11.27
|
4.25
|
8.60
|
3.26
|
9.29
|
0.86
|
6.65
|
5.12
|
8.99
|
724.638
|
|
2,000-2,100
|
10.05
|
3.51
|
13.97
|
0.63
|
11.30
|
0.06
|
1.48
|
1.73
|
6.38
|
734.553
|
|
2,100-2,200
|
6.27
|
2.39
|
11.40
|
0.13
|
8.77
|
0.08
|
0.00
|
1.20
|
4.50
|
750.304
|
|
2,200-2,300
|
4.87
|
1.84
|
3.95
|
0.09
|
6.83
|
1.23
|
0.00
|
1.23
|
3.59
|
704.699
|
|
2,300-2,400
|
3.52
|
0.88
|
1.82
|
0.07
|
2.58
|
6.95
|
0.00
|
1.20
|
2.25
|
641.320
|
|
2,400-2,500
|
1.73
|
0.16
|
0.00
|
0.00
|
0.76
|
5.46
|
0.00
|
0.00
|
1.05
|
642.900
|
|
2,500-2,600
|
0.58
|
0.00
|
0.00
|
0.00
|
0.04
|
1.36
|
0.00
|
0.00
|
0.65
|
643.286
|
|
2,600-2,700
|
0.06
|
0.00
|
0.00
|
0.00
|
0.06
|
0.00
|
0.00
|
0.00
|
0.55
|
622.442
|
|
2,700-2,800
|
0.04
|
0.00
|
0.00
|
0.00
|
0.00
|
0.00
|
0.00
|
0.00
|
0.12
|
599.769
|
|
>2,800
|
0.00
|
0.00
|
0.00
|
0.00
|
0.00
|
0.00
|
0.00
|
0.00
|
0.00
|
403.552
|
5 Discussion and Conclusion
In 2010, total URWR forest ecosystem WCQ was 563.05×10⁶ m3, equivalent to a UWCQ of 774.73 t/hm2. UWCQ was negatively related to elevation, where average UWCQ decreased by 90.56 t/hm2 with every 1-km increase in elevation. We classified the numerous vegetation types in the URWR into nine forest categories, based on the Chinese Vegetation Classification System, and combined average depth of the A and B soil profiles as a measure of soil thickness of each forest type to calculate soil water storage capacity, this may cause the
results less precise. Estimation of canopy interception rate, litter maximum water-holding capacity, and soil non-capillary porosity of the forest types may not have accurately reflected local conditions, because data were obtained from the literature. Although ISCM is a relatively comprehensive model, it may occasionally overestimate WCQ due to a lack of inclusion of measures of forest evapotranspiration and effects of rapid runoff from heavy rainfall events[11]. Therefore, our result reflects the maximum theoretical value of forest WCQ in the URWR, rather than the actual value.
Author Contributions
Shao, Q. Q. and Tang, Y. Z. designed the algorithms of dataset; Tang, Y. Z. contributed to the data processing and analysis; Tang, Y. Z. wrote the data paper.
References
[1] Wang, X. C., Huang, Q. H., Cai, Y. L. Assessment of vegetative land cover change using AVHRR/NDVI and SPOT/NDVI data in Wujiang River basin, Southwest China [J]. Research of Soil and Water Conservation, 2008, 15(5): 15-17.
[2] Zhou, Y. S., He X. H., Xie, Y. G., et al. Type classification for vegetation restoration of karst mountains in Bijie [J]. Scientia Silvae Sinicae, 2008, 44(12): 123-128.
[3] Li, H., Cai, Y. L., Chen, R. S., et al. Effect assessment of the project of grain for green in the karst region in southwestern China: a case study of Bijie prefecture [J]. Acta Ecologica Sinica, 2011, 31(12): 3255-3264.
[4] Lu, W. B. Soil loss in Bijie prefecture and its countermeasures of prevention and control [J]. Soil and Water Conservation in China, 1992, 128(11): 8-11.
[5] Gou, X. L. A humble view on accelerating the construction of shelter forest system in the upper reaches of Wujiang River [J]. Guizhou Forestry Science and Technology, 1988(3): 87-89.
[6] Shi, P. L., Wu, B., Cheng, G. W., et al. Water retention capacity evaluation of main forest vegetation types in the upper Yangtze basin [J]. Journal of Natural Resources, 2004, 19(3): 351-360.
[7] Deng, K. M., Shi, P. L., Xie, G. D. Water conservation of forest ecosystem in the upper reaches of Yangtze River and its benefits [J]. Resources Science, 2002, 24(6): 68-73.
[8] Tang, Y. Z., Shao, Q. Q. Dataset of water conservation of forest ecosystem in the upper reaches of Wujiang River [DB/OL]. Global Change Research Data Publishing & Repository, 2018. DOI: 10.3974/geodb. 2018.01.06.V1.
[9] GCdataPR Editorial Office. GCdataPR data sharing policy [OL]. DOI: 10.3974/dp.policy.2014.05 (Updated 2017).
[10] National Aeronautics and Space Administration. ASTER GDEM [OL]. http://www.jspacesystems.or.jp/ ersdac/GDEM/E/1.html.
[11] Zhang, B., Li, W. H., Xie, G. D., et al. Water conservation function and its measurement methods of forest ecosystem [J]. Journal of Beijing Forestry University, 2009, 28(3): 529-534.
[12] Zhang, L. G. A comprehensive evaluation of water-storage ability of water conservation forest in the upper reaches of Minjiang River [J]. Sichuan Forestry Exploration and Design, 1997(4): 27-31.
[13] Liu, P. J., Xia, Z. W., Tang, X. M. Slope position extraction method based on DEM and slopefeatures [J]. Journal of Beijing Forestry University, 2016, 38(2): 68-73.
[14] State Forestry Administration of the People’s Republic of China. National Forest Resources Continuous Inventory Technology [Z]. 2004.
[15] Qian, S. Environmental and Ecological Statistics with R [M]. Boca Raton: CRC Press, 2010.
[16] Tang, Y. Z., Shao, Q. Q. Water conservation capacity of forest ecosystem and its spatial variation in the upper reaches of Wujiang River [J]. Journal of Geo-Information Science, 2016, 18(7): 987-999.
[17] Zhang, B. C., Hu, J. R., Li, X. J., et al. Estimation and research of forest water conservation based on remote sensing [J]. Chinese Agricultural Science Bulletin, 2014, 30(1): 98-102.