Vegetation Phenology Dataset in Mongolia
(2001–2019)
Shao, Y. T.1 Wang, J. L.1,2*
1. State Key Laboratory of Resources and Environmental
Information System, Institute of Geographic Sciences and Natural Resources
Research, Chinese Academy of Science (CAS), Beijing 100101,
China;
2.
Jiangsu Center for Collaborative Innovation in
Geographical Information Resource Development and Application, Nanjing 210023,
China
Abstract: Vegetation phenology reflects the growth status of
vegetation and is a biological indicator of climate change. Mongolia is an
important part of the Mongolian Plateau and an important response region for
global ecological and environmental changes. The change of vegetation phenology
in Mongolia can reflect global climate change. The normalized vegetation index
of the MOD13Q1 product dataset, uses the dynamic threshold method to obtain the
vegetation phenological parameters in Mongolia. The dataset is archived in .tif
format, with a spatial resolution of 250 m, and includs remote sensing monitoring
data of the start of growing season (SOS), end of growing season (EOS), and
length of growing season (LOS) in Mongolia from 2001 to 2019. The dataset
consists of 60 files with a data size of 944 MB (compressed into three files,
844 MB). It reveals differences in the temporal and spatial distribution of
vegetation phenology in Mongolia, and provides basic reference data for the
study of vegetation phenology and climate change in the Mongolian Plateau.
Keywords: vegetation phenology; Mongolia;
climate change; Mongolian Plateau
DOI: https://doi.org/10.3974/geodp.2022.02.10
CSTR: https://cstr.escience.org.cn/CSTR:20146.14.2022.02.10
Dataset Availability Statement:
The dataset supporting this paper
was published and is accessible through the Digital Journal of Global Change Data Repository
at: https://doi.org/10.3974/geodb.2022.03.05.V1
or https://cstr.escience.org.cn/CSTR:20146.11.2022.03.05.V1.
1 Introduction
Vegetation phenology refers
to a seasonal phenomenon in which vegetation interacts with different climatic,
geographical, and other environmental factors. It indicates that under the
prolonged influence of surrounding environmental conditions, vegetation growth
and development will show a specific periodic law[1]. Vegetation
phenology is a sensitive and key feature of vegetation change that plays a
crucial role in regulating climate-biosphere interactions, and is closely
related to global climate change. It is essential to examine the seasonal and
interannual dynamic changes of carbon exchange between vegetation and
atmosphere. Therefore, vegetation phenology has attracted increasing attention[2–4]. Under the
background of global climate change, the climate of Mongolia is also changing,
and climate change will inevitably lead to drastic changes in vegetation
phenology. Therefore, obtaining a vegetation phenology dataset specific to
Mongolia and analyzing its temporal and spatial changes are crucial for a
detailed understanding of how Mongolia??s vegetation ecosystem responds to
global climate and environmental change.
The traditional method of obtaining phenological data
is observation of ground vegetation, which can provide accurate and objective
vegetation phenological data; however, the work efficiency is low and the
monitoring range is relatively small, making monitoring over a large-scale
range difficult. Novel and advanced remote sensing
technology has been utilized to invert vegetation phenology data[5–7]. Remote sensing
technology can dynamically monitor the growth of plants in regions (including
overseas regions) that cannot be reached in a short period of time, and help
realize the transition from traditional spot monitoring to large-scale regional
monitoring on the ground, and of observation objects from a single plant to entire vegetation communities. In many remote
sensing applications, MODIS data products have proven to be reliable sources
for studying vegetation dynamic evolution data[8–10]. There are few field phenological
observation stations in Mongolia and continuous and systematic measured phenological
observation data are lacking, resulting in a dearth of accurate reference
materials and data for the study of temporal and spatial variation
characteristics of vegetation phenology in Mongolia and the response of
vegetation phenology to global climate change. To address this demand, this
dataset is based on MODIS data products and remote sensing technology has been
efficiently used to obtain the annual vegetation phenology dataset of Mongolia
from 2001 to 2019.
2 Metadata of the Dataset
The metadata summary of the Vegetation
phenology dataset based on MOD13Q1 in Mongolia (2001–2019) [11] is
shown in Table 1, which includes the dataset??s full name, short name,
author(s), year, temporal resolution, spatial resolution, data format, data
size, data files, publisher, sharing policies, etc.
3 Methods
The dataset was mainly
generated based on the Terra/MODIS NDVI data product (MOD13Q1), which has a
spatial resolution of 250 m and a temporal resolution of 16 d. Mongolia has
nine scenes: h22v03, h23v03, h23v04, h24v03, h24v04, h25v03, h25v04, h26v04,
and h27v049. Data from 2001 to 2019, consisting of a total of 3,933 scene data
(19 years ?? 23 issues /year ?? 9 scene) amounting to a total data size of 1,071 GB,
was downloaded from the official website of National Aeronautics and Space
Administration (NASA) (https://ladsweb.modaps.eosdis.nasa.gov).
3.1 Algorithm Principle
(1) Dynamic threshold algorithm
To obtain the phenological period data of
Mongolia, the dynamic threshold algorithm[13] was used to extract phenological
parameters from the normalized difference vegetation index (NDVI) time series
data, with the following formula:
Table 1 Metadata summary of the Vegetation
phenology dataset based on MOD13Q1 in Mongolia (2001–2019)
|
Items
|
Description
|
|
Dataset full name
|
Vegetation phenology
dataset based on MOD13Q1 in Mongolia (2001–2019)
|
|
Dataset short name
|
VPD_Mongolia_2001–2019
|
|
Authors
|
Shao, Y. T. Institute of
Geographic Sciences and Natural Resources Research, CAS, shaoyt@lreis.ac.cn
Wang, J. L. R8881-2016, Institute of Geographic Sciences and Natural
Resources Research, CAS, wangjl@igsnrr.ac.cn
|
|
Geographical region
|
41??35??N–52??09??N, 87??44??E–119??56??E
|
|
Year
|
2001–2019
|
|
Temporal resolution
|
Year
|
|
Spatial resolution
|
250 m
|
|
Data format
|
.tif
|
|
Data size
|
944 MB (844 MB, after compression)
|
|
Data files
|
The dataset
contains 60 documents, including the 19-year annual data of the start of
growing season, end of growing season, length of growing season and the mean
value of 19-year vegetation phenological period in Mongolia
|
|
Foundation item
|
National Natural
Science Foundation of China (32161143025, 41971385); Chinese Academy of
Sciences (XDA2003020302)
|
|
Computing environment
|
ENVI, ArcGIS
|
|
Data publisher
|
Global Change
Research Data Publishing & Repository, http://www.geodoi.ac.cn
|
|
Address
|
No. 11 A Datun
Road, Chaoyang District, Beijing 100101, China
|
|
Data
sharing policy
|
Data from the Global Change Research Data
Publishing & Repository includes metadata, datasets (in the Digital Journal of Global
Change Data Repository), and publications (in the Journal of Global
Change Data & Discovery).
Data sharing
policy includes: (1) Data are openly available and can
be free downloaded via the Internet; (2) End users are encouraged to use Data
subject to citation; (3) Users, who are by definition also value-added
service providers, are welcome to redistribute Data subject to written
permission from the GCdataPR Editorial Office and the issuance of a Data
redistribution license; and (4) If Data are used to compile new
datasets, the ??ten per cent principal?? should be followed such that Data
records utilized should not surpass 10% of the new dataset contents, while
sources should be clearly noted in suitable places in the new dataset[12]
|
|
Communication and searchable system
|
DOI, CSTR, Crossref, DCI, CSCD, CNKI, SciEngine, WDS/ISC, GEOSS
|
 (1)
(1)
where NDVIratio is the threshold ratio, NDVIt is the NDVI value at t time, NDVImax
is the maximum value of NDVI in a year, and NDVImin is the minimum
value of NDVI in the process of rising (or falling). The difference between
NDVImax and NDVImin represents the change in NDVI
amplitude in the stage of vegetation growth or decline, and t is the Julian day
(d).
(2) Trend analysis
The trend analysis method[14] was
used to analyze the temporal and vegetation phenology data to obtain the change
trend of vegetation phenology in Mongolia from 2001 to 2019 using, the
following formula:
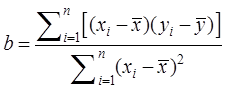 (2)
(2)
where b is the change trend, b<0 indicates that the vegetation
phenological period is advanced, b >0 indicates that the vegetation
phenological period is delayed, and xi is the year, with the
values 1, 2, 3??19 representing 2001, 2002, 2003??2019 respectively. yi
is the phenological data of different years, `x is 10,`y is the multi-year mean value of phenological
data, and n is the number of samples
(here n = 19).
3.2 Technical Route
The main
process for the dataset development include: MODIS data preprocessing,
time-series data fitting and reconstruction, extraction of vegetation phenology
parameters, and vegetation phenology temporal and spatial change analysis, as
shown in Figure 1.
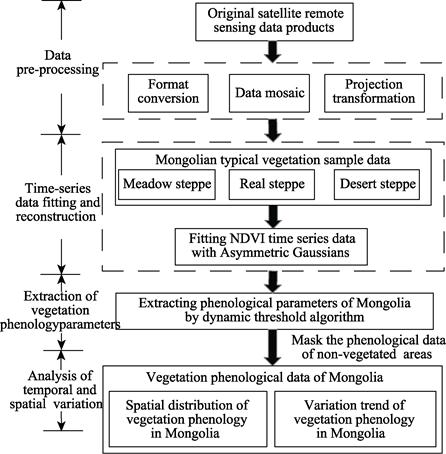
Figure 1 Research and
development process of the Mongolian vegetation phenology dataset
(1) Data pre-processing
The original satellite remote
sensing data product MOD13Q1 in this dataset is in the international standard
Hierarchy Data Format (HDF). The MODIS Reprojection Tool software is used to
perform data format conversion, data mosaic, projection transformation and
other pre-processing operations on the original data products and finally
extract the NDVI data in Geotiff format. Before extracting vegetation
phenological data, pixels with NDVI value less than 0.1 were removed. Areas
with very low NDVI values are usually called non-vegetated areas[15].
(2) Time-series data fitting and reconstruction
To suppress the influence of
noise on NDVI time-series data, it is necessary to filter and smooth the data[14].
First, the pre-processed MODIS-NDVI data was loaded in the TIMESAT data import
interface, after which samples of different grassland types were obtained
according to the Mongolian land cover classification data[16],
Google image data and field survey sample point data. Finally, the asymmetric
Gaussians (A-G) model was used to filter and smooth the NDVI time series data
in the sample area[14], obtain the vegetation growth season curve
with good quality, and then fit and reconstruct the NDVI time series data of
Mongolia.
(3) Extraction of vegetation phenology parameters
Many scholars have used the
dynamic threshold method to extract phenology data. Cong and Shen[17]
set the threshold to 0.5 to extract vegetation phenology in the middle and high
latitudes of the Northern Hemisphere. Zu et
al.[18] found that thresholds of 0.2 and 0.3 can better extract
the vegetation phenology of the Qinghai-Tibet Plateau. Fu et al.[19] set thresholds of 0.2 and 0.5, respectively,
to extract the beginning and end of vegetation growth season in Qaidam Basin.
Huang et al.[20] compared
the extraction results of vegetation phenology in Inner Mongolia when the
thresholds were 0.2, 0.3, 0.4 and 0.5, and finally selected 0.5. Due to the
lack of long-term series of phenological ground observation data in Mongolia,
based on previous studies, the dataset thresholds were first set as 0.1, 0.15,
0.2, 0.25, 0.3, 0.35, 0.4, 0.45, 0.5, and 0.55, to extract phenological
information of typical grassland and forest vegetation in Mongolia. It was
found that the results of SOS and EOS were more effective when the threshold
was 0.5 and 0.55. Therefore, based on the TIMESAT platform, the dynamic
threshold method was used to set the thresholds to 0.5 and 0.55, respectively,
to extract the SOS and EOS of vegetation in Mongolia. When NDVI reaches 50% of
the amplitude change in the process of NDVI rising, vegetation begins to turn
green, and the date corresponding to this pixel value is the SOS. When NDVI
reaches 55% of the amplitude change during the NDVI decline process, the
vegetation begins to turn yellow, and the date corresponding to the pixel value
is considered to be the EOS. Since non-vegetated areas (including water,
barren, desert, build area, and sand) are meaningless for the study of
phenology, the phenological data of all non-vegetated areas were masked in
combination with the land cover data of Mongolia to obtain Mongolian vegetation
phenology data.
4 Data Results and Validation
4.1 Data Composition
The vegetation phenology dataset based on
MOD13Q1 in Mongolia (2001–2019) includes 60 documents which includes SOS, EOS
and LOS (Table 2).
Table
2 List of files in the ??Time series of land
surface phenology dataset in Central Asia (1982–2015)??
|
Composition file
|
Naming method
|
Description
|
Format
|
Number of files
|
Data size
|
|
Phenological
raster data
|
VPD_SOSyyyy.tif
|
SOS
|
.tif
|
19
|
280 MB
|
|
VPD_EOSyyyy.tif
|
EOS
|
.tif
|
19
|
280 MB
|
|
VPD_LOSyyyy.tif
|
LOS
|
.tif
|
19
|
347 MB
|
|
VPD_SOSmean.tif
|
19-year mean value of SOS
|
.tif
|
1
|
11.3 MB
|
|
VPD_EOSmean.tif
|
19-year mean value of EOS
|
.tif
|
1
|
11.0 MB
|
|
VPD_LOSmean.tif
|
19-year mean value of LOS
|
.tif
|
1
|
12.7 MB
|
In this dataset, the
data formats of SOS, EOS and LOS were set as VPD_SOSyyyy.tif, VPD_EOSyyyy.tif,
and VPD_LOSyyyy.tif, respectively. VPD (Vegetation Phenology
Dataset) represents the
vegetation phenology data and yyyy represents the year of
the data file.
4.2 Data Results
The dynamic threshold method was used to
extract the annual vegetation phenology dataset of Mongolia from 2001 to 2019,
and to calculate the 19-year average vegetation phenology data. It was found
that the vegetation of Mongolia began to turn green from early April to late
May, and began to turn yellow from mid-September to late October. That is
consistent with the research findings of Bi[21] and Sun et al.[22] in Mongolian
permafrost regions of grassland vegetation in the SOS and EOS. Thus, the
vegetation growing season in Mongolia lasts about 165 days on average. By
analyzing this dataset, we can understand the spatial distribution
characteristics of vegetation phenology in Mongolia. As shown in Figure 2, its
spatial distribution characteristics are similar to the research findings of Li[23]
and Jiang[24] on the Mongolian Plateau. Under the influence of
geographical elements such as precipitation, air temperature, surface
temperature, topographic elements, and snow depth and so on, there are obvious
differences in the distribution characteristics of vegetation phenology in
different regions.
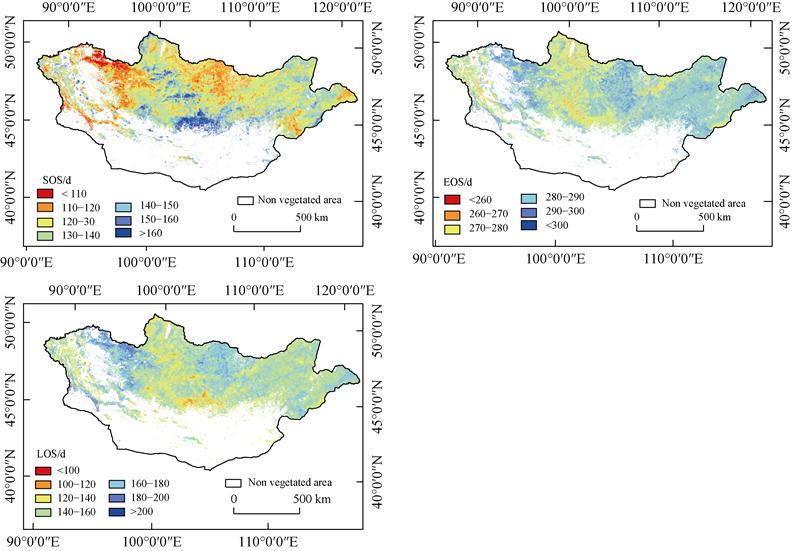
Figure 2 Spatial distribution of vegetation phenology in
Mongolia from 2001 to 2019
The trend line analysis method was used to
analyze the changes in vegetation phenology
in Mongolia from 2001 to 2019. It can be seen
that the overall trend of vegetation SOS in Mongolia is typically delayed,
which is consistent with the same as the research findings of Jiang et al.[25]. The vegetation
EOS showed an advancing trend and the vegetation LOS showed a decreasing trend.
Affected by extreme climate events, the trend of vegetation phenology changes
abruptly in a certain region at a certain time, and grassland vegetation
phenology in the typical transitional region of Mongolia is quite different[7].
4.3 Data Validation
The
analysis of the data in the above section shows that this dataset is consistent
and comparable with the research findings of some scholars. At present, few
field observation sites and remote-sensing phenological data products are
available in Mongolia. The Terra/MODIS NDVI data product MCD12Q2 provides a
global surface phenological dataset with a spatial resolution of 500 m, which
is one of the few publicly published phenological datasets worldwide.
Therefore, the quality of this dataset was evaluated based on the MCD12Q2 data
product and the phenological studies conducted by other scholars in Mongolia.
MCD12Q2 data were downloaded from NASA??s official website and pre-processed to
obtain the phenological data of SOS and EOS in Mongolia. This dataset was
resampled to obtain phenological data consistent with the spatial resolution
and projection of MCD12Q2, and linear correlation analysis was conducted. The
results showed that the correlation coefficient between SOS was 0.570,86, and
the correlation coefficient between the EOS was 0.550,38, both of which passed
the p<0.001 significance test.
Therefore, the dataset was comparable and positively correlated with MCD12Q2, as
shown in Figure 3. The product of the dataset is a 16-d composite with a
spatial resolution of 250 m, but MCD12Q2 is an 8-d composite with a spatial
resolution of 500 m. Generally speaking, inconsistencies are expected in the
accuracy, temporal and spatial resolution, temporal continuity, and data
processing methods of remote sensing data products, and the phenological values
of the same location obtained at the same time cannot be completely consistent[6,26].
There were some errors, but the threshold range of the phenological period was
relatively consistent.
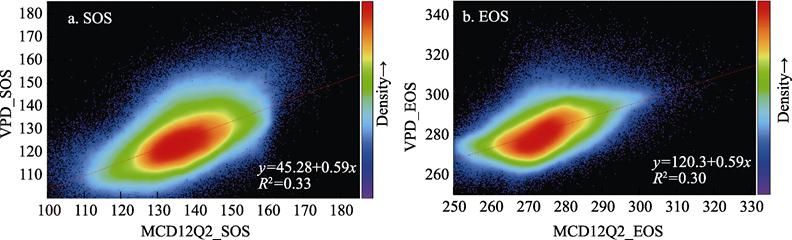
Figure 3 Correlation analysis between vegetation phenology data in this dataset
and MCD12Q2 phenology products (Note: VPD_SOS, the SOS in this dataset; VPD_EOS, the
EOS in this dataset)
5 Discussion
and Conclusion
Mongolia is an important and
unique geographical location, and its vegetation distribution has been affected
by climate change and human activities on the Mongolian Plateau for a long
period of time. The interannual trend variation of Mongolian vegetation
phenology was evaluated using a trend analysis, where in the vegetation
phenological dataset from 2001 to 2019, including the 19-year average annual
distribution map, were derived from the time-series MODIS image data based on
remote sensing. Results showed that the average start of growing season (SOS)
of Mongolian vegetation was 110–150 days with a general pattern of delay,
whereas the end of growing season (EOS) had an average of 270–300 days but with
earlier onset patterns. The length of growing season (LOS) ranged between
120–200 days with general shortening patterns, such that the maximum shortened
time was two days. As phenological characteristics of different Mongolian
grasslands vary, the LOS of the desert grassland vegetation particularly had
the highest LOS. The spatial distribution of vegetation phenology in the area
was found to be highly responsive to terrain, precipitation, and surface
temperature, especially in areas with sparse vegetation. For instance, SOS
occurred the earliest southwest Mongolia due to its characteristics of high
temperature and relatively low precipitation. Meanwhile, SOS would tend to be
delayed with surface temperature increases, similar to that of EOS which would
normally occur late in this region, leading to the extension of LOS. This
dataset enables a comprehensive understanding of the characteristics of
vegetation phenology changes in Mongolia, which in turn allows us to analyze
the response of vegetation phenology to climate change under the influence of
extreme drought and cold climate, thus providing basic data for the study of
climate change in Mongolia. In the future, more multi-source remote sensing and
ground data can be combined to obtain additional phenological datasets of the
Mongolian Plateau.
Author
Contributions
Wang, J. L. developed the
total design of the experiment and final dataset; Shao, Y. T. is responsible
for the collection, processing and verification of MODIS13Q1 data; Wang, J. L.,
and Shao, Y. T. jointly wrote the paper.
Conflicts of Interest
The
authors declare no conflicts of interest.
References
[1]
Wang, Z., Chen, J., Xing, F., et al. Response of cotton phenology to climate change on the North
China Plain from 1981 to 2012 [J]. Scientific
Reports, 2017, 7: 6628. https://doi.org/10.1038/s41598-017-07056-4.
[2]
Wang, J., Xi, Z., He, X., et
al. Contrasting temporal variations in responses of leaf unfolding to
daytime and nighttime warming [J]. Global
Change Biology, 2021, 27(20): 5081–5093..
DOI:10.1111/gcb.15777.
[3]
Liu, X., Chen, Y., Li, Z., et
al. Driving forces of the changes in vegetation phenology in the
Qinghai-Tibet Plateau [J]. Remote Sensing,
2021, 13: 4952. https://doi.org/.10.3390/rs13234952.
[4]
Liu, H., Wang, H., Li, N., et al. Phenological mismatches between
above- and belowground plant responses to climate warming [J]. Nature Climate Change, 2022, 12: 97–102.
https://doi.org/10.1038/s41558-021-01244-x.
[5]
Miao, L. J., Muller, D., Cui, X. F., et al. Changes in vegetation phenology on the Mongolian Plateau and
their climatic determinants [J]. PLoS One,
2017, 12(12): e0190313. DOI: 10.1371/journal.pone.0190313.
[6]
Dugarsuren, N., Lin, C. Investigation of vegetation dynamics
of Mongolia using time series of NDVI in response to temperature and
precipitation [J]. Mongolian Journal of
Biological Sciences, 2011, 9(1/2): 9–17. DOI: 10.22353/mjbs.2011.09.02.
[7]
Dugarsuren, N., Lin, C. Temporal variations in phenological
events of forests, grasslands and desert steppe ecosystems in Mongolia: a
remote sensing approach [J]. Annals of
Forest Research, 2016, 59(2): 175–190. DOI: 10.15287/afr.2016.400.
[8]
Schulz, C., Koch, R., Cierjacks, A., et al. Land change and loss of landscape diversity at the Caatinga
phytogeographical domain: analysis of pattern-process relationships with MODIS
land cover products (2001–2012) [J]. Journal
of Arid Environments, 2017, 136: 54–74.
[9]
Zhou, W., Gang, C., Zhou, L., et al. Dynamic of grassland vegetation degradation and its
quantitative assessment in the northwest China [J]. Acta Oecologica, 2014, 55(2):86–96.
[10]
Zhou, W., Gang, C., Chen, Y., et al. Grassland coverage inter-annual
variation and its coupling relation with hydrothermal factors in China during
1982–2010 [J]. Journal of Geographical
Sciences, 2014, 24(4): 593–611.
[11] Shao, Y. T., Wang, J.
L. Vegetation phenology
dataset based on MOD13Q1 in Mongolia (2001–2019) [J/DB/OL].
Digital Journal of Global
Change Data Repository, 2022. https://doi.org/10.3974/geodb.2022.03.05.V1. https:// cstr.escience.org.cn/CSTR:20146.11.2022.03.05.V1.
[12] GCdataPR Editorial Office. GCdataPR data sharing policy [OL].
https://doi.org/10.3974/dp.policy. 2014.05 (Updated 2017).
[13]
Wu, C., Wang, X., Wang, H., et al. Contrasting responses of
autumn-leaf senescence to daytime and night-time warming [J]. Nature Climate Change, 2018, 8:
1092–1096. https://doi.org/10.1038/s41558-018-0346-z.
[14]
Shao, Y. T., Wang, J. L., Yan, X. R. The phenological
characteristics of Mongolian vegetation and its response to geographical
elements [J]. Geographical Research,
2021, 40(11): 3029–3045.
[15]
Clinton, N., Yu, L., Fu, H. H., et al. Global-scale associations of vegetation phenology with
rainfall and temperature at a high spatial-temporal resolution [J]. Remote Sensing, 2014, 6(8): 7320–7338.
[16]
Wang, J., Wei, H., Cheng, K., et al. Updatable dataset revealing decade changes in land cover
types in Mongolia [J]. Geoscience Data
Journal, 2022, 00: 1–14. DOI: 10.1002/gdj3.149.
[17]
Cong, N., Shen, M. G. Variation of satellite-based spring
vegetation phenology and the relationship with climate in the Northern
Hemisphere over 1982 to 2009 [J]. Chinese
Journal of Applied Ecology, 2016, 27(9): 2737–2746.
DOI:10.13287/j.1001-9332.201609.028.
[18]
Zu, J. X., Zhang, Y. J., Huang, K., et al. Biological and climate factors co-regulated spatial-temporal
dynamics of vegetation autumn phenology on the Tibetan Plateau [J]. International Journal of Applied Earth
Observation and Geoinformation, 2018, 69: 198–205.
[19]
Fu, Y., Chen, H., Zhang, S. Q., et al. Phenological characteristics of alpine arid region based on
biome type and its responses to climate factors: a case study of Qaidam Basin
from 2000 to 2019 [J]. Geographical
Research, 2021, 40(1): 52–66. DOI: 10.11821/dlyj020200327.
[20]
Huang, W. L., Zhang, Q., Kong, D. D., et al. Response of vegetation phenology to drought in Inner
Mongolia from 1982 to 2013 [J]. Acta
Ecologica Sinica, 2019, 39(13): 4953–4965.
[21]
Bi, Z. R. Temporal and spatial changes of snow depth in
Mongolia plateau and its impact on grassland vegetation phenology [D]. Hohhot:
Inner Mongolia Normal University, 2020: 40–42.
[22]
Sun, Z. G., Wang, Q. X., Xiao, Q. G., et al. Diverse responses of remotely sensed grassland phenology to
interannual climate variability over frozen ground regions in Mongolia [J]. Remote Sensing, 2015, 7(1): 360–377.
DOI: 10.3390/rs70100360.
[23]
Li, C. H., Study on the variation of snow cover and its impact
on grassland vegetation phenology in Mongolian Plateau [D]. Hohhot: Inner
Mongolia Normal University, 2019: 76–79.
[24]
Jiang, K. Changes in phenology and their main factors in the
grassland of China-Mongolia border [D]. Hohhot: Inner Mongolia Normal
University, 2020.
[25]
Jiang, K., Bao, G., Ulantuya., et al. Variations in spring phenology of different vegetation types
in the Mongolian plateau and its responses to climate change during 2001–2017
[J]. Chinese Journal of Ecology,
2019, 38(8): 2490–2499. DOI: 10.13292/j.1000-4890.201908.027.
[26] Li, Z., Bo, Y. C.,
He, Y. Q. Comparison of natural vegetation phenology metrics from remote
sensing LAI products [J]. Remote Sensing
Technology and Application, 2015, 30(6):1103–1112.