Dataset
of Tourism Geography Sentiment Evaluation Model Application in Cities of
Greater Bay Area of China (2008-2021)
Liu, Y.1, 2 Chen,
H. L.1 Xiao, W. J. 1,
3* Bao J. G.1 Wu, X. H.1 Xu, J. L.1
1. School
of Tourism Management, Sun Yat-sen University, Guangzhou 510275, China;
2. Key
Laboratory of Intelligent Assessment Technology for Sustainable Tourism,
Ministry of Culture and Tourism, Zhuhai 519080, China;
3. School of Tourism, Jishou University, Zhangjiajie
427000, China
Abstract:
The evaluation of tourist sentiment can play a crucial role in informing
decision-making processes for tourism destinations. This study introduces the
Tourism Sentiment Evaluation (TSE) model and application platform, which was
developed through the creation of a tourism-specific sentiment lexicon, the
establishment of semantic rules, and the selection of a sentiment rectifier.
This study introduces a novel methodology and a novel instrument for assessing
the sentiment of tourist destination. To gather data for the TSE model, we
employed online review data sourced from prominent tourism websites including
Tripadvisor, Mafengwo, and Ctrip. In this study, we conducted a collection of
online reviews pertaining to 11 cities within the Guangdong-Hong Kong-Macao
Greater Bay. The dataset was gathered from the years 2008 to 2021, utilizing an
application platform to obtain a comprehensive dataset for sentiment evaluation
of these cities. The dataset consists of fifteen data files, encompassing
various aspects such as the ranking of attention and reputation for eleven
cities, the differences in attention and reputation rankings specifically for
cities in the Greater Bay Area, overall sentiment analysis of the Greater Bay
Area and sentiment analysis for individual cities including Hong Kong, Macao,
Guangzhou, Shenzhen, Zhuhai, Foshan, Huizhou, Dongguan, Zhongshan, Jiangmen,
Zhaoqing. The dataset is archived in .xlsx format with data size of 34 KB.
Keywords: sentiment evaluation; tourism
destination; TSE model; reputation
DOI: https://doi.org/10.3974/geodp.2023.01.14
CSTR: https://cstr.escience.org.cn/CSTR:20146.14.2023.01.14
Dataset Availability Statement:
The dataset supporting this paper
was published and is accessible through the Digital Journal of Global Change Data Repository
at: https://doi.org/10.3974/geodb.2023.05.06.V1
or https://cstr.escience.org.cn/CSTR:20146.11.2023.05.06.V1.
1 Introduction
The
evaluating of tourism destinations plays a crucial role in uncovering their
level of development and competitive environment[1].
Therefore, the evaluation results have garnered attention from various sectors[2]. The utilization of
questionnaires as the primary method in traditional evaluation models
frequently leads to diminished efficiency[3].
The proliferation of online reviews generated by mobile devices has emerged as
a novel data source for assessing tourism destinations. Nevertheless, the
extraction of preference and other pertinent information from this data source
continues to present a significant obstacle[4].
As a response, our research team has successfully developed the Tourism
Sentiment Evaluation (TSE) model application platform. Additionally, we have
created a dataset of sentiment evaluation specifically tailored to cities
within Guangdong-Hong Kong-Macao Greater Bay Area. This development is based on
principles of emotion classification theory and utilizes vocabulary matching
technology. The model exhibits strong reliability[4]
and demonstrates a high level of accuracy[5]. It has been
successfully applied in the evaluation of tourism destination [4],
the capture of urban tourism images[6],
and the measurement of spatial structure within tourism market[7].
In addition, the TSE model application platform demonstrates suitability for
various geographic application scenarios, including the analysis of tourism
spatio-temporal behaviors and the investigation of mechanisms underlying
human-land interaction.
2 Metadata of the Dataset
The metadata of the Dataset is summarized in Table 1.
3 TSE Model Application Platform
3.1 Overview of TSE Model Application
Platform
The
application platform utilizes the Tourism Sentiment Evaluation (TSE) model as
its central framework and relies on large-scale reviews from big data as its
primary data source. This model has the potential to be utilized in diverse
geographical contexts, such as the assessment of tourism destinations and other
similar scenarios.
3.2 The Building of the TSE model
The building of the TSE model
comprises three distinct steps[4].
(1) The creation of a sentiment lexicon
tailored specifically for the tourism industry. We conducted a manual deep
reading of travel logs and online reviews written by tourists. Through this
process, we identified and extracted the most frequently used words that
tourists employ to convey their sentiments. The newly introduced terms were
subsequently incorporated into the sentiment lexicon of HowNet, which is a
publication by the China National Knowledge Infrastructure (CNKI). The outcome
of this procedure led to the creation of a sentiment lexicon specifically
tailored for the domain of tourism. This lexicon consists of 3,507 positive
words and 3,365 negative words.
(2) Establishing semantic rules. We have set 32
semantic rules by examining the roles of adverbs of degree, adverbs of denial,
and adversative conjunctions in influencing sentiment tendencies, when combined
in sentence patterns. The specific rules are outlined in the citation provided
as reference[4].
(3) Choosing a sentiment rectifier. The statistical
data obtained from questionnaires administered by the World Tourism
Organization (UNWTO) was employed to validate the robustness of our
methodology. Based on our analysis, it has been determined that the ideal value
for sentiment rectifier in the TSE model is 4. In essence, evaluations will be
deemed favorable solely if the quantity of positive lexemes exceeds the
quantity of negative lexemes by a factor of four or more.
Table 1 Metadata summary of the Dataset[8]
|
Items
|
Description
|
|
Dataset full name
|
Dataset of tourism geography sentiment evaluation model in cities of
Greater Bay Area of China (2008-2021)
|
|
Dataset short name
|
DataSenEvaCitiesGBA_2008-2021
|
|
Authors
|
Liu, Y., Sun Yat-sen University; Key Laboratory of Intelligent Assessment
Technology for Sustainable Tourism, Ministry of Culture and Tourism;
liuyi89@mail.sysu.edu.cn
Chen, H. L., Sun Yat-sen University ,chenhlong5@mail2.sysu.edu.cn
Xiao, W. J., Sun Yat-sen University, School of Tourism;Jishou University;
xiaowj7@mail2.sysu.edu.cn
Bao, J. G., Sun Yat-sen University, eesbjg@mail.sysu.edu.cn
Wu, X. H., Sun Yat-sen University, wuxh68@mail2.sysu.edu.cn
Xu, J. L., Sun Yat-sen University, xujli3@mail2.sysu.edu.cn
|
|
Geographical region
|
Hong Kong, Macao, Guangzhou, Shenzhen, Zhuhai, Foshan, Huizhou, Dongguan,
Zhongshan, Jiangmen, and Zhaoqing
|
|
Year
|
2008-2021 Data
format .xlsx Data
size 34 KB
|
|
Data files
|
(1) The rankings of the attention scores of 11 cities; (2) The rankings
of the reputation scores of 11 cities; (3) The disparities in attention and
reputation rankings among cities; (4) The emotional images of the Greater Bay
Area and 11 cities during the specified period
|
|
Data publisher
|
Global Change Research Data Publishing & Repository,
http://www.geodoi.ac.cn
|
|
Address
|
No. 11A, Datun Road, Chaoyang District, Beijing 100101, China
|
|
Data sharing policy
|
Data from the Global
Change Research Data Publishing & Repository includes metadata, datasets (in the Digital Journal of Global Change Data Repository), and
publications (in the Journal of Global Change Data & Discovery). Data sharing policy includes: (1) Data are openly
available and can be free downloaded via the Internet; (2) End users are
encouraged to use Data subject to citation; (3) Users, who are by definition
also value-added service providers, are welcome to redistribute Data
subject to written permission from the GCdataPR Editorial Office and the
issuance of a Data redistribution license; and (4) If Data are used to
compile new datasets, the ‘ten per cent principal’ should be followed such
that Data records utilized should not surpass 10% of the new
dataset contents, while sources should be clearly noted in suitable places in
the new dataset[9]
|
|
Communication and searchable system
|
DOI, CSTR, Crossref, DCI, CSCD, CNKI,
SciEngine, WDS/ISC, GEOSS
|
3.3 The
Primary Functionalities of the TSE Model Application Platform
The application platform
primarily encompasses two fundamental functionalities, namely sentiment
computation and co-occurrence analysis. The process of sentiment analysis can
be accomplished using the semantic model. The algorithm can be described as follows[5]:
When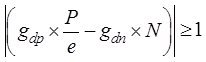 and
and is the firstly-appeared adversative conjunctions, then adopt Equation
(1) to calculate sentiment score of the text.
is the firstly-appeared adversative conjunctions, then adopt Equation
(1) to calculate sentiment score of the text.
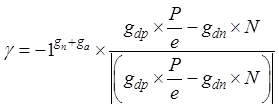 (1)
(1)
When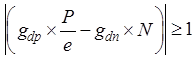 andis the secondly-appeared adversative conjunctions, then adopt
Equation (2) to calculate sentiment score of the text.
andis the secondly-appeared adversative conjunctions, then adopt
Equation (2) to calculate sentiment score of the text.
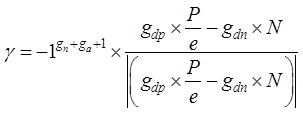 (2)
(2)
When , then adopt Equation 3 to calculate sentiment score of the text.
 (3)
(3)
Among these,  is the sentiment
score of the text, including 1 (positive), -1 (negative), 0 (neutral).
is the sentiment
score of the text, including 1 (positive), -1 (negative), 0 (neutral).  is the number of adverbs of denial,is the number of adversative conjunctions,
 is the number of adverbs of degree before positive words,
 is the number of adverbs of degree before negative words, P is the number of positive words, N is the number of negative words, e
is the sentiment rectifier.
is the number of adverbs of degree before negative words, P is the number of positive words, N is the number of negative words, e
is the sentiment rectifier.
The co-occurrence function is responsible for producing
a co-occurrence matrix and an adjacency matrix of keywords, which is derived
from the keywords inputted by users.
4 Data Development
4.1 Data Capture
Based on criteria such as
popularity, the abundance of comments, user engagement, and the length of
comments, the data sources selected for this study are Maotuying, Mafengwo and
Ctrip. The objective is to gather tourism reviews from 11 cities covering the
period from 2008 to 2021 by python. The collected data will include information
such as the time of the review, the content of the review, the review score,
and other relevant fields.
4.2 Attention and Reputation Calculation
Utilize sentiment analysis
methodology to derive sentiment classification (negative, neutral or positive)
for individual reviews across 11 cities spanning the time from 2008 to 2021.
The quantity of comments is considered as a measure of attention, the ratio of
positive comments is considered as an indicator of reputation, and the
sentiment of tourism reviews is assessed on an annual basis. Based on the
classification outcomes, the study has obtained data on the variations in
attention, reputation and ranking among 11 cities.
4.3 Emotional Image
Based on the sentiment
analysis outcomes, the positive and negative comments from 11 cities were
utilized as the primary data source. The high-frequency word analysis function
was employed to identify the most commonly occurring words associated with
positive and negative sentiments. From this analysis, a keyword file was
created, consisting of the top 200 high-frequency words. Subsequently, the
co-occurrence analysis function was utilized to construct an adjacency matrix,
representing the relationships between high-frequency words. Finally, Gephi was
employed to visualize emotional image of the 11 cities for each year.
5 Data Results and Verification
5.1 Data Composition
The dataset comprises a total
of 15 tables, including the rankings of the attention scores of 11 cities, the rankings
of the reputation scores of 11 cities, the highlights variations in attention
and reputation rankings across cities, a comprehensive emotional portrayal of
the Greater Bay Area during this specified timeframe, and the emotional
depiction of the cities such as Hong Kong, Guangzhou, Zhuhai, Foshan, Huizhou,
Dongguan, Zhongshan, Jiangmen, Zhaoqing.
5.2 Data Results
The rankings of attention
among the 11 cities exhibited substantial fluctuations prior to 2016, but
subsequently reached a state of stability (Figure 1). Guangzhou, Shenzhen,
Foshan, Huizhou, Zhaoqing, Zhongshan and Jiangmen have exhibited a consistent
stable pattern in their rankings of attention since the year 2014. Guangzhou
exhibited a persistent high ranking, whereas
Zhaoqing, Zhongshan and Jiangmen consistently maintained low rankings. Both
Hong Kong and Macao underwent a significant decrease.
|
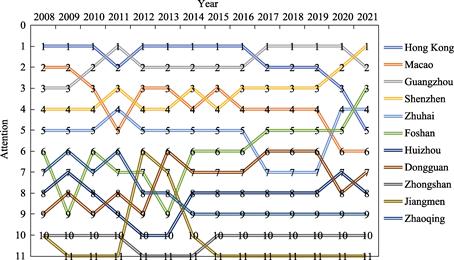
Figure 1 The
dynamics of attention ranking of cities within the Greater Bay Area from 2008
to 2021[10]
|
Based on analysis of the data, it is evident that the
reputation levels of 11 cities over a span of
14 years have exhibited fluctuations and overall upward trends (Figure 2). The
reputation exhibited significant fluctuations between the years 2008 and 2013,
followed by a consistent upward trend from 2014 to 2021. With the exception of
Jiangmen and Huizhou, the remaining nine cities exhibited reputation levels
surpassing 0.80 in the year 2018 and
subsequent years. Moreover, the levels of reputation in Macao have consistently
remained at a high level, exhibiting stability comparable to that of
Hong Kong and Zhongshan.
|
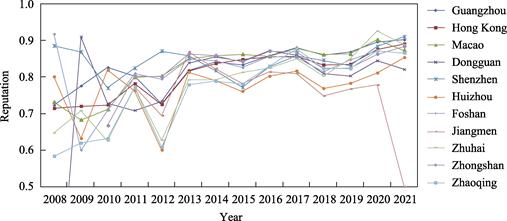
Figure 2 The
reputation ranking of cities within the Greater Bay Area from 2008 to 2021[6,
10]
|
Guangzhou was selected as the focal point for examining
the emotional portraits, specifically in relation to positive and negative
reviews. Based on the analysis of Figure 3, it becomes apparent that the
positive feedback from visitors to Guangzhou primarily revolves around tourist
attractions and infrastructure. The overall depiction of the city encompasses
its picturesque landscapes, favorable ecological conditions, and the rich cultural
legacy spanning a millennium in the Lingnan capital. This collective portrayal
accentuates the city’s identity as a floral metropolis that harmoniously
amalgamates contemporary elements with historical significance. In contrast,
negative feedback, on the predominantly revolves around dissatisfaction with
development of tourist attraction and the accompanying facilities.
Significantly, the issue of overcrowding on cruise ships, limited diversity in
entertainment offerings, concerning sanitation conditions, expensive and
unappealing food options, inadequate parking facilities, and challenges in
locating affordable parking spaces are noteworthy concerns.
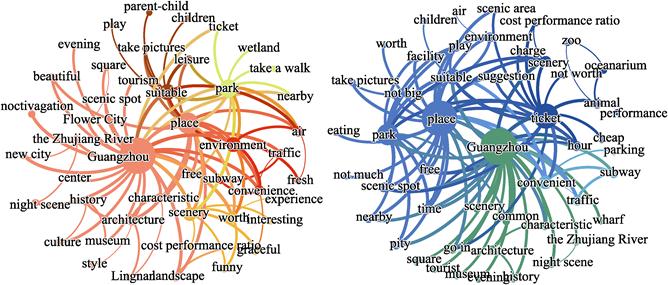
Figure 3 Positive and negative emotional
images of Guangzhou tourists [10]
5.3 Data Verification
This study utilizes the statistical data obtained from questionnaires
administered by the World Tourism Organization (UNWTO) over a period of 10
years in order to validate its findings. The findings confirm that TSE model
demonstrates a significant level of reliability. For a more comprehensive
understanding of the results, please consult the relevant literature [4].
In contrast to the other six machine learning models,
the TSE model exhibits consistent accuracy. A comprehensive analysis of the
specific outcomes can be accessed in the relevant academic literature[5].
6 Discussion and Conclusion
The dataset provides a
comprehensive overview of the impact and perception of cities within the
Greater Bay Area. It sheds light on the competitive landscape among the 11 cities in the region and highlights the key factors
that concern tourists. A decision-making framework can be established to
guide the management of the tourism destination.
Author Contributions
Liu, Y., Chen, H. L., Xiao, W. J. and Bao, J. G. designed
the development of the dataset; Wu, X. H. and Xu, J. L. collected and processed
the data such as original reviews and reputation; Liu, Y. and Xiao, W. J.
designed the model and algorithm; Xiao, W. J. conducted data verification;
Chen, H. L., Xiao, W. J. and Wu, X. H. wrote the paper; Liu, Y. and Bao, J. G.
participate in the revision of the paper.
Conflicts
of Interest
The authors
declare no conflicts of interest.
References
[1]
Gong, J., Yang, S. Y. Study on tourism destination evaluation
based on web reviews—taking 31 provinces in China for example [J]. Journal
of central China Normal University (Natural
Science), 2018, 52(2): 279‒286.
[2]
Shi, C. Y., Zhang, J., Shen, Z. P., et al. Review of the studies on the tourism spatial competition and
cooperation [J]. Geography and Geo-Information Science, 2005(5): 85‒89.
[3]
Zhen, F., Wang, B. Rethinking human geography in the age of
big data [J]. Geographical Research, 2015, 34(5): 803‒811.
[4]
Liu, Y., Bao, J. G., Zhu, Y. L. Exploring emotion methods of
tourism destination evaluation: a big-data approach [J]. Geographical
Research, 2017, 36(6): 1091‒1105.
[5]
Liu, Y., Meng, L. K., Bao, J. G., et al. A comparative study of sentiment computing methods: will
machine learning be overwhelming? [J]. Nankai Business Review, 2021,
24(5): 63‒74.
[6]
Liu, Y., Xu, X. J., Zhao, Y. Analysis on characteristics and
differences of tourism destination image based on TSE and IPA Model—the case of
Guangdong province [J]. Tourism Forum, 2019, 12(6): 41‒49.
[7]
Liu, Y., Chen, H. L., Cao, Y. H. Analysis and theoretical
modification of the spatial structure of tourist source market based on tourism
review data [J]. World Regional Studies, 2023, 32(5):113‒124.
[8]
Liu, Y, Chen, H. L., Xiao, W. J., et al. Dataset of tourism geography sentiment evaluation model in cities
of Greater Bay Area of China (2008-2021) [J/DB/OL]. Digital
Journal of Global Change Data Repository,
2023. https://doi.org/10.3974/geodb.2023.05.06.V1. https://cstr.escience.org.cn/CSTR:20146.11.2023.
05.06.V1.
[9]
GCdataPR Editorial Office. GCdataPR data sharing policy [OL].
https://doi.org/10.3974/dp.policy.2014.05 (Updated 2017).
[10] Liu, Y., Lin, X. Y., Zhang, T., et al. Report on Sentiment Analysis of
Tourists in Guangdong-Hong Kong-Macao Greater Bay Area based on Big Data (2021)
[M]. Xu, H. G., Bao, J. G. Blue Book of Guangdong-Hong Kong-Macao Greater Bay
Area: Report on Tourist Industry of Guangdong-Hong Kong-Macao Greater Bay Area
in China. Beijing: Social Sciences
Academic Press, 2022: 168‒210.