Spatial Differentiation and Influencing Factors Dataset of Housing Rents
in the Guangdong-Hong Kong-Macao Greater Bay Area
Wang,
Y.1* Wu, K. M.2,3 Zhang, H. O.2,3 Yue, X. L.2,4
1. Faculty of Geography, Yunnan Normal
University, Kunming 650500, China;
2. Guangzhou Institute of Geography, Guangdong Academy of
Sciences, Guangzhou 510070, China;
3. Institute of Strategy Research for Guangdong-Hong Kong-Macao
Greater Bay Area, Guangzhou 510070, China;
4. School of Architecture and Urban Planning,
Guangdong University of Technology, Guangzhou 510090, China
Abstract: Research on
housing rents and influencing factors in the Guangdong-Hong Kong- Macao Greater
Bay Area (GBA) is of great interest for the sustainable development. This study
took 58 counties/districts in GBA as its research units and integrated to the
data from CITYRE and statistical yearbook data to build a dataset containing
price-to-rent ratios, housing rents in 2019, and the influencing factors
(collected prior to 2019) for 58 counties/districts in the GBA. The dataset is
archived in .xls and .shp formats, consisted of 9 data files, with the data
size of 1.64 MB.
Keywords: Housing rents; price-to-rent ratio; influencing factor;
Guangdong-Hong Kong-Macao Greater Bay Area
DOI: https://doi.org/10.3974/geodp.2022.01.05
CSTR: https://cstr.escience.org.cn/CSTR:20146.14.2022.01.05
Dataset Availability
Statement:
The dataset
supporting this paper was published and is accessible through the Digital
Journal of Global Change Data Repository at:
https://doi.org/10.3974/geodb.2021.02.17.V1 or https://cstr.escience.org.cn/CSTR:20146.11.2021.02.17.V1.
1
Introduction
The Guangdong-Hong Kong-Macao Greater Bay Area (GBA),
composed of the 9 cities of the Pearl River Delta (PRD) and the 2 special
administrative regions of Hong Kong and Macao, is one of the most innovative,
open and economically dynamic urban agglomerations in China and plays an
important strategic role in the overall development of China. While a chief
goal of GBA development is to create a living environment with superior quality
of life, housing prices and housing rents are excessively high, which has imposed
a heavy burden on residents of the area[1?C3] and seriously impeded
efforts to develop a quality living circle[4]. Because the core
cities of the GBA have high proportions of rental housing, the issue of rents
is particularly worthy of attention.
The differentiation in housing rents has gradually
attracted the attention of Chinese and foreign scholars of urban geography[4?C6],
who have variously addressed the issue of housing rents from the perspectives
of spatial segregation[5?C7], influencing factors[8,9],
relevant policies[10,11], characteristics of spatial and temporal
changes[12], and the home price-rent relationship[7].
These studies have generally focused on one city or one country, however, and
there has been little research on the cross-boundary area in the GBA, which can
be characterized as being ??1 country, 2 systems, and 3 administrative regions??.
Because the GBA receives extensive support from the national government, has an
extremely important status in the country, and exhibits great differentiation
in rents[4], there is a compelling need for an in-depth analysis of
spatial differentiation in GBA housing rents and of the influencing factors,
and the dataset collected in this study could provide a basis for research on
this issue.
Considering the availability of data and the region??s
characteristics, this dataset includes 58 counties/districts in the GBA,
includes housing rent grades, spatial distribution, and chief influencing
factors, and focuses on differences in rents across administrative divisions.
By making new progress in terms of research scope and data on influencing
factors, this dataset has significant basic research value and can be used as a
new reference for research on housing in the GBA.
2 Metadata
of the Dataset
The metadata of the Dataset of housing rents and
influencing factors in Guangdong-Hong Kong-Macao Greater Bay Area (2019)[13]
is summarized in Table 1. It includes the dataset full name, short name,
authors, year of the dataset, data format, data size, data files, data
publisher, and data sharing policy, etc.
3 Data
Sources and Research Area
3.1
Data Sources and Processing
Data on county/district boundaries in the GBA were chiefly
obtained from the National Geomatics Center of China, while boundary data for
the Hong Kong and Macao Special Administrative Regions were drawn manually
based on a standard map from the National Bureau of Surveying and Mapping. Data
on boundaries of residential clusters near Dongguan were drawn based on a map[15]
from the website of the Department
of Natural Resources of Guangdong Province.
Data on boundaries of residential clusters near Zhongshan were drawn based on a
map[16] website of the Department of Natural Resources of Guangdong
Province.
Housing rent and price
data[17] for March 2019 were obtained from cityre.cn.
For Hong Kong housing rents and prices, only the data for 40?C69.9 m2
private houses were obtained from the Hong Kong Annual Digest of Statistics
(2019 Edition)[18]. Macau housing rent data were calculated from
property listing data on ganji.com, and Macau housing price data were obtained
from Macao Statistical Yearbook 2018[19]. Price indexes were used to
correct housing rent and price data for Hong Kong and Macau to ensure that they
were normalized to the 2019 data.
Influencing factor data were chiefly from 2018.
Data on 4 influencing factors, i.e., number of additional permanent residents
per km2 during the 2016?C2018 period, average wage of staff and
workers, gross domestic product (GDP) per capita, and economic value added by
tertiary industry as a share of GDP, were largely obtained from the 2019
Guangdong Statistical Yearbook[20], 2019 China Statistical Yearbook[21],
2019 Dongguan Statistical Yearbook[22], and 2019 Zhongshan
Statistical Yearbook[23].
Table 1 Metadata summary of the Dataset of
housing rents and influencing factors in Guangdong-Hong Kong-Macao Greater Bay
Area (2019)
|
Items
|
Description
|
|
Dataset
full name
|
Dataset
of housing rents and influencing factors in Guangdong-Hong Kong-Macao Greater
Bay Area (2019)
|
|
Dataset
short name
|
HousingRents_Factors_GBA_2019
|
|
Authors
|
Wang, Y.
AAG-2293-2021, Faculty of Geography, Yunnan Normal University, wyxkwy@163.com
Wu, K. M.
P-6938-2014, Guangzhou Institute of Geography, Guangdong Academy of Sciences,
kangmwu@163.com
Zhang, H.
O., Guangzhou Institute of Geography, Guangdong Academy of Sciences, hozhang@ gdas.ac.cn
Yue, X.
L. AAD-7909-2021, Guangzhou Institute of Geography, Guangdong Academy of Sciences/School
of Architecture and Urban Planning, Guangdong University of Technology,
yxl199766@163.com
|
|
Geographical
region
|
Guangdong-Hong
Kong-Macao Greater Bay Area (GBA) (not including 5 mountainous counties,
i.e., Guangning county, Deqing county, Fengkai county, Huaiji county, and
Longmen county)
|
|
Year
|
2015−2019
Data format .xls,
.shp
|
|
Data size
|
1.64 MB
(994 KB after compression)
|
|
Data
files
|
(1)
Housing rents and influencing factors data (.xls) file in Guangdong-Hong
Kong-Macao Greater Bay Area; (2) Housing rents and influencing factors data
(.shp) file in Guangdong-Hong Kong-Macao Greater Bay Area
|
|
Foundations
|
National
Natural Science Foundation of China (41871150, 41671128); GDAS Project of
Science and Technology Development (2020GDASYL-20200104001,
2020GDASYL-20200102002); the Institute of Strategy Research for Guangdong,
Hong Kong, and Macao Greater Bay Area Construction (2021GDASYL-20210401001); Ministry
of Science and Technology of P. R. China (2019YFB2103101)
|
|
Data
publisher
|
Global Change Research Data Publishing &
Repository, http://www.geodoi.ac.cn
|
|
Address
|
No.11A,
Datun Road, Chaoyang District, Beijing 100101, China
|
|
Data
sharing policy
|
Data from the
Global Change Research Data Publishing & Repository includes metadata,
datasets (in the Digital Journal of Global Change Data Repository),
and publications (in the Journal of Global Change Data & Discovery).
Data sharing policy includes: (1) Data are openly available and
can be free downloaded via the Internet; (2) End users are encouraged to use Data
subject to citation; (3) Users, who are by definition also value-added
service providers, are welcome to redistribute Data subject to written
permission from the GCdataPR Editorial Office and the issuance of a Data
redistribution license; and (4) If Data are used to compile new
datasets, the ??ten per cent principal?? should be followed such that Data
records utilized should not surpass 10% of the new dataset contents, while
sources should be clearly noted in suitable places in the new dataset[14]
|
|
Communication and searchable system
|
DOI, CSTR, Crossref, DCI,
CSCD, CNKI, SciEngine, WDS/ISC, GEOSS
|
The number of additional permanent residents per km2
during the 2016?C2018 period was obtained by dividing the number of additional
permanent residents in the 2016?C2018 period by the area of the administrative
area; for the 9 PRD cities, the average wages of staff and workers were
calculated as the monthly wage by dividing annual wages by 12 months, and for
Hong Kong and Macau, the median monthly income of all employing industries was
used; the other 2 influencing factors, i.e., average housing area per capita
and proportion of the employed population with a bachelor degree or above, were
obtained in November 2015 and in 2015, respectively, from The 1% Population
Sample Survey of Guangdong Province in 2015[24], Hong Kong Annual
Digest of Statistics (2016 Edition)[25], and Macao Statistical
Yearbook 2016[26]. In particular, for calculating the proportion of
the employed population with a bachelor??s degree or above in Hong Kong and
Macau, only the population over the age of 15 and 14, respectively, were used.
Studies have found that the effect of various factors on prices in the real
estate market is subject to a certain time lag[27,28]. This study
referred to the approach employed by Gu et al.[29] to get a
better understanding of this issue, i.e., the selected year for the independent
variable was earlier than that for the dependent variable. Therefore, data of
factors influencing housing rents were obtained prior to 2019.
Table 2 Sources of data on influencing factors of
housing rents differentiation in GBA
|
Factor
evaluation index
|
Unit
|
Main time of data
|
Data source
|
|
the number of additional permanent residents
|
person/km2
|
2016?C2018
|
2019
Guangdong Statistical Yearbook[20], 2019 Dongguan Statistical
Yearbook[22], 2019 Zhongshan Statistical Yearbook[23],
2019 China Statistical Yearbook[21], Hong Kong Annual Digest of
Statistics (2019 Edition)[18]
|
|
Per capita housing construction area
|
m2/person
|
Nov. 2015
|
The 1%
Population Sample Survey of Guangdong Province in 2015[24], List of per capita housing area of
countries (regions) in the world[30], Hong
Kong Annual Digest of Statistics (2016 Edition)[25]
|
|
Average wage of staff and workers
|
Yuan/month
|
2018
|
2019
Guangdong Statistical Yearbook [20], 2019 Dongguan Statistical
Yearbook[22], 2019 Zhongshan Statistical Yearbook[23],
2019 China Statistical Yearbook[21], Hong Kong Annual Digest of
Statistics (2019 Edition)[18]
|
|
Per capita GDP
|
Yuan
|
2018
|
2019
Guangdong Statistical Yearbook[20], 2019 Dongguan Statistical
Yearbook[18], 2019 Zhongshan Statistical Yearbook[23],
2019 China Statistical Yearbook[21]
|
|
Economic value added by tertiary industry as a share
|
%
|
2018
|
2019
Guangdong Statistical Yearbook[20], 2019 Dongguan Statistical
Yearbook[18], 2019 Zhongshan Statistical Yearbook[23],
2019 China Statistical Yearbook[21]
|
|
Proportion of the employed population with a bachelor??s degree or above
|
%
|
Nov.2015
|
The 1%
Population Sample Survey of Guangdong Province in 2015[24], Hong
Kong Annual Digest of Statistics (2016 Edition)[25], Macao
Statistical Yearbook 2018[26]
|
Note:
The economic, industrial and price data of Hong Kong and Macao have been
converted into RMB, and the housing area has been converted into m2;
??Bachelor??s degree or above?? includes bachelor??s degree.
3.2 Research Area
According to Outline Development Plan for the
Guangdong-Hong Kong-Macao Greater Bay Area, the GBA consists of 9 cities in the
PRD and the Hong Kong and Macao Special Administrative Regions. The research
area in this study did not include 5 mountainous counties in the peripheral
area of the PRD, i.e., Guangning county, Deqing county, Fengkai county, Huaiji
county, and Longmen county, and used 58 counties, county-level cities, and
districts as the basic units (referred to below as ??county/district??). Among
these counties/ districts, Hong Kong was divided into the 3 units, i.e., Hong
Kong Island, Kowloon, and New Territories, and Macau consisted of a single
unit. Based on the 2017 strategic plan for Dongguan??s Industrial Park Planning
District Joint Coordination and Development Work Advancement Association,
Dongguan was divided into 6 major districts: the urban district, Songshanhu,
Binhai, Shuixiang Xincheng, Eastern Industrial Park, and Southeastern Linshen.
In accordance with the Zhongshan Urban Sub-region Group Development Plan
(2017?C2035), Zhongshan was divided into 5 residential clusters: Central,
Northeastern, Northwestern, Eastern, and Southern.
3.3
Methodology
The methodology used to
gather the GBA housing rent and their influencing factor data and analyze the spatial differentiation characteristics
is shown in Figure 1.
(1) Boundary data
for the counties/districts in the GBA were integrated to the basic geographic boundary data.
(2) Attribute data for counties/districts in the GBA, including housing rents, housing prices, and influencing
factors, were collected and analyzed, and then, attribute data were linked with
the boundary vector data for each county/district based on the same fields in
ArcGIS, in order to complete the vector data for housing rents and influencing
factors in the GBA.
|
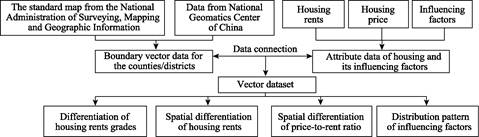
Figure
1 Technical route of the dataset
|
(3) The first
step in the analysis of spatial differentiation in GBA housing rents was to
grade the rent levels in each unit based on the housing rent data, generating a
housing rent grade distribution chart in the form of a pyramid. ArcGIS was then
used to produce a pattern chart of the spatial differentiation in housing
rents. The last step was to calculate price-to-rent ratio data for each
county/district based on housing rents and housing price data and produce a
pattern chart of spatial differentiation in the price-to-rent ratio for housing
in the GBA, in order to analyze the characteristics of spatial differentiation
in housing rents.
(4) To analyze spatial differentiation in the chief factors
influencing GBA housing rents (geographic detection factors), the
representative indicators of various factors were assigned to 5 grades, i.e.,
high (15%), medium-high (20%), medium (30%), medium-low (20%), and low (15%),
based on the value; ArcGIS was used for visualization, and spatial distribution
charts were drawn for factors influencing housing rents in the GBA.
4 Data
Results
4.1
Dataset Composition
The dataset for the spatial
differentiation in housing rents in the GBA and influencing factors consists of the following 2 parts: (1) an .xls
file of housing rents and influencing factor data for the area; and (2) a .shp
file of housing rents and influencing factor data for the area.
4.2
Data Results
4.2.1 Data
on Spatial Differentiation in Housing Rents in the GBA
Housing rents in the individual GBA counties/districts were
assigned to 5 grades, i.e., <25, 25?C40, 40?C60, 60?C100, and >100 Yuan??m?C2??month?C1,
and these grades correspond to low, medium-low, medium, medium-high, and high
rent levels. Descriptive statistics of units in each rent grade are shown in
Table 3.
The GBA housing rent
statistics show a pyramid distribution, i.e., the higher the rent grade, the
smaller the units occupied by that rent grade. The 4 high-rent units with rent
> 100 Yuan??m?C2??month?C1 are Hong Kong Island, Kowloon,
and New Territories in Hong Kong and Macau; among these units, rents in Hong
Kong Island and Kowloon are 387 and 319 Yuan??m?C2??month?C1,
respectively. Among the 6 districts in Shenzhen (including Nanshan district,
Futian district, Luohu district, Yantian district, Baoan district, and Longhua
district) and the main urban area of Guangzhou (Yuexiu district and Tianhe
district) are units with medium-high rents, with the highest rents of the 9
cities in the PRD. Seven units, including the peripheral areas of Shenzhen
(Pingshan district, Longgang district, and Guangming district) and 4 districts
adjacent to the main urban area of Guangzhou (Haizhu district, Liwan district,
Baiyun district, and Panyu district) have medium rents. Thirteen units,
including the peripheral area of Shenzhen (Dongguan districts/counties adjacent
to Shenzhen), peripheral areas of Guangzhou (Guangzhou peripheral area and
Foshan), and main urban areas of Zhuhai, Huizhou, and Jiangmen, have medium-low
rents; most of the 26 other units, which are relatively long distances from
Hong Kong, Shenzhen, and Guangzhou, have low rents. In general, regarding the
spatial differentiation in rents within the GBA, Hong Kong and Macau have the
highest rents, the main urban areas of Guangzhou and Shenzhen have the second
highest rents, and rents gradually decreased toward the periphery of these
areas.
Table 3 Descriptive statistics of the grade interval of housing
rents in GBA
|
Rent
grades
|
Rent
intervals
(Yuan??m?C2??month?C1)
|
Number
of counties and districts
|
Minimum
|
Maximum
|
Mean
|
Median
|
Standard deviation
|
|
High rent
|
>100
|
4
|
167.40
|
386.93
|
278.71
|
280.25
|
95.09
|
|
Medium-high rent
|
60?C100
|
8
|
60.55
|
98.26
|
74.64
|
66.20
|
14.80
|
|
Medium rent
|
40?C60
|
7
|
40.60
|
57.46
|
47.79
|
45.81
|
6.95
|
|
Medium-low rent
|
25?C40
|
13
|
25.66
|
38.71
|
29.11
|
27.59
|
4.48
|
|
Low rent
|
<25
|
26
|
18.22
|
24.57
|
21.70
|
21.81
|
1.80
|
|
Total
|
18.22?C386.93
|
58
|
18.22
|
386.93
|
51.54
|
25.95
|
68.79
|
The price-to-rent ratio
of housing in the various counties/districts in the GBA was obtained by
dividing the housing price per m2 by monthly rent per m2.
This statistic is used to assess whether rents are reasonable. Price-to-rent
ratio data were divided into 5 grades employing thresholds of 400, 500, 600,
and 700; descriptive statistics for each grade are shown in Table 4. In
general, the price-to-rent ratios for counties/districts in Guangzhou,
Shenzhen, and Zhuhai were universally quite high, while those in the peripheral
area of the GBA and Hong Kong were relatively low. Hong Kong had the highest
rents but a relatively low price-to-rent ratio, which reflects the high rents
in Hong Kong.
Table
4 Descriptive statistics of the
grade interval of price-to-rent ratio in GBA
|
Price-to-rent
ratio grades
|
Price-to-rent
ratio grades intervals
|
Number
of counties
and districts
|
Minimum
|
Maximum
|
Mean
|
Median
|
Standard deviation
|
|
High price-to-rent ratio
|
>700
|
14
|
705.60
|
930.27
|
796.61
|
796.37
|
65.21
|
|
Medium-high price-to-rent ratio
|
600?C700
|
10
|
621.46
|
681.26
|
655.04
|
656.11
|
17.99
|
|
Medium price-to-rent ratio
|
500?C600
|
8
|
500.19
|
591.44
|
542.98
|
540.49
|
35.21
|
|
Medium-low price-to-rent ratio
|
400?C500
|
11
|
407.72
|
479.54
|
450.59
|
452.05
|
24.53
|
|
Low price-to-rent
ratio
|
<400
|
15
|
285.90
|
400.00
|
348.03
|
358.38
|
39.10
|
|
Total
|
285.90?C930.27
|
58
|
285.90
|
930.27
|
555.58
|
519.67
|
176.48
|
4.2.2 Data on Chief Factors Influencing Rents in the
GBA
Employing a ??rental demand + urban
fundamentals?? theoretical perspective, a model of factors influencing rents was constructed by including
6 influencing factors, i.e., recently added population, housing area per
capita, income level, economic development level, industry structure, and
educational structure[4]. The 6 influencing factors in this model
were represented as the number of additional permanent residents per km2
during the 2016?C2018 period, average housing area per capita, average wage of
staff and workers, GDP per capita, economic
value added by tertiary industry as a share of GDP, and proportion of the
employed population with a bachelor??s degree or above; descriptive
statistics are provided in Table 5.
Regarding the number
of additional permanent residents per km2 during the 2016?C2018
period, the main urban areas of Shenzhen and Guangzhou, Kowloon in Hong Kong,
and Hong Kong Island had high values, other counties/districts close to the
Pearl River Estuary had moderate values, and Zhaoqing, Jiangmen, and Huizhou,
had low values. For average housing area per capita, Hong Kong, Macau, and
Shenzhen had significantly lower values than those for other areas. The average
wage of staff and workers was universally high Hong Kong, Macau, Shenzhen, and
Guangzhou, but universally low in Zhaoqing and Jiangmen, which are in the
western part of the GBA. High levels of GDP per capita existed in Hong Kong,
Macau, Nansha district in Shenzhen, and Yuexiu district, Tianhe district, and
Huangpu district in Guangzhou, but GDP per capita tended to be low in the
peripheral counties/districts. For economic value added by tertiary industry as
a share of GDP, clusters of high values were found in the core counties/districts
of Hong Kong, Shenzhen, and Guangzhou, and high values also existed in the
central parts of other prefecture-level cities. High proportions of the
employed population possessing a bachelor??s degree or above were residing in
Hong Kong, Macau, Yuexiu district and Tianhe district in Guangzhou, and Nanshan
district in Shenzhen.
Table 5 Descriptive
statistics of the grade interval of the main influencing factors of housing
rents in GBA
|
Influencing
factors
|
Factor
index
|
Unit
|
Minimum
|
Maximum
|
Mean
|
Median
|
Standard
deviation
|
|
Added population
|
the number of additional permanent residents per km2
during the 2016-2018
|
person/
km2
|
0.42
|
1,605.64
|
215.07
|
62.49
|
305.06
|
|
Housing area
per capita
|
Per capita housing construction area
|
m2/
person
|
16.00
|
44.43
|
28.23
|
28.94
|
6.24
|
|
Income level
|
Average wage of staff and
workers
|
Yuan/
month
|
5,082.00
|
14,447.40
|
7,587.41
|
6,623.29
|
2,444.68
|
|
Economic
development level
|
GDP per capita
|
Yuan/
person
|
39,218.00
|
570,751.90
|
149,066.96
|
112,432.00
|
99,952.82
|
|
Industry structure
|
Economic value added by tertiary
industry as a share of GDP
|
%
|
22.80
|
98.48
|
53.86
|
46.51
|
20.26
|
|
Educational structure
|
Proportion of the employed population with a bachelor??s degree or above
|
%
|
0.93
|
32.07
|
9.42
|
5.84
|
8.05
|
5
Conclusion
Behind only the San Francisco Bay Area and New York Bay
Area in the United States and the Tokyo Bay Area in Japan, the GBA is the
world??s fourth largest bay area and has crucial economic, social, and political
importance to China. In the context of substantial variations in housing rents
throughout this region and the high rents in core cities, this study aimed to
investigate spatial differentiation in housing rents and influencing factors in
the GBA based on data from 58 counties/districts, and the following results
were obtained. (1) Differentiation in rents within the region chiefly form a
two-tier variation pattern, with the main differentiations occurring between
Hong Kong and Macau, on one hand, and the 9 cities in the PRD on the other and
secondary differentiations occurring between the main urban areas of Shenzhen
and Guangzhou and other areas. Differences in rents across the boundaries of
the 2 special administrative regions are significantly greater than those
between the core and peripheral areas of the 9 cities in the PRD. (2) The 6
influencing factors of recently added population, housing area per capita,
income level, economic level, industry structure, and educational structure
were used to investigate housing rents in the GBA. In this study, the number of
additional permanent residents per km2, average housing area per
capita, average wage of staff and workers, GDP per capita, economic value added
by tertiary industry as a share of GDP, and proportion of the employed
population with a bachelor??s degree or above were selected as evaluation indicators
for these factors. There were differences in the spatial distribution of the
different factors affecting housing rents. The dataset built in this study can
provide data support for scholars?? research on issues of housing rents in the
GBA, and can further provide a
basis for real estate enterprises and organizations to analyze the housing
market in the GBA.
Author Contributions
Wang, Y. and Zhang, H. O. made the overall design for the
development of dataset; Wu, K. M. collected and processed the data; Wang, Y. and Wu,
K. M. designed the model and algorithm of
the dataset. Yue, X. L. did data verification; Wang, Y. and Yue, X. L. wrote
the data paper.
Conflicts of Interest
The
authors declare no conflicts of interest.
References
[1]
Lu, J. W.,
Yuan, Q. F., Huang, Z., et al. Spatial distribution pattern and causes
of rental housing in Guangzhou [J]. Tropical Geography, 2018, 38(3):
384?C393.
[2]
Lau, H. M.
M., Wei, X. J. Housing size and housing market dynamics: the case of
micro-flats in Hong Kong [J]. Land Use Policy, 2018, 78: 278?C286.
[3]
Gu, X., Li,
G., Lei, C. K., et al. The inequality-housing price nexus in tourist
resorts: theory and evidence. Asia-Pacific [J]. Journal of Accounting & Economics, 2020, 27(1):
132?C150.
[4]
Wang, Y., Zhang, H. O., Wu, K. M. Spatial differentiation and
influencing factors of housing rents in the Guangdong-Hong Kong-Macao Greater
Bay Area [J]. Geography Research, 2020, 39(9): 2081?C2094.
[5]
Song, W.
X., Ma, Y. Z., Chen, Y. R. Spatial-temporal differentiation and influencing
factors of housing selling and rental prices: a case study of Nanjing City [J].
Progress in Geography, 2018, 37(9): 1268?C1276.
[6]
Zhai, D.,
Shang, Y. S., Wen, H. Z., et al. Housing price, housing rent, and
rent-price ratio: Evidence from 30 cities in China [J]. Journal of Urban
Planning and Development, 2017, 144(1): 04017026.1-04017026.9.
[7]
Cui, N. N.,
Gu, H. Y., Shen, T. Y. Spatial differentiation and correlation of housing price
and rent in Beijing [J]. Geography Research, 2019, 38(6): 1420?C1434.
[8]
Wei, Y. Y.
Study on influencing factors and regional differences of urban housing
rent-to-sale ratio in China [D]. Nangchang: Jiangxi University of Finance and
Economics, 2017.
[9]
Cui, N. N.,
Cui, D., Xiao, L. Spatial differentiation of influencing factors of the housing
rent based on GWR model??a case study in Beijing [J]. Price, Theory
and Practice, 2020, 431(5): 45?C48, 132.
[10]
Lai, J. Y.,
Wang, Y. L., Guo, F. M., et al. Discussion on public rental housing rent
and pricing policy [J]. Construction Economics, 2016, 37(3): 66?C69.
[11]
Wang, J. H.
Research on the international experience and reference of housing rent control
[J]. Construction Economics, 2020, 41(10): 30?C33.
[12]
Zhan, C.
G., Ao, K. Y., Dai, Y. Analysis of
the spatial and temporal evolution characteristics of housing rent in Wuhan
city [J]. Chinesse Real Estate, 2020, 674(9): 27?C36.
[14]
GCdataPR
Editorial Office. GCdataPR data sharing policy [OL].
https://doi.org/10.3974/dp.policy.2014.05 (Updated 2017).
[15]
Department
of Natural Resources of Guangdong Province. Guangdong province standard map
service subsystem [DB/OL]. http://nr.gd.gov.cn/map/bzdt/map_place.html?img_id=??????????????????/??????????/??????????131910631600557398/??????????.
[16]
Department
of Natural Resources of Guangdong Province??Guangdong province standard map service subsystem [DB/OL].
http://nr.gd.gov.cn/map/bzdt/map_place.html?img_id=??????????????????/??????????/??????????131910631755097371/??????????.
[17]
China Real
Estate Association & Cityre Data. China??s housing prices [DB/OL].
https://www.creprice.cn/.
[18]
The
Government of the Hong Kong Special Administrative Region Census and Statistics
Department. Hong Kong Annual Digest of Statistics (2019 Edition) [M]. Hong Kong:
Census and Statistics Department, 2019.
[19]
Government
of the Macao Special Administrative Region Directorate of Statistics and Census
Services. Macao Statistical Yearbook 2018 [M]. Macao: Directorate of Statistics
and CensusBureau, 2019.
[20]
Guangdong
Provincial Bureau of Statistics. 2019 Guangdong Statistical Yearbook [M].
Beijing: China Statistics Press, 2019.
[21]
National
Bureau of Statistics. 2019 China Statistical Yearbook [M]. Beijing: China
Statistics Press, 2019.
[22]
Dongguan
Municipal Bureau of Statistics. 2019 Dongguan Statistical Yearbook [M].
Beijing: China Statistics Press, 2019.
[23]
Zhongshan
Municipal Bureau of Statistics. 2019 Zhongshan Statistical Yearbook [M].
Beijing: China Statistics Press, 2019.
[24]
Guangdong
Provincial Bureau of Statistics. The 1% Population Sample Survey of Guangdong
Province in 2015 [M]. Beijing: China Statistics Press, 2015.
[25]
The Government of the Hong Kong Special Administrative Region Census and
Statistics Department. Hong Kong
Annual Digest of Statistics (2016 Edition) [M]. Hong Kong: Census and
Statistics Department, 2016.
[26]
Government
of the Macao Special Administrative Region Directorate of Statistics and Census
Services. Macao Statistical Yearbook 2016 [M]. Macao: Directorate of Statistics
and Census Bureau, 2017.
[27]
Holly, S., Pesaran,
M. H., Yamagata, T. A spatio-temporal model of house prices in the USA [J]. Journal
of Econometrics, 2010, 158(1): 160?C173.
[28]
Zhang, H.
Effects of urban land supply policy on real estate in China: an econometric
analysis [J]. Journal of Real Estate Literature, 2008, 16(1): 55?C72.
[29]
Gu, H.,
Meng, X., Shen, T. Y., et al. China??s highly educated talents in 2015:
Patterns, determinants and spatial spillover effects [J]. Applied Spatial
Analysis and Policy, 2020, 13(3): 631-648.
[30]
List of per
capita housing area of countries (regions) in the world [DB/OL].
http://blog.sina.com.cn/ s/blog_50321d940102y5rb.html.