1-km Raster Dataset of Annual Soil Erosion Modulus on the Loess Plateau
(2001?C2015)
Geng, W. G.1,2 Zhu, Y. Q.2,3 Chen, P. F.2*
1. School of
Architecture Engineering, Shandong University of Technology, Zibo 255000,
China;
2. State Key Laboratory of Resources and
Environmental Information System, Institute of Geographic Sciences and Natural
Resources, Chinese Academy of Sciences, Beijing 100101, China;
3. Jiangsu Center for Collaborative
Innovation in Geographical Information Resource Development and Application,
Nanjing 210023, China
Abstract:
Soil erosion modulus is an important index to measure the quality of ecological
environment, and its temporal and spatial distribution is an important
scientific basis for soil erosion control. The Loess Plateau is an ecologically
fragile area in China with severe soil erosion. At present, the region still
lacks a fully shared dataset of soil erosion modulus with long-term sequence
and uniform format. In order to effectively support the soil erosion control on
the Loess Plateau, the authors produced the dataset of soil erosion modulus
with 1-km resolution from 2001 to 2015 based on the RUSLE (Revised Universal
Soil Loss Equation) model, through the standardized processing of precipitation
data, soil texture data, DEM (digital elevation model) data, and vegetation
index data, etc. This dataset, which is stored in TIFF format, contains data of
soil erosion modulus with 1-km resolution of the Loess Plateau from 2001 to
2015, and consists of 60 data files with a total data size of 105.0 MB.
Keywords: Loess Plateau; soil erosion modulus; RUSLE model
DOI: https://doi.org/10.3974/geodb.2022.01.12
CSTR: https://cstr.escience.org.cn/CSTR:20146.14.2022.01.12
Dataset Availability Statement:
The dataset
supporting this paper was published and is accessible through the Digital Journal of
Global Change Data Repository at: https://doi.org/10.3974/geodb.2021.11.06.V1 or
https://cstr.escience.org.cn/CSTR:20146.11.2021.11.06.V1.
1 Introduction
With
a serious impact on human life, soil erosion is a severe environmental problem
facing China and the whole world[1?C3].
The Loess Plateau region has complex topography, steep slopes and deep gullies,
low vegetation coverage, loose soil and frequent water seepage. In addition,
the heavy rainfall in summer, coupled with unreasonable exploitation by humans,
has led to extremely serious soil erosion in the Loess Plateau region[4,5]. At present, the research
on soil erosion in the Loess Plateau region is mainly focused on a single year,
small watershed or city/county scale, while lacks long-term series, complete
spatial scope and systematic research, which seriously affects the development
of soil erosion control and soil conservation in the Loess Plateau region.
Data of soil
erosion modulus can help people grasp the pattern of regional soil erosion and
provide an important basis for soil erosion control. In order to accurately
calculate the soil erosion modulus, scholars at home and abroad have proposed
different simulation calculation methods, among which the Revised Universal
Soil Loess Equation (RUSLE) model proposed by the U.S. Department of
Agriculture in 1997 has been the most widely used[6].
Chinese scholars introduced this model and conducted localized research,
optimized the calculation method of the related factors to make it more
suitable for China??s national conditions, so that the RUSLE model has played a
good role in China??s soil erosion control work, and also produced many open and
shared data on soil erosion.
At present,
published soil erosion data covering the complete Loess Plateau region include
the Dataset of soil erosion intensity with 1-km resolution in Pan-TEP 65
countries (2015) [7] of the National Tibetan Plateau Data Center, which
includes the raster data of soil erosion intensity in Pan-TEP 65 countries in
2015; the Soil erosion map in the Loess Plateau region (2010) of the National
Earth System Science Data Center, which
is the raster data of Loess Plateau region in 2010; the Soil erosion change
dataset of China (1985?C2011)[8,9] of the Global Change Research Data
Publishing & Repository, which
mainly includes statistics of classified areas by province in China in 1985,
1995, 2000 and 2011; and also the National soil erosion data of the Geographic
Information Monitoring Cloud Platform, which
is the data of soil erosion modulus in each provinces in China in 2005. At the
same time, a large number of existing studies have also produced a series of
data related to soil erosion of different years and regions on the Loess Plateau[10?C12]. However, the existing
data sharing platforms and related research data are relatively single-year and
lack long time series, and the data production methods, spatial resolutions and
data types are not unified, so it is impossible to make a more systematic
evaluation of soil erosion on the Loess Plateau. Therefore, based on the RUSLE
model, this paper produced a dataset of soil erosion modulus of 1 km per year
in the Loess Plateau region from 2001 to 2015. The data can be used to analyze
the characteristics of the temporal and spatial changes of soil erosion in the
Loess Plateau region and its typical watersheds and soil erosion types, reveal
the effectiveness of ecological construction on the Loess Plateau, and support
the evaluation of the temporal and spatial dynamic changes of soil erosion and
the evaluation of ecological environment quality.
2 Metadata of the Dataset
The
metadata of 1-km Raster dataset of annual soil erosion modulus on the Loess
Plateau (2001?C2015)[13] is
summarized in Table 1. It includes the dataset full name, short name, authors,
year of the dataset, temporal resolution, spatial resolution, data format, data
size, data files, data publisher, and data sharing policy, etc.
Table 1 Metadata summary of the 1-km raster dataset of annual
soil erosion modulus on the Loess Plateau (2001?C2015)
|
Items
|
Description
|
|
Dataset full name
|
1-km raster dataset of annual soil erosion modulus on the Loess
Plateau (2001?C2015)
|
|
Dataset short name
|
SoilErosionLoessPlateau_2001?C2015
|
|
Authors
|
Geng, W. G., Shandong University of Technology, gengwg@lreis.ac.cn
|
|
|
Zhu, Y. Q., Institute of Geographic Sciences and Natural Resources,
Chinese Academy of Sciences, zhuyq@igsnrr.ac.cn
Chen, P. F. D-7136-2019, Institute of Geographic Sciences and Natural Resources, Chinese
Academy of Sciences, pengfeichen@igsnrr.ac.cn
|
|
Geographical region
|
Loess Plateau, 100??E?C114??E, 33??N?C41??N
|
|
Year
|
2001?C2015
|
|
Temporal resolution
|
year
|
|
Spatial resolution
|
1 km
|
|
Data format
|
.tif
|
|
|
|
Data size
|
105.0 MB (36.2 MB compressed)
|
|
|
|
Data files
|
The data set consists of 60 files. The file name consists of SELP +
year, and the last four digits show the year
|
|
Foundation
|
Chinese Academy of Sciences (XDA23100100)
|
|
Data publisher
|
Global Change Research Data Publishing &
Repository, http://www.geodoi.ac.cn
|
|
Address
|
No. 11A, Datun Road, Chaoyang District, Beijing 100101, China
|
|
Data sharing policy
|
Data from the Global
Change Research Data Publishing & Repository includes metadata,
datasets (in the Digital Journal of Global Change Data Repository),
and publications (in the Journal of Global Change Data & Discovery). Data sharing policy includes: (1) Data
are openly available and can be free downloaded via the Internet; (2) End users
are encouraged to use Data subject to citation; (3)
Users, who are by definition also value-added service providers, are welcome
to redistribute Data subject to written permission from the GCdataPR
Editorial Office and the issuance of a Data redistribution license; and
(4) If Data are used to compile new datasets, the ??ten per cent
principal?? should be followed such that Data records utilized should not
surpass 10% of the new dataset contents, while sources should be clearly
noted in suitable places in the new dataset[14]
|
|
Communication and searchable system
|
DOI,
CSTR, Crossref, DCI, CSCD, CNKI, SciEngine, WDS/ISC, GEOSS
|
3 Methods
3.1 Algorithm Principle
The soil erosion modulus in the RULSE model
is calculated from precipitation data, soil data, DEM (Digital Elevation Model)
data, NDVI (Normalized Difference Vegetation Index)
data and land cover data, as shown in equation (1):
A=R´K´LS´C´P (1)
where A is the soil erosion modulus per unit
area (t??hm?C1??a?C1); R is the rainfall erosivity factor
(MJ??mm??hm?C1??h?C1??a?C1); K is the soil
erodibility factor (t??h??MJ?C1??mm?C1); LS is the slope
length and slope factor; C is the vegetation coverage and management factor;
and P is the conservation practices factor.
The rainfall erosivity factor can
characterize the impact of rainfall on soil erosion. This study uses Wischmeier
empirical formula[15]
to calculate the rainfall erosivity using monthly rainfall. Soil erodibility
factor is a comprehensive index that reflects the sensitivity of soil to
precipitation and surface runoff, as well as the ease of soil erosion[16].
In this paper, the EPIC model method[17],
a commonly used method at present, is used to calculate the soil erodibility
factor, taking into account the soil properties. The K value calculated by this
model is in American unit, which needs to be converted into international
metric unit by multiplying by the constant 0.1317[18]. The slope length and slope
factor are important indicators to reflect the effect of topography on soil
erosion. The slope length and slope factor of this study adopt the research
results of McCool et al. and Liu et al[19?C21].
The vegetation cover management factor represents the effect of vegetation
cover and management measures on soil erosion. This study is based on the
method of Cai et al[22] and uses the dimidiate pixel mode
when calculating the vegetation fraction. The factor of soil and water
conservation measures is the ratio of the soil loss under specific conservation
measures to the soil loss of the corresponding sloping cultivated plot without
conservation measures[23]. In this paper, based on the
existing literature research[24?C26] on the 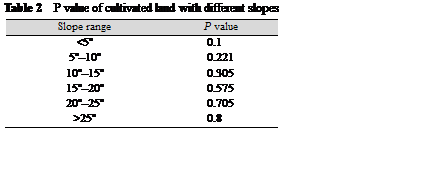 Loess Plateau region, the factor of water and soil conservation
measures is assigned a value of 0.8 for the forest land, and 1 for the bare land,
water body, construction land, and grassland. Since the effect of soil and
water conservation measures on cultivated land is proportional to the slope, P is assigned according to the slope
range (Table 2).
Loess Plateau region, the factor of water and soil conservation
measures is assigned a value of 0.8 for the forest land, and 1 for the bare land,
water body, construction land, and grassland. Since the effect of soil and
water conservation measures on cultivated land is proportional to the slope, P is assigned according to the slope
range (Table 2).
3.2 Technical Route
The technical route of producing data of soil
erosion modulus on the Loess Plateau is shown in Figure 1, which mainly
includes: data collection, data preprocessing, calculation of various factors
and calculation of soil erosion.
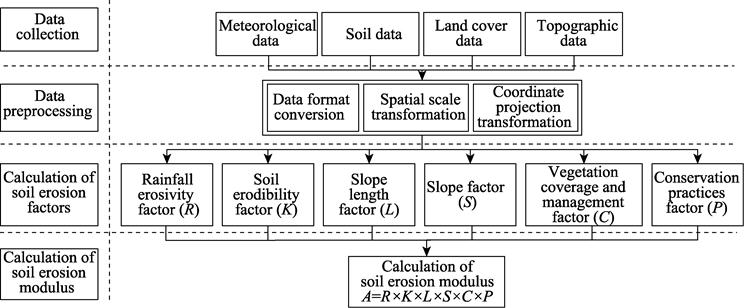
Figure 1 Technical route of the dataset
development
3.2.1 Data Collection and Preprocessing
(1) The precipitation
data come from China meteorological forcing dataset (1979?C 2018)[27,28] of the National Tibetan Plateau Data Center,
with a spatial resolution of 1-km and a temporal resolution of 3 hours. In this
study, the data of time period from 2001 to 2015 are selected and converted
into monthly data of average precipitation through calculation.
(2) The soil data come from the China soil
map based harmonized world soil database (HWSD) (v1.1) (2009)[29]
of the National Tibetan Plateau Data Center. The spatial projection of the data
is WGS84 coordinate system with a spatial resolution of 1 km.
(3) The DEM data are obtained using the
Shelter Radar Topography Mission (SRTM)
data, with a spatial resolution of 30 m.
(4) The NDVI data were derived from NASA??s 1-km
resolution product (MOD13A3) based on the inversion of MODIS data.
(5) The land cover data are obtained using
NASA??s land cover data product
(MCD12Q1) based on MODIS interpretation. When using this dataset, we adopt the
land cover classification method of the University of Maryland.
(6) The boundary data of the Loess Plateau
come from the Boundary data of the Loess Plateau region[30,31]
of the Global Change Research Data Publishing &
Repository.
3.2.2 Data Preprocessing
The above data are not unified in data
format, coordinate projection system, and spatial resolution, etc. In order to
facilitate the calculation, data format transformation, coordinate projection
transformation, data resampling, spatial registration, clipping and other techniques are adopted in this study to unify data at
the same scale, namely spatial resolution of 1 km, reference ellipsoid of
Krasovsky, projection method of Albers, and data format of TIFF.
3.2.3 Calculation of Data of the Soil Erosion
Modulus
Using the preprocessed data, we calculate the
rainfall erosivity factor, soil erodibility factor, slope length factor, slope
factor, vegetation cover and management factor, and factor P of soil and water conservation measures based on the RUSLE model,
and finally calculate the soil erosion modulus of the whole Loess Plateau
region from 2001 to 2015 year by year to form the relevant datasets.
4 Data Results and Validation
4.1 Data Composition
The dataset includes data of soil erosion modulus of the
Loess Plateau for 15 years from 2001 to 2015. The spatial resolution of the
data is 1 km, the projection is Alberts, the data format is TIFF.
4.2 Data Results
The annual average soil erosion modulus of the Loess Plateau
from 2001 to 2015 was 37.05 t??hm?C2??a?C1, and the annual
average amount of soil erosion was 65.89 t??hm?C2??a?C1 in
2013 and 20.31 t??hm?C2??a?C1 in 2015. The average annual
amount of soil erosion showed an overall decreasing trend, of which the average
annual amount of soil erosion decreased significantly from 2001 to 2012, and
the amount of soil erosion increased due to excessive precipitation in 2013.
Among the types of land cover, the soil erosion of cultivated land, forest land
and grassland showed a decreasing trend, with the most significant decrease in
the soil erosion of forest land from 2001 to 2010. According to the Standards
for classification and grading of soil erosion[32], the annual amount of soil erosion is graded, and the
data of soil erosion of each year are compared. The spatial distribution
patterns of soil erosion on the Loess Plateau are roughly the same. Among them,
the spatial distribution of soil erosion modulus on the Loess Plateau in 2010
is shown in Figure 2. From the figure, it can be seen that most parts on the
Loess Plateau are in a state of slight or mild soil erosion, but a considerable
part suffers from moderate or more severe soil erosion. The areas with severe
soil erosion are mainly located in the northern part of Shanxi province and the
eastern part of Qinghai province, while the areas with moderate soil erosion
are mainly located in the central part of the Loess Plateau.
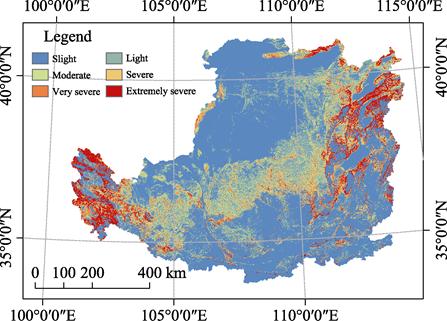
Figure 2 Spatial
distribution of soil erosion in the Loess Plateau in 2010
4.3 Data Validation
At present, two methods are generally used to
verify the data results of the model: one is to compare with the measured data,
and the other is to compare with the existing research results[33].
Due to the limited sampling size and high cost of the measured data, and the
difficulty of spatially matching the representative areas with the data
calculated based on the model, this study uses the result data in the published
literature and the published statistics for validation.
Based on
the RUSLE model, the average annual soil erosion modulus of the Loess Plateau
from 2001 to 2015 was 20.18?C65.89 t??hm?C2??a?C1, and it was
4.87 t??hm?C2??a?C1 for forest land, 51.45 t??hm?C2??a?C1
for grassland, 6.03 t??hm?C2??a?C1 for cultivated land, and
25.36 t??hm?C2??a?C1 for urban and construction land.
Compared with the previous studies (as shown in Table 3), the soil erosion
modulus estimated in this study is within the normal fluctuation range.
Table 3 Comparison of the data of
soil erosion on the Loess Plateau and the data of this study in the existing
research results (t??hm?C2??a?C1)
|
Research Area
|
Year
|
Research methods
|
Soil erosion
|
Source Literature
|
Modulus of soil erosion in this dataset
|
|
Changwu county
|
1997?C2017
|
RUSLE
|
13.05?C18.91
|
Yu et al.[34]
|
5.47?C37.51
|
|
Yulin city
|
2000?C2013
|
RUSLE
|
12.18?C89.69
|
Yang et al.[35]
|
13.99?C86.68
|
|
Loess Plateau
|
2010
|
RUSLE
|
33.55
|
Gao et al.[10]
|
35.38
|
|
Loess Plateau
|
Annual average
|
RUSLE
|
38.25
|
Dang et al.[11]
|
37.05
|
|
Loess Plateau
|
2000?C 2010
|
RUSLE
|
34.08
|
Sun et al.[12]
|
36.40
|
Note: The results
of Sun et al are in American units. After conversion, the data in the
table are obtained, and the conversion coefficient is 2.242[36].
In
addition, from the perspective of the spatial distribution of soil erosion
modulus, the results of this study show that the northwestern and southeastern
parts of the Loess Plateau are mainly in a state of slight and mild erosion,
the central part is mainly moderately eroded, and the northern part of Shanxi
province and the eastern part of Qinghai province are heavily eroded. These
patterns are consistent with the existing research results[10,12].
The above results show that the data of soil erosion modulus produced in this
study are of good accuracy.
5 Discussion and Conclusion
The Loess Plateau is an important ecological
environment reserve in China, and it is of great significance to study its soil
erosion pattern. The RUSLE model, which is commonly used to calculate the soil
erosion modulus, has obvious advantages, such as simple structure, strong
practicability and high prediction accuracy. In addition, its applicability in
China has been improved through the continuous improvement by a large number of
domestic scholars. Nevertheless, the individual factors in the RUSLE model are
still empirical values, which may sometimes deviate from the actual situation
and are vulnerable to the influence of a single factor. For example, the amount
of soil erosion in this dataset in 2013 was affected by precipitation data,
resulting in large numbers in local areas. This dataset is based on
meteorological, soil, DEM, vegetation index and land cover data, and uses the modified soil loss model to sort out and calculate
the annual dataset of soil erosion modulus with a resolution of 1 km on the
Loess Plateau. Compared with previous datasets, this dataset has a longer time
series and a more complete spatial range. This dataset can be used to grasp the
severity and temporal and spatial distribution of soil erosion on the Loess
Plateau, and can also provide a data basis for the ecological construction and
environmental management of the Loess Plateau.
Author Contributions
Chen,
P. F. designed the algorithms of the dataset. Geng, W. G. contributed to the
data processing and analysis and wrote the data paper, and Zhu, Y. Q. revised
the data paper.
Conflicts of Interest
The authors
declare no conflicts of interest.
References
[1]
Wang, T. Quantitative analysis
on influencing factors of soil erosion using RUSLE: a case study of the Luohe
basin in Northern Shanxi province [J]. Environmental Science & Technology, 2018, 41(8):
170?C177.
[2]
Yin, S., Q., Wang, W., T. A
review on the stochastic simulation of rainfall process data for soil erosion
assessment [J]. Progress in Geography, 2020, 39(10): 1747?C1757.
[3]
Yao, W., Y., Li, M. Review of
soil erosion and comprehensive control research in loess plateau [J]. Soil
and Water Conservation in China, 2005(4): 15?C17.
[4]
Liu, G. B., Wang, B., Wei, W., et
al. Technique and demonstration of water and soil loss comprehensive
harness on the Loess Plateau [J]. Acta Ecologica Sinica, 2016, 36(22): 7074?C7077.
[5]
Zhu, X. M. Maintain soil
reservoir and insure mountains beautiful of the Loess Plateau [J]. Soil and
Water Conservation in China, 2006(1): 6?C7.
[6]
Chen, C. L., Zhao, G. J., Mu, X.
M., et al. Spatial-temporal change of soil erosion in Huangshui
watershed based on RUSLE model [J]. Journal of Soil and Water Conservation,
2021, 35(4): 73?C79.
[7]
Zhang, W. B. Dataset of soil
erosion intensity with 1km resolution in Pan-TEP 65 countries (2015) [Z]. National
Tibetan Plateau Data Center, 2019. DOI: 10.11888/Disas.tpdc.270222.
[8]
Wang, Z. X., Li, F. Soil erosion
change dataset of China (1985?C2011) [J/DB/OL]. Digital Journal of Global
Change Data Repository, 2018. https://doi.org/10.3974/geodb.2018.04.05.V1.
[9]
Wang, Z. X., Li, F. Soil
erosion change dataset of China (1985?C2011) [J]. Journal of Global Change
Data & Discovery, 2018, 2(1): 51?C58.
https://doi.org/10.3974/geodp.2018.01.09.
[10]
Gao, H. D., Li, Z. B., Li, P., et al. The capacity of soil loss
control in the Loess Plateau based on soil erosion control degree [J]. Acta
Geographica Sinica, 2015, 70(9): 1503?C1515.
[11]
Dang, X. H., Sun, Y. J. The
soil erosion estimation in the regions of loess plateau based on geographic
information system [J]. Science Technology and Engineering, 2019,
19(25): 13?C17
[12]
Sun, W. Y., Shao, Q. Q., Liu,
J. Y., et al. Assessing the effects of land use
and topography on soil erosion on the Loess Plateau in China [J]. CATENA,
2014, 121: 151?C163.
[13]
Geng, W. G., Zhu, Y. Q., Chen,
P. F. 1-km raster dataset of annual soil erosion modulus in Loess Plateau
(2001?C2015) [J/DB/OL]. Digital Journal of Global Change Data Repository,
2021. https://doi.org/10.3974/ geodb.2021.11.06.V1.
[14]
GCdataPR Editorial Office.
GCdataPR data sharing policy [OL]. https://doi.org/10.3974/dp.policy.2014.05
(Updated 2017).
[15]
Wischmeier, W. H., Smith, D. D.
Predicting rainfall erosion losses: a guide to conservation planning [M]. U.S.
Dep. Agric., Agric. Handb, 1978: 537.
[16]
Jing, G. H., Yu, X. X., Li, Z.
W. Summary of study progress on soil erodibility [J]. Soil and Water
Conservation in China, 2011(10): 44?C47.
[17]
Williams, J. R., Jones, C. A.,
Kiniry, J. R., et al. The epic crop growth model [J]. Transactions of
the Asae, 1989, 32(2), 497?C511.
[18]
Hao, S. S., Li, M. H., Ma, Y.
Q., et al. Significance analysis of
soil erosion factors in loess hilly gully region [J]. Science of Soil and
Water Conservation, 2019, 17(2): 77?C86.
[19]
McCool, D. K., Brown, L. C.,
Foster, G. R., et al. Revised slope steepness factor for the universal
soil loss equation [J]. Transactions of the ASAE, 1987, 30(5):
1387?C1396.
[20]
Liu, B. Y., Nearing, M. A.,
Shi, P. J., et al. Slope length effects on soil loss for steep slopes
[J]. Soil Science Society of America Journal, 2000, 64(5): 1759?C1763.
[21]
Liu, B. Y.,
Nearing, M. A., Risse, M. L. Slope gradient effects on soil loss for steep
slopes [J]. Transactions of the ASAE, 1994, 37(6): 1835?C1840.
[22]
Cai, C. F., Ding, S. W., Shi,
Z. H., et al. Study of applying USLE and geographical information system
IDRISI to predict soil erosion in small watershed [J]. Science of Soil and
Water Conservation, 2000(2): 19?C24.
[23]
Liu, B. Y., Xie, Y., Zhang, K.
L. Soil Loss Prediction Model [M]. Beijing: China Science and Technology Press,
2001: 163?C164.
[24]
Zhang, L. W., Fu, B. J., L??, Y.
H., et al. Balancing
multiple ecosystem services in conservation priority setting [J]. Landscape
Ecology, 2015, 30(3): 535?C546.
[25]
Li, T. H., Zheng, L. N. Soil
erosion changes in the yanhe watershed from 2001 to 2010 based on RUSLE model
[J]. Journal of Natural Resources, 2012, 27(7): 1164?C1175.
[26]
Guo, D., Song, X. N., Dong, Z.,
et al. Study on soil erosion of the Ningxia Zhongwei area in the Loess
Plateau based on RUSLE and GIS [J]. Journal of Sediment Research, 2020,
45(5) 55?C60.
[27]
Yang, K., He, J. China
meteorological forcing dataset (1979?C2015) [Z]. National Tibetan Plateau Data Center, 2016, DOI:
10.3972/westdc.002.2014.db.
[28]
Chen, Y., Yang, K., He, J., et
al. Improving land surface temperature modeling for dry land of China [J]. Journal
of Geophysical Research:
Atmospheres, 2011, 116: D20104.
[29]
Fischer, G., Nachtergaele, F.,
Prieler, S., et al. Global agro-ecological zones assessment for agriculture
(GAEZ 2008) [Z]. IIASA, Laxenburg, Austria and FAO, Rome, Italy, 2008.
[30]
Wang, Z. X. Boundary data of
Loess Plateau region [J/DB/OL]. Digital Journal of Global Change Data
Repository, 2015. https://doi.org/10.3974/geodb.2015.01.09.V1.
[31]
Wang, Z. X. Boundary data of
Loess Plateau region [J]. Journal of Global Change Data & Discovery, 2017, 1(1):
113. https://doi.org/10.3974/geodp.2017.01.17.
[32]
Ministry of Water Resources of
P. R. China. Active standards for classification and gradation of soil erosion
(SL 190??2007) [S]. 2007.
[33]
Chen, P. F. Monthly NPP dataset
covering China??s terrestrial ecosystems at north of 18??N (1985?C2015) [J]. Journal of Global Change Data & Discovery, 2019, 3(1): 34?C41. https://doi.org/10.3974/
geodp.2019.01.05.
[34]
Yu, S. C., Wang, F., Qu, M., et
al. The effect of land use/cover change on soil erosion change by spatial
regression in Changwu county on the Loess Plateau in
China [J]. Forests, 2021, 12, 1209.
[35]
Yang, B., Wang, Q. J. Research
on soil erosion and nutrient loss in Yulin city after afforestation [J]. Journal
of Soil and Water Conservation, 2016, 30(4): 57?C63.
[36]
Zhou, L., Li, Y. J., Sun, Y. J.
Determination of units for various factors of revised universal soil loess
equation determination of units for various factors of revised universal soil
loess equation [J]. Bulletin of Soil and Water Conservation, 2018,
38(1): 169?C174.