A
Dataset of Nitrogen Flow Characteristics of Living Consumption of Rural
Residents in China (2000?C2020)
Zhao, Y. Q.1* Tian, D.2 Liu, W.3
1. School of Geography and Tourism, Zhengzhou
Normal University, Zhengzhou 450044, China;
2. Urban Planning and Design Institute of Nanjing
University Co., LTD, Nanjing 210093, China;
3. School of Economics and Management, Zhengzhou
Normal University, Zhengzhou 450044, China
Abstract:
This study utilizes basic information on China's rural areas spanning the years
2000 to 2020. The study employs material flow analysis to quantify and assess
nitrogen (N) inputs and outputs within the living system of Chinese rural
residents, along with their corresponding environmental impacts. A
comprehensive dataset detailing the N flow characteristics of rural residents??
living consumption in China was compiled and calculated. This dataset
encompasses key aspects such as the amount of N consumption in food, industrial
daily necessities, and domestic fuels along with their respective input
pathways. Additionally, the dataset explores the characteristics of reactive N
emissions, sources of NH3 volatilization, NOx, and N2O
emissions, all of which stem from the domestic consumption patterns of rural
residents in China over the two-decade period from 2000 to 2020. The compiled
dataset is presented in a single .xlsx file with a size of 22 KB.
Keywords: rural residents; living consumption; reactive
nitrogen emissions; sustainable development
DOI: https://doi.org/10.3974/geodp.2023.04.02
CSTR: https://cstr.escience.org.cn/CSTR:20146.14.2023.04.02
Dataset Availability Statement:
The dataset supporting this paper
was published and is accessible through the Digital Journal of Global Change Data Repository
at: https://doi.org/10.3974/geodb.2024.01.08.V1
or https://cstr.escience.org.cn/CSTR:20146.11.2024.01.08.V1.
1 Introduction
Nitrogen
(N) serves as both a valuable resource and a formidable pollutant, presenting a
challenge in terms of elimination[1]. The current scenario witnesses
escalating ecological, human health, and climate change concerns attributed to
excessive inputs and emissions of reactive nitrogen (Nr), particularly in
developing countries[2-4]. Research indicates that over 70% of Nr emissions from terrestrial
ecosystems are intricately linked to human living consumption activities[5].
China, as the world??s largest developing country, has undergone significant
transformations in the consumption structure of its rural residents due to
rapid urbanization in recent years. However, the impact of these changes on N
flow within the rural socioeconomic system and its repercussions on the
ecological environment remain unclear. It is imperative to quantify and
evaluate the sources and destiny of N in the consumption patterns of rural
residents, along with its environmental effects. Such an analysis holds
paramount theoretical and guiding significance, providing insights into the N
balance of China??s rural socioeconomic system and aiding in the formulation of
effective measures for the prevention and control of N pollution.
Currently, most
studies concerning the N cycle in residential life predominantly concentrate on
spatial and temporal variations in the N footprint of urban food consumption
systems through model simulations[6-12]. However, there exists a
noticeable gap in the examination of N flow and its environmental impacts
associated with the consumption patterns of rural residents.
This study
addresses this gap by collecting statistical data from the China Rural
Statistical Yearbook 2001-2021[13]
and China Statistical Yearbook 2001-2021[14],
encompassing the years 2000, 2005, 2010, 2015, and 2020 across 31
provinces, autonomous regions, and municipalities directly under the central
government (excluding Hong Kong, Macao, and Taiwan). Additionally, relevant
data from related research literature were incorporated. The objective of this
study is to comprehensively account for and analyze the inputs and outputs of
N, along with its changing characteristics in the living consumption of rural
residents in China. This study sheds light on the impacts of N on rural
ecological environments and proposes corresponding mitigation measures. This
endeavor is geared toward aiding the strategy of rural revitalization.
2 Metadata of the Dataset
The
metadata of Dataset of nitrogen flow from the rural residents?? consumption in
China (2000-2020)[15] is summarized in
Table 1. It includes the dataset full name, short name, authors, year of the
dataset, data format, data size, data files, data publisher, and data sharing policy,
etc.
3 Methods
3.1 Data Sources
This
study delves into the N sources and Nr emissions associated with the living
consumption of rural residents in China for the years 2000, 2005, 2010, 2015,
and 2020. The required data are categorized into two main groups. The first
category comprises basic information data related to the living consumption of
rural residents in China. This includes parameters such as the number of rural
residents, per capita consumption of food and fossil fuels, firewood production,
grassland area, per capita disposable income, and industrial daily necessities
consumption. These data were primarily sourced from the China Rural Statistical
Yearbook 2001-2021[13] and the China Statistical Yearbook 2001-2021[14].
The second category involves data on conversion factors used to calculate the
production of N and its Nr emissions resulting from the living consumption of
rural inhabitants. These data were predominantly derived from pertinent
literature sources[3-5, 17-20].
Table 1 Metadata summary of the Dataset of nitrogen flow from
the rural residents?? consumption in China (2000-2020)
|
Items
|
Description
|
|
Dataset full name
|
Dataset of
nitrogen flow from the rural residents?? consumption in China (2000-2020)
|
|
Dataset short
name
|
NLivConRuralChina
|
|
Authors
|
Zhao, Y. Q.
E-1061-2018, School of Geography and Tourism, Zhengzhou Normal University,
zyongqiang@126.com
Tian, D., Urban
Planning and Design Institute of Nanjing University Co., LTD, nptd08@163.com
|
|
|
Liu, W., School of
Economics and Management, Zhengzhou Normal University, liuwei@zznu.edu.cn
|
|
Geographical
region
|
31 provinces in
China (excluding Hong Kong, Macao and Taiwan)
|
|
Year
|
2000, 2005, 2010,
2015, 2020
|
|
Data format
|
.xlsx
|
Data size
|
22 KB
|
|
Data files
|
5 tables,
including the amount of N consumed, its input pathways, Nr emissions and its
emission characteristics from the domestic consumption of rural residents in
China
|
|
Foundation
|
The Scientific
and Technological Project of Henan Province of China (222102320122)
|
|
Data publisher
|
Global Change Research Data Publishing & Repository,
http://www.geodoi.ac.cn
|
|
Address
|
No. 11A, Datun
Road, Chaoyang District, Beijing 100101, China
|
|
Data sharing
policy
|
(1) Data
are openly available and can be free downloaded via the Internet; (2) End
users are encouraged to use Data subject to citation; (3)
Users, who are by definition also value-added service providers, are welcome
to redistribute Data subject to written permission from the GCdataPR
Editorial Office and the issuance of a Data redistribution license; and
(4) If Data are used to compile new datasets, the ??ten per cent
principal?? should be followed such that Data records utilized should not
surpass 10% of the new dataset contents, while sources should be clearly
noted in suitable places in the new dataset[16]
|
|
Communication and searchable system
|
DOI, CSTR, Crossref, DCI, CSCD, CNKI,
SciEngine, WDS/ISC, GEOSS
|
3.2 Algorithm
The
material flow method is employed in this study to calculate and analyze the
source, fate, and N flow within the living consumption system of rural
residents in China. The fundamental guiding principle of this approach is the
law of mass balance, which posits that the change in the internal storage
capacity of a system is equal to the difference between the amount of input and
output system material. This principle is mathematically expressed by the
following equation:

 (1)
(1)
where, INh and OUTg represent the N
inputs and outputs, respectively, while ACk represents the N
accumulations. Here, h=1-m represents the N input terms (e.g., food consumption, consumption of
industrial daily necessities), g=1-n represents N output terms (e.g., NH3 volatilization, N2O
emissions), and k=1-p represents N accumulation terms.
3.3 Methodology
In
this study, the methodology revolves around the utilization of basic
information data collected on the living consumption of Chinese rural residents
and N conversion coefficients derived from relevant research literature.
Drawing inspiration from the methodologies employed by Cai et al.[18], Gu et al.[5] and Zhao
et al.[17], a comprehensive framework
for analyzing the N flow in the living consumption of rural residents was
established. This study adopts a bottom-up approach, accounting for and
evaluating the N sources and Nr emissions within the living consumption system
of rural residents in China for the years 2000, 2005, 2010, 2015, and 2020. The
material flow analysis method serves as the principal analytical tool. Refer to
Section 3.1 for details regarding data acquisition and the sources of emission
factors essential for the calculations. Specifically, the N inputs in rural
residents living consumption mainly encompass food consumption N (including
grain, meat and poultry products, vegetables, fruits, and aquatic products),
industrial commodities consumed N, and domestic fuel combustion N by rural
residents (including natural gas, gas and biomass fuels). N outputs include NH3,
N2O, and NOx, as well as direct discharge and leakage of
N-containing wastewater released by rural residents after food consumption and
human metabolism, domestic waste treatment, and fuel combustion emissions.
4 Data Results and Validation
4.1 Data Composition
The
dataset, archived in .xlsx format, comprises one data file with a size of 22
KB. The data comprehensively cover the structure of N consumption in various
aspects of rural residents?? lives in China. This includes the breakdown of N
consumption in food, industrial daily necessities, and household fuels, as well
as the corresponding Nr emissions from rural residents?? living consumption. The
dataset also encompasses details on the sources and emissions of NH3
volatilization, NOx, and N2O.
4.2 Data Products
(1)
Structure of food consumption n and its generation by Chinese rural residents
in 2000, 2005, 2010, 2015, and 2020 (Table 2): the results indicate that the
proportion of food consumption N accounted for 43.2% and exhibited a declining
trend over the years. Notably, there was a 36.5% reduction in 2020 compared
with 2000. Regarding the consumption structure, the proportion of food
consumption N was 65.9%, also demonstrating a decreasing trend. However, within
this structure, the N consumption of meat, poultry, egg, and dairy products, as
well as aquatic products, exhibited an increasing trend with average annual
growth rates of 8.0% and 14.2%, respectively.
Table
2 The structure of nitrogen in food
consumption and its production (Tg)
|
Food
|
2000
|
2005
|
2010
|
2015
|
2020
|
|
Grain
|
2.37
|
1.88
|
1.47
|
1.18
|
1.11
|
|
Livestock
and poultry products
|
0.43
|
0.48
|
0.44
|
0.55
|
0.57
|
|
Aquatic
products
|
0.09
|
0.10
|
0.09
|
0.11
|
0.14
|
|
Vegetable
|
0.26
|
0.23
|
0.19
|
0.16
|
0.15
|
|
Melon
and fruit
|
0.03
|
0.03
|
0.03
|
0.04
|
0.04
|
(2) Structure
and production of N consumption in industrial daily necessities for rural
residents in China (Table 3): the findings reveal that the proportion of N
consumed by rural residents in industrial daily necessities is 31.5%. This
category has undergone a period of rapid growth, with consumption in 2020
registering a staggering increase of 572.6% compared with 2000. Examining the
consumption structure, synthetic industrial product N constitutes 89.5%, while
biosynthetic industrial product accounts for 10.5%. Notably, the per capita
consumption of industrial N products by rural residents in China now surpasses
the per capita consumption of food N. Given that industrial products are rich
in carbon and N, there is an urgent need to intensify efforts toward recycling
and harmless treatment of these products.
(3) Structure and production of fuel
consumption N by rural households in China (Table 4):
fuel consumption N by rural households accounted for 25.3%, demonstrating a gradual
increase with an average annual growth rate of 1.5%.
Analyzing the consumption structure reveals that straw and livestock manure serve
as the primary sources of N in domestic fuel consumption, collectively
contributing a substantial 97.9%, while other sources constitute a mere 2.0%.
These findings underscore the critical importance of increasing the proportion
of clean energy used in the daily lives of rural residents. This would help
prevent and control atmospheric N pollution in rural areas.
Table
3 The structure of nitrogen in industrial
daily necessities and its production (Gg)
|
Types
|
2000
|
2005
|
2010
|
2015
|
2020
|
|
Artificial
synthesis
|
Plastic
|
14.4
|
27.3
|
52.4
|
98.8
|
148.1
|
|
Coating/paintings
|
72.8
|
135.9
|
343.0
|
652.1
|
1,036.5
|
|
Chemical fiber
|
146.6
|
315.3
|
584.6
|
978.3
|
1,376.8
|
|
Syntheic rubber
|
1.1
|
2.4
|
3.8
|
6.8
|
10.6
|
|
Syntheic dyes
|
6.8
|
7.7
|
9.1
|
11.7
|
15.8
|
|
Chemical
medicines
|
6.9
|
15.0
|
26.7
|
42.4
|
41.0
|
|
Dynamite
|
58.0
|
101.0
|
149.6
|
167.3
|
226.7
|
|
Reagents
|
7.9
|
11.6
|
33.0
|
95.1
|
158.7
|
|
Chemical
pesticide
|
8.0
|
13.6
|
26.4
|
47.3
|
30.2
|
|
Synthetic
detergents
|
3.9
|
6.1
|
8.9
|
16.6
|
16.1
|
|
Nitrate
|
47.9
|
81.8
|
122.6
|
154.1
|
143.6
|
|
Biosynthetic
products
|
Agricultural raw
materials
|
13.1
|
13.8
|
13.7
|
13.6
|
12.5
|
|
Raw materials
for livestock and poultry products
|
61.8
|
67.4
|
73.8
|
92.8
|
111.3
|
|
Forest product
raw materials
|
65.1
|
68.7
|
99.6
|
95.1
|
132.3
|
Table 4 Nitrogen structure of household fuel
consumption and its production (Gg)
|
Types
|
2000
|
2005
|
2010
|
2015
|
2020
|
|
Fossil fuel_NH3
|
1.8
|
1.9
|
1.9
|
0.8
|
0.4
|
|
Fossil fuel_NOx
|
9.7
|
11.3
|
14.1
|
12.9
|
12.8
|
|
Straw fuel
|
825.8
|
862.2
|
881.2
|
907.8
|
974.2
|
|
Firewood
|
12.7
|
12.9
|
13.4
|
16.1
|
24.6
|
|
Livestock and poultry manure fuel
|
549.8
|
514.8
|
469.9
|
505.5
|
469.9
|
(4) The amount
of Nr emissions from the living consumption of rural residents in China: the results,
as illustrated in Figure 1, indicate that 25.4% of the N produced by the
domestic consumption of rural residents in China is discharged into the
atmosphere and water environment in the form of Nr, amounting to an annual
emission of approximately 1.43 Tg. The primary source of Nr emissions is NH3
volatilization, contributing to 50.1%, followed by Nr discharged into surface
water bodies at 31.0% and NOx at 15.8%. Additionally, N2O
contributes 2.0%, while Nr discharged into groundwater bodies accounts for only
1.1%. The overall Nr emissions exhibit fluctuations but show a decreasing trend
at an average annual rate of 1.3%. These findings suggest that changes in the
consumption structure of rural residents in China have significantly alleviated
the N load in the rural environment.
Sources of NH3
volatilization, NOx, and N2O and their emissions from the
domestic consumption of rural residents in China: the primary source of NH3
emissions from the domestic consumption of rural residents in China is human
food metabolized excreta, constituting the largest share at an annual average
of 513.1 Gg N, accounting for approximately 72.0%, while other sources
collectively contribute around 28.0% (Figure 2). This highlights the
significance of addressing and improving the disposal capacity of human fecal
and urinary excreta in the prevention and control of NH3 volatilization
in rural residential areas in China.
As depicted
in Figure 3, the primary contributor to NOx emissions from rural
residents was straw combustion, representing the largest share at 51.4%.
Following this, livestock and poultry manure combustion contributed 33.4%,
garbage treatment emissions constituted 8.7%, and household fossil fuel
combustion accounted for 5.4%, with firewood contributing only 1.1%.
Consequently, the key strategy for reducing NOx emissions in rural
residents?? lives involves increasing the proportion of consumption of fossil
fuels and clean energy.
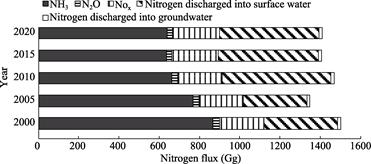
Figure 1 Nr
emissions from living consumption of rural residents in China (Gg)
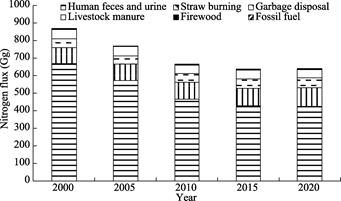
Figure 2 Sources
and emissions of NH3 from living consumption of rural residents in
China (Gg)
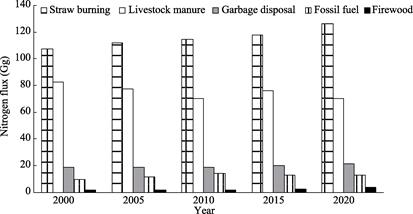
Figure 3 Sources and emissions of NOx
from living consumption of rural residents in China (Gg)
In Figure 4,
the distribution of N2O emissions reveals that human feces and urine
excretion constitute the largest contributor at 37.3%. Following this, straw
combustion contributes 31.0%, while fecal combustion and garbage treatment
collectively account for 17.5% and 13.7%, respectively. In contrast, firewood
contributes less than 1.0%. This analysis suggests that efforts to reduce N2O
greenhouse gas emissions from the living consumption of rural residents should
primarily focus on improving the treatment capacity of human fecal and urine
excretion and minimizing the use of straw fuel.
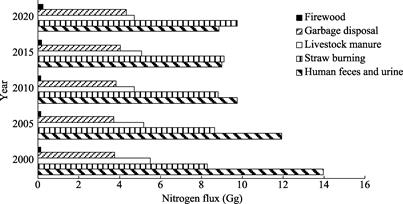
Figure 4 Sources and emissions of N2O
from living consumption of rural residents in China (Gg)
The discharge of Nr
into water bodies is primarily attributed to human feces, urine, and domestic
residues, with an annual discharge of approximately 458.5 Gg N. This discharge
accounts for 32.1% of the total Nr discharged, with a substantial proportion of
96.6% being released into surface water bodies, while the remaining percentage
is discharged into groundwater bodies.
4.3 Data Validation
To validate the data on food consumption N,
industrial product consumption N, domestic fuel consumption N, and Nr emissions
from 2000 to 2020, the method proposed by Gao et al. [10] was employed. The
validation results indicate that the calculation error falls within the range
of 7.1%?C22.5%, all of which are deemed acceptable. Furthermore, the food
consumption N by rural residents in this study closely aligns with the
estimated results from published literature[12], affirming the
reliability of the accounting results presented in this study.
5 Discussion
and Conclusion
Utilizing
material flow analysis and the law of mass balance, this study successfully
established a comprehensive framework for analyzing N flow within the domestic
consumption of rural residents. Employing bottom-up calculations based on
national-level statistical information, this study generated a dataset
capturing the N flow in the domestic consumption of rural residents in China
for the period 2000?C2020. Through uncertainty analysis and comparison with data
from related studies, the results exhibited a high degree of credibility. This
dataset holds substantial reference significance, offering valuable insights
into the input and output characteristics of N consumption by rural residents
in China. The findings provide a solid foundation for formulating strategies
aimed at managing and regulating rural N pollution.
Data analysis
revealed the following key insights. (1) Food and industrial daily necessities
emerged as the primary sources of N in the domestic consumption of Chinese
rural residents. These areas should be the focal points for effective
management and control of N in the domestic consumption of rural residents. (2)
The food consumption of N by rural residents in China continues to be primarily
dominated by grain consumption. However, a discernible trend indicates a
year-by-year increase in the consumption of meat, poultry, eggs, milk products,
and aquatic products. (3) Currently, the proportion of fossil fuels in the
consumption of household fuels by rural residents is relatively low. (4) A
significant portion, 25.4%, of the N produced by rural residents?? domestic
consumption is discharged into the surrounding environment in the form of Nr.
Enhancing the disposal capacity of human fecal and urinary excreta and
increasing the proportion of clean energy consumption are critical priorities
for the prevention and control of N pollution in rural areas. This dataset
serves as a valuable resource for research and decision-making related to N
balance and sustainable N management in China??s rural socioeconomic system.
Author Contributions
Zhao,
Y. Q. designed the algorithms of dataset. Tian, D. contributed to the data
processing and analysis. Liu, W. designed the algorithms, performed data
validation. All authors wrote the data paper.
Conflicts
of Interest
The authors
declare no conflicts of interest.
References
[1]
Cassman, K. G., Dobermann, A.
Nitrogen and the future of agriculture: 20 years on: this article belongs to
Ambio??s 50th Anniversary Collection. Theme: Solutions-oriented research [J]. Ambio, 2022, 51(1): 17?C24.
[2]
Yu, C. Q., Huang, X., Chen, H.,
et al. Managing nitrogen to restore
water quality in China [J]. Nature,
2019, 567(7749): 516?C520.
[3]
Zhao, Y. Q., Zhou, Q. S.,
Hidetoshi, K., et al. Nitrogen flow
characteristics of solid waste in China [J]. Ecotoxicology and Environmental Safety, 2021, 208: 111596.
[4]
Gu, B., Zhang, L., van
Dingenen, R., et al. Abating ammonia
is more cost-effective than nitrogen oxides for mitigating PM2.5 air pollution
[J]. Science, 2021, 374(6568):
758?C762.
[5]
Gu, B. J., Ju, X. T., Chang, J., et
al. Integrated reactive nitrogen budgets and future trends in China [J]. Proceedings of the National Academy of
Sciences of the United States of America, 2015, 112(28): 8792?C8797.
[6]
Leach, A. M., Galloway, J. N.,
Albert, B., et al. A nitrogen
footprint model to help consumers understand their role in nitrogen losses to
the environment [J]. Environmental
Development, 2012, 1(1): 40?C66.
[7]
Martinez, S., Del Mar Delgado,
M., Marin, R. M., et al. How do
dietary choices affect the environment? The nitrogen footprint of the European
Union and other dietary options [J]. Environmental
Science & Policy, 2019, 101: 204?C210.
[8]
Yu, Y., Cui, S. H., Zhao, S.
N., et al. Changes of resident??s
nitrogen consumption and its environmental loading from food in Xiamen [J]. Acta
Ecologica Sinica, 2012, 32(19): 5953?C5961.
[9]
Xian, C. F., Liu, J. R., Pan, X.,
L., et al. Calculation and analysis
of urban food nitrogen footprints in a typical immigrant city: a case study of
Shenzhen city, China [J]??Acta Ecologica Sinica, 2020, 40(20): 7441?C7450??
[10]
Gao, B., Huang, W., Wang, L., et al. Driving forces of nitrogen flows
and nitrogen use efficiency of food systems in seven Chinese cities, 1990 to
2015 [J]. Science of the Total
Environment, 2019, 676: 144?C154.
[11]
Zhao, Y., Lin, T., Ge, R. B., et al. Environmental emissions of
nitrogen from food consumption and differences between urban and rural areas in
China [J]. Acta Ecologica Sinica, 2017,
37(13): 4573?C4586??
[12]
Cui, S. H., Shi, Y. L., Malik,
A., et al. A hybrid method for
quantifying China??s nitrogen footprint during urbanisation from 1990 to 2009 [J].
Environment International, 2016, 97:
137?C145.
[13]
National Bureau of Statistics.
China Rural Statistical Yearbook 2001?C2021 [M]. Beijing: China Statistic Press,
2001?C2021.
[14]
National Bureau of Statistics.
China statistic yearbook 2001?C2021 [M]. Beijing: China Statistic Press,
2001?C2021.
[15]
Zhao, Y. Q., Tian, D., Liu, W.
Dataset of nitrogen flow from the rural residents?? consumption in China (2000?C2020)
[J/DB/OL]. Digital Journal of Global
Change Data Repository, 2024. https://doi.org/10. 3974/geodb.2024.01.08.V1.
https://cstr.escience.org.cn/CSTR:20146.11.2024.01.08.V1.
[16]
GCdataPR Editorial Office.
GCdataPR data sharing policy [OL]. https://doi.org/10.3974/dp.policy.2014.05
(Updated 2017).
[17]
Zhao, Y. Q., Luo, L. L., Zhou,
Q. S., et al??The generation, treatment and N2O
emission of municipal solid waste in China [J]??Acta Scientiae
Circumstantiae, 2021, 41(6) : 2487?C2497.
[18]
Cai,
Z., Cui, S. H., Gao, B. Guidelines for Nitrogen Flow Analysis in China [M].
Beijing: Science Press, 2018.
[19]
Bai, Z. H., Ma, L., Jin, S. Q., et al. Nitrogen, phosphorus, and
potassium flows through the manure management chain in China [J]. Environmental Science & Technology, 2016, 50(24): 13409?C13418.
[20]
Han, Z. Y., Fei Y. Q., Liu, D.,
et al. Yield and physical
characteristics analysis of domestic waste in rural areas of China and its
disposal proposal [J]. Transactions of
the Chinese Society of Agricultural Engineering, 2017, 33(15): 1?C14.