Dataset of the
Influence of the Local Labour Market on the Scale of Japanese Direct Investment
Enterprises in the Bohai Sea Rim Region (1990?C2016)
Wang, M. J.1* Ma, H. W.1 Shao, J.2 Gao, Y. F.3
1. School of Resources
Environment & Tourism, Capital Normal University, Beijing 100048, China;
2. PLA Strategic Support Force
Information Engineering University, Zhengzhou 450001, China;
3. Shanxi Urban & Rural
Planning and Design Institute CO., LTD., Taiyuan 030001, China
Abstract:
Authors analysed the
information from Overview of Inbound
and Outbound Enterprises (County Edition) published in 2016 to obtain
data on foreign direct investment (FDI) enterprises from Japan in the Bohai Sea
Rim region from 1990 to 2016. Moreover, the authors used statistical data from
Chinese Population Census by County (2010) and The Third Economic Census
Yearbook of five provinces (Beijing, Tianjin, Hebei, Liaoning and Shandong) to
obtain the influence dataset of the local labour market on the scale of
Japanese direct investment enterprises in the Bohai Sea Rim region (1990?C2016).
The dataset includes the result data and attached data. The result data include
(1) amounts of FDI from Japan used in China and proportions to total flows
from Asian countries, 2002?C2021; (2) number of Japanese enterprises in the
Bohai Sea Rim region and its proportion to the total number in China; (3)
geographical concentration degree of different industries in the Bohai Sea Rim
region in 2013; and (4) number of development zones and universities and colleges
offering a Japanese major on the county scale in the Bohai Sea Rim region in
2016. The attached data include (1) the attribute of Japanese enterprises in
the Bohai Sea Rim region; (2) the number of labour force and shared labour
force in the Bohai Sea Rim region in 2010; and (3) the dedicated labour force
in specific industries in the Bohai Sea Rim region in 2013. The dataset is
archived in .xls format and consists of one data file with a size of 234 KB.
Keywords: labour force scale; dedicated labour force; shared labour force;
Japanese transnational enterprises scale; Bohai Sea Rim region
DOI: https://doi.org/10.3974/geodp.2023.03.08
CSTR: https://cstr.escience.org.cn/CSTR:20146.14.2023.03.08
Dataset Availability Statement:
The dataset supporting this paper was published and is accessible through
the Digital Journal of Global Change Data Repository at: 3https://doi.org/10.3974/geodb.2023.10.01.V1 or
https://cstr.escience.org.cn/CSTR:20146.11.2023.10.01.V1.
1 Introduction
Since
1985, the focus of Japanese investment in Asia has been shifting to China. A
total of 52 Japanese multinational enterprises (JMEs) were operating in
mainland China in 1985, accounting for 1.7% of the total number of JMEs in
Asia. The number of JME in China increased to 6,091 in 2012 with the
corresponding proportion of 39.10%, surpassing the ??Four Asian Tigers?? with
4,135 and 26.50% and four ASEAN countries (Philippines, Indonesia, Malaysia and
Thailand) with 4,007 and 25.70%, thus becoming Japan??s largest investment
destination country in Asia. In 2016, the number and proportion of JMEs in
China were 6,363 and 38.5%, respectively. While the number of JMEs in China has
increased rapidly, the size of enterprises has declined significantly. From
1990 to 2015, the average employment size of JMEs at the national level in
China dropped from 1,018 to 80, and that in the Bohai Sea Rim region dropped
from 757 to 155[1]. Why is there such a significant change in JMEs
size? What are the dominant factors behind it? In other words, what factors
decide the size of local foreign direct investment (FDI) subsidiaries? These
problems need to be investigated in depth.
The investment of JMEs in
China is determined by the comprehensive balance of production supply factors
and product demand market factors. The former includes industrial tax policies,
labour force, human capital, raw materials, land cost, social capital and agglomeration
factors required by enterprise production, while the latter refers to market
demand factors for product sales, including the local market, the Japanese
market and the third- country market. While the role of the market increases,
like the vertical FDI facing Japan and the platform FDI facing the
third-country market, labour supply factors remain important and have undergone
significant changes. Firstly, the importance of a cheap labour force has
declined. Secondly, the proportion of human capital has remained steady at 3%
to 4%, showing a significant rise compared with the change in cheap labour.
Labour supply is still an
important factor for JMEs in China, which is why local labour supply factors
must have a key impact on the size of JMEs. What is the specific manifestation
of this impact? Existing research has not yet provided answers to this
question. Therefore, this study integrates the attribute information of JMEs in
the Bohai Sea Rim region with the labour force scale dataset of cities. This
dataset can be used to analyse the attribute characteristics of JMEs in the
Bohai Rim region and also provide explanations for the shrinking size of JMEs
in China.
2 Metadata of the Dataset
The metadata of the
Dataset of the influence of the local labour market on the scale of Japanese
direct investment enterprises in the Bohai Sea Rim region (1990?C2016)[2] are summarised in Table 1. It
includes the dataset??s full name, short name, authors, year, data format, data
size, data files, data publisher and data sharing policy, etc.
3 Data Sources and
Methods
3.1 Data
Sources and Processing
The enterprise data are
derived from the Overview of
Japanese Export and Import Enterprises
(2016), including the location of the enterprise,
employee size, subordinate sectors, date of establishment, business content and
Japanese investment proportion of JMEs in the
Table 1 Metadata summary of the Dataset of the influence of the local
labour market on the scale of Japanese direct investment enterprises in the
Bohai Sea Rim region (1990?C2016)
|
Items
|
Description
|
|
Dataset full name
|
Dataset of the
influence of the local labour market on the scale of Japanese direct
investment enterprises in the Bohai Sea Rim Region (1990?C2016)
|
|
Dataset short name
|
BohaiFDI_1990-2016
|
|
Authors
|
Wang, M. J. JDV-5082-2023,
School of Resources Environment & Tourism, Capatial Normal University,
maojunw@yeah.net
Ma, H.W. JDU-8149-2023,
School of Resources Environment & Tourism, Capatial Normal University,
mahuiwenchn@163.com
Shao, J. PLA Strategic
Support Force Information Engineering University, wjingshao@yeah.net
Gao, Y. F. JDV-6003-2023,
Shanxi Urban & Rural Planning and Design Institute CO., LTD.,
421739507@qq.com
|
|
Geographical region
|
Bohai Sea Rim region
|
|
Year
|
1990?C2016
|
|
Data format
|
.xlsx
|
|
Data size
|
234 KB
|
|
Data files
|
The result data include (1) amounts of FDI from
Japan used in China and its proportions to total flows from Asian countries,
2002?C2021; (2) number of Japanese enterprises in the Bohai Sea Rim region and
its proportion to the total number in China; (3) geographical concentration
of different industries in the Bohai Sea Rim region in 2013; and (4) number
of development zones and universities and colleges offering a Japanese major
on the county scale in the Bohai Sea Rim region in 2016. The attached data
include (1) the attribute of Japanese enterprises in the Bohai Sea Rim
region; (2) the number of labour force and shared labour force in the Bohai
Sea Rim region in 2010; and (3) the dedicated labour force in specific
industries in the Bohai Sea Rim region in 2013
|
|
Foundation
|
National Natural
Science Foundation of China (41771183)
|
|
Data publisher
|
Global Change Research
Data Publishing & Repository, http://www.geodoi.ac.cn
|
|
Address
|
No. 11A, Datun Road,
Chaoyang District, Beijing 100101, China
|
|
Data sharing policy
|
(1) Data
are openly available and can be free downloaded via the Internet; (2) End
users are encouraged to use Data subject to citation; (3)
Users, who are by definition also value-added service providers, are welcome
to redistribute Data subject to written permission from the GCdataPR Editorial
Office and the issuance of a Data redistribution license; and (4)
If Data
are used to compile new datasets, the ??ten per cent principal?? should be
followed such that Data records utilized should not
surpass 10% of the new dataset contents, while sources should be clearly
noted in suitable places in the new dataset[3]
|
|
Communication and
searchable system
|
DOI, CSTR, Crossref, DCI, CSCD, CNKI,
SciEngine, WDS/ISC, GEOSS
|
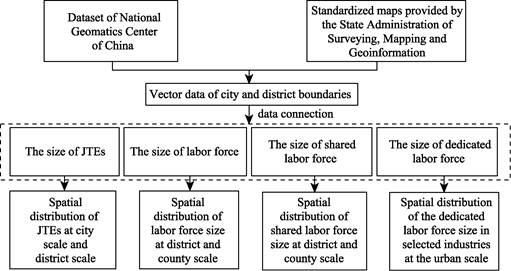
Figure
1 Technical route of the dataset development
Bohai Sea Rim region. On the basis of the data
validity, we select a total of 681 Japanese subsidiaries in 28 prefecture-level
cities of the Bohai Sea Rim region. The labour force scale data and other influencing
factor data sources are shown in Table 2.
Table
2 Sources of data on factors influencing the
local labour market on the scale of JMEs
|
Variable
|
Definition of index
|
Year
|
Source
|
|
Dependent variable
|
Employee size
|
Enterprise employees (logarithm)
|
2016
|
Overview of Japanese Export & Import Enterprises (2016) [1]
|
|
Independent variables
|
Labor supply size
|
Population with labour capacity of county (logarithm)
|
2010
|
County Data in Population Census of China (2010) [4]
|
|
Shared labour size
|
Migrant population of county (logarithm)
|
2010
|
County Data in Population Census of China (2010) [4]
|
|
Dedicated labour size
|
Number of employees in the subordinate industry of urban enterprises
(logarithm)
|
2013
|
The Third China Economic Census Yearbook [5?C9]
|
|
Control variables
|
Parent enterprise attributes
|
Listed enterprise or not
|
Listed =1, unlisted =0
|
2016
|
Overview of Japanese Export & Import Enterprises (2016) [1]
|
|
Local initial investment or not
|
Initial investment=1,
Non-initial investment=0
|
2016
|
Overview of Japanese Export and Import Enterprises (2016) [1]
|
|
Subsidiary attributes
|
Age of enterprise
|
Survival age as of 2016
|
2016
|
Overview of Japanese Export & Import Enterprises (2016) [1]
|
|
Mode of joint venture and sole proprietorship
|
Joint venture=0,
Sole proprietorship=1
|
2016
|
Overview of Japanese Export & Import Enterprises (2016) [1]
|
|
Industry category
|
Services=1, manufacturing=0
|
2016
|
Overview of Japanese Export & Import Enterprises (2016) [1]
|
|
Market structure
|
Local market orientation
|
Urban social consumption retail sales (logarithm)
|
2016
|
Statistical yearbooks of Chinese cities
|
|
Foreign market orientation
|
County export volume (logarithm)
|
2016
|
Statistical yearbooks of Chinese cities
|
|
Spatial agglomeration
|
Total size of local agglomeration
|
Number of enterprises at district or county scale (logarithm)
|
2016
|
Statistical yearbooks of Chinese cities
|
|
Size of JMEs
|
Cumulative number of JMEs at district or county scale
|
2016
|
Overview of Japanese Export & Import Enterprises (2016) [1]
|
|
Cultural factors
|
Supply of Japanese-speaking labour force
|
Number of universities and colleges offering a Japanese major in
cities
|
2016
|
Collected by the authors
|
|
Location factors
|
Development zone
|
Number of development zones at provincial, district or county scale
|
2016
|
China Development Zone Audit and Announcement
Catalog (2018 Edition)
|
|
Urban type
|
Central urban area=1, non-central urban area=0
|
2016
|
Determined according to the planning horizon of
each city
|
3.2 Technical Route
The
technical route for producing data on the size of JMEs in the Bohai Sea Rim
region, local labour market data and their spatial distribution is shown in
Figure 1.
(1) The boundary vector data
of cities, counties and districts in the Bohai Sea Rim Region are collected,
mapped and integrated to form basic geographic boundary data.
(2) The attribute data of the scale of JMEs and the scale of labour force in
the Bohai Sea Rim region are collected and organised. Then, the attribute data
are connected with the boundary vector data of counties and districts in ArcGIS
based on the same fields to complete the spatial distribution map of the scale
of JMEs and the scale of the local labour market.
4 Data Results and
Validation
4.1 Data
Composition
The dataset of the
influence of the local labour market on the scale of Japanese direct investment
enterprises in the Bohai Sea Rim region contains three main sections: information
on the attributes of JMEs in the Bohai Sea Rim region, the size of the labour
force in each city in the Bohai Sea Rim region and statistics on other control
variables.
4.2 Data Results
4.2.1 Spatial Distribution of the Size of JMEs in the
Bohai Sea Rim Region
As shown in Figure 2,
at the county and city scale, the size of JMEs in the central city is
relatively smaller than those in distant suburbs. At the city scale,
Qinhuangdao, Jining, Langfang, Weihai and Hengshui have the largest JME
employment size with more than 400 people. The JMEs employment sizes of Tai??an,
Handan, Dongying, Linyi and other cities are the smallest. The common characteristics of the latter cities is that they have few
JMEs (less than four). The enterprise size
of JMEs is related to their subordinate industries. The required minimum
economic scale varies according to subordinate industries.
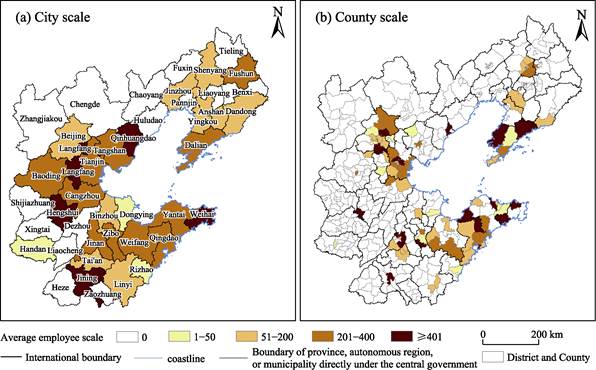
Figure 2 Map of spatial distribution of the average employee size of JMEs in the Bohai
Sea Rim region
Despite significant
differences in the average size of JMEs among cities, the average employment
sizes in Beijing?CTianjin?CHebei, Liaoning and Shandong are 256, 249 and 280,
respectively. Variance analysis shows that F (2.305) and SIG (0.101) indicate
failure to pass the test at 0.1 level. Judging from
this point of view, the attributes influencing the size of JMEs are more urban
attributes than regional attributes. A few differences will certainly exist
within each region. For instance, the coefficients of variation in
Beijing?CTianjin?CHebei and Shandong province are 2.111 and 2.018, respectively.
In Liaoning province, however, the average size and coefficient of variation of
JMEs are 249 and 1.739, respectively, while the average JMEs size in other
Liaoning cities is 100?C200, except for Dalian with more than 200 people.
4.2.2 Spatial Distribution of the Size of the Labour
Force in the Bohai Sea Rim Region
(1) Distribution characteristics of labour force
size and shared labour force size
The labour force
scale and the shared labour force scale show similar spatial distribution
characteristics (Figure 3), with Beijing, Tianjin, Shenyang, Dalian, Qingdao
and Jinan being the main labour supply places in the Bohai Sea Rim region. In terms of the
median size of local labour force, at the city scale, the Beijing?CTianjin?CHebei
region is the largest, followed by Shandong province. At the county scale,
Shandong province is the largest, followed by the Beijing?CTianjin?CHebei region. The median shared
labour force size is the opposite of the local labour force. The dispersion degree of the labour
force size in Beijing?CTianjin?CHebei at the urban scale is obviously lower than
at district or county scale, but little difference exists between Shandong and
Liaoning. The dispersion of the shared labour size at the urban scale is less
than that at district or county scale.
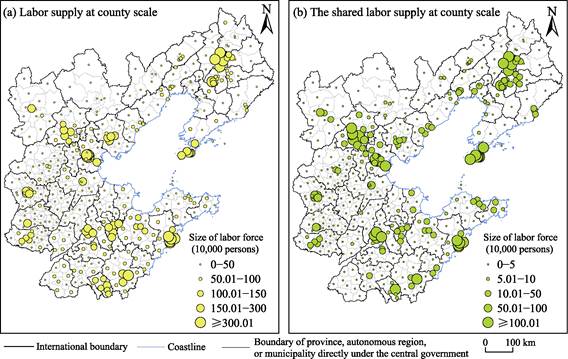
Figure 3 Map of spatial differentiation of labour force size and shared labour force
size in the Bohai Sea Rim region
(2) Distribution characteristics of the dedicated
labour force size
Transnational
enterprises adopt spatial synergetic distribution of employment demand and
supply with reference to the advantageous sectors of the local city and their
own subordinate sectors. Enterprises can share the spillover benefit of the
dedicated labour market when they match the supply and demand of the dedicated
labour force. The matching degree between enterprises and labour force is
measured by the size of employees in the subordinate sectors of specific JMEs
in local cities. The
geographical concentration index can be calculated by using Equation (1).
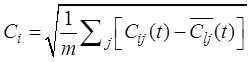 (1)
(1)
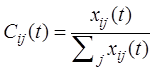 (2)
(2)
 (3)
(3)
where, represents the geographical
concentration degree of industry i,
represents the geographical
concentration degree of industry i,  represents the employees of industry i in city j,
  represents the share of employees of
industry i in city j,
represents the share of employees of
industry i in city j,  represents the share of total
employees in city j and m is the number of cities.
represents the share of total
employees in city j and m is the number of cities.
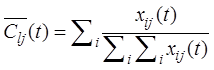
Real estate,
information service and public service have a high GCD, while wholesale and
retail and the petroleum industry have a low GCD (Figure 4). The percentages of
JMEs in chemical industry (7.34%), machinery and equipment manufacturing
(10.43%), electrical machinery manufacturing (12.04%), conveying machinery
manufacturing (10.87%), wholesale and retail (19.82%) and transportation
(5.73%) all exceed 5% in the Bohai Sea Rim region. The chemical industry agglomerates in Tianjin
and Shijiazhuang. The conveying machinery manufacturing industry agglomerates
in Beijing and Tianjin, while the electrical machinery manufacturing industry
agglomerates in Beijing, Tianjin and Shenyang. Machinery and equipment
manufacturing is widely dispersed in Shandong Peninsula, Shenyang, Dalian,
Beijing and Tianjin. Wholesale and retail and transportation highly agglomerate
in Beijing and Tianjin (Figure 5). Obviously, each city has different
advantageous sectors. The matching degree between supply and demand of the
dedicated labour force directly affects JMEs?? location selection and size.
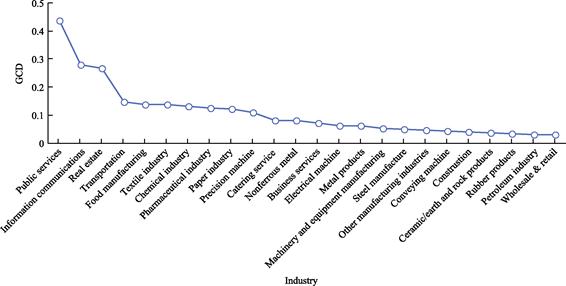
Figure 4 Geographical concentration degree of different industries in the
Bohai Sea Rim region
4.2.3 Determinants of the
Size of JMEs in the Bohai Sea Rim Region
This
paper constructs a model of factors that influence the size of JMEs from the
perspective of the local labour force. This model consists of the size of the
labour force supply, the size of the shared labour force, the size of the
dedicated labour force, enterprise attributes and city attributes. The variable
indicators are detailed in Table 2.
The following findings were derived: (1) Whether
the labour force size and shared labour force size are introduced separately or
enterprise attributes and urban attributes are introduced successively, the
high wage cost caused by the increase in the labour pool size restrains the
expansion of enterprise size. (2) The specialised sectors in local cities have
a significant promoting effect on the average JMEs employment size in the same
industry. The effective matching between the
employment demand of enterprises and the size of specialised urban
talents benefits the expansion of enterprise size. (3) The scale of the local
labour force has a significant and robust inhibiting effect on the scale of
JMEs in the two phases before and after 2001. However, the inhibiting effect of
the scale of the shared labour force and the expansion effect of the scale of
the dedicated labour force are not robust in the two phases. (4) The size of
JMEs is jointly influenced by the attributes of the parent and subsidiary
enterprises, and the direction of impact and the strength ranks of the
variables generating significant impact on enterprise size remain stable and
consistent. Specifically, the listed parent enterprise tends to encourage the
local subsidiaries to expand their size, but not significantly. If the
investments of JMEs in the Bohai Sea Rim region are the first ones, most of
them are tentative small-scale investments. The size of joint venture is larger
than that of sole proprietorship. The longer the local subsidiary exists, the
larger the size of the enterprise is. The size of the service industry is
significantly smaller than that of manu-
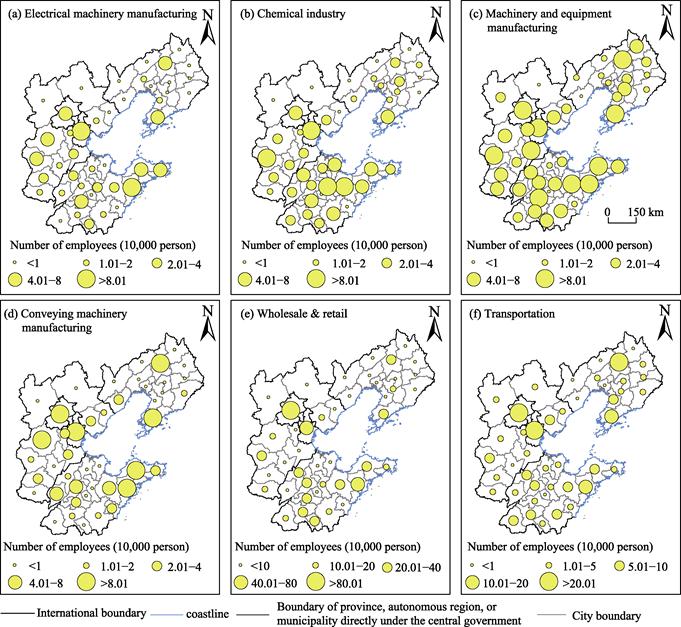
Figure 5 Map of spatial distribution of dedicated labour force in specific industries in
the Bohai Sea Rim region
facturing industry. (5) Third, the attributes of the local city
have a significant impact on the size of JMEs. While the size of JTE is
essentially the result of the joint effect of the enterprise and the local
city, the position of the local city is indispensable. However, the enterprise
agglomeration in local cities and the succeeding agglomeration effect of JMEs
have opposite influencing directions; the former is a positive incentive
effect, and the latter is a negative inhibiting effect. The preferential
policies of the development zone promote not only local agglomeration of JMEs
but also the expansion of JMEs size. The smaller the enterprise, the more
sensitive it is to the Japanese-speaking labour supply provided by the local
city.
5 Discussion and
Conclusion
Taking the Bohai Rim
region as an example, this paper analyses the combined effects of labour pool
factors, city attribute factors and enterprise attribute factors that affect
the size of Japanese enterprises. The following conclusions were derived:
(1) The local labour
force and the shared labour force have the same inhibiting effect on the size
of enterprise due to the labour cost increase brought by its expansion.
However, the size of the dedicated labour force has a significant incentive
effect on the size of the enterprise.
(2) Over time, the
strengthening of the inhibiting effect of the size of the shared labour force
and the weakening of the expansion effect of the size of the dedicated labour
force together led to the shrinking of the size of JMEs in the Bohai Sea Rim
region.
(3) The size of JMEs
is simultaneously affected by the attributes of the parent and subsidiary
enterprises. Among these attributes, age has the strongest positive promoting
effect on the size of an enterprise, while the subordinate industries of the
enterprise, mode of sole proprietorship and initial investment of the parent
enterprise have an inhibiting effect.
(4) Among the
attributes of the city, the development zone and local agglomeration have a
significant and steady promoting effect on enterprise size. The smaller the
enterprise is, the more sensitive it is to the supply of Japanese-speaking
labour provided by cities. Thus, the latter??s supply can promote local
agglomeration of small Japanese enterprises.
This dataset can
provide data support for relevant scholars to study the scale of JMEs in the
Bohai Sea Rim region. In addition, as the trend of anti-globalisation becomes
increasingly prominent, various countries are adopting subtle attitudes towards
globalisation and international cooperation. As for FDI, as the carrier of
globalisation, is it better to increase investment or to initiate divestment?
Is expanding or shrinking better? Is spatial agglomeration or diffusion
preferable? Which one between integration or
decentralisation of the industrial chain links should be adopted? All these
questions will to a certain extent affect the development of the local FDI
enterprise. The
dataset can contribute to the change tracking study described above.
Author Contributions
Shao, J.
And Gao, Y. F. collected and processed the data; Wang,
M. J. and Ma, H. W. wrote the data paper.
Conflicts of Interest
The
authors declare no conflicts of interest.
References
[1] Harushi shibaita. Overview
of Inbound and Outbound Enterprises (Country Edition) [M]. Tokyo: Toyo
Keizai, 2019.
[2] Wang, M. J., Ma, H.W., Shao, J., et al. Influence dataset of the local
labor market on the scale of Japanese Direct investment enterprises in Bohai
Sea Rim region (1990?C2016) [J/DB/OL].
Digital Journal of
Global Change Data Repository, 2023. https://doi.org/10.3974/geodb.2023.10.01.V1.
https://cstr.escience.org.cn/CSTR:20146.11.2023.10.01.V1.
[3] GCdataPR Editorial Office. GCdataPR data sharing policy [OL].
https://doi.org/10.3974/dp.policy.2014.05 (Updated 2017).
[4] Population Census Office under the State
Council, Department of Population and Employment Statistics National Bureau of
Statistics. Tabulation on the 2010 Population Census of the
People??s Republic of China by County [M]. Beijing: China Statistic
Press, 2012.
[5] Leading Group Office of the Third National
Economic Census of Beijing, Beijing Municipal Bureau of Statistics, Survey
Office of the National Bureau of Statistics in Beijing. Beijing
Economic Census Yearbook 2013 [M]. Beijing: China Statistic Press, 2015.
[6] Leading Group Office of the Third National
Economic Census of Tianjin, Tianjin Municipal Bureau of Statistics. Tianjin Economic Census Yearbook 2013 [M]. Beijing: China
Statistic Press, 2015.
[7] Leading Group Office of the Third National
Economic Census of Hebei Province, Hebei Provincial Bureau of Statistics. Hebei Economic Census Yearbook 2013 [M]. Beijing: China
Statistic Press, 2015.
[8] Leading Group Office of the Third National
Economic Census of Liaoning Province, Liaoning Provincial Bureau of Statistics.
Liaoning Economic Census Yearbook 2013 [M]. Beijing:
China Statistic Press, 2015.
[9] Leading Group Office of the Third National
Economic Census of Shandong Province, Shandong Provincial Bureau of Statistics.
Shandong Economic Census Yearbook 2013 [M]. Beijing:
China Statistic Press, 2015.