Trade Network Dataset Development in 227 Countries and Regions (1985–2015)
Jiang, X. R.1 Yang, Y. C.2 Wang, S. L.1*
1. College of Resource Environment and Tourism, Hubei University of Arts and Science, Xiangyang 441053, China??
2. College of Earth and Environmental Sciences, Lanzhou University, Lanzhou 730000, China
Abstract: Based on the bilateral trade data of various countries published by United Nations Conference on Trade and Development (UNCTAD), this paper explored the spatial distribution and evolution characteristics of trade networks in 227 countries and regions during the period from 1985 to 2015 (5 sections selected). By calculating degree centrality, structure entropy and other indicators via Ucinet, the researchers obtained the trade network dataset of 227 countries and regions in this period. The results showed that the community evolution of global trade network had been through four stages: initially, global trade was dominated by developed countries; then, Asian countries began to emerge; later on, the Asian community became independent in global trade; eventually the three-pillar system was formed. The result data and process data were included in this dataset. Specifically, the result data refer to: (1) the adjacency matrix of global trade networks in 1985, 1995, 2005, 2009, and 2015; (2) the values of network structure entropy in major countries around the world in 1985 and 2015; (3) the connection flow data of global trade network Top1 and Top2 in 2015. The process data in the attachment are the raw data of bilateral imports and exports downloaded from UNCTAD database. The dataset is archived in .xlsx format with a data size of 11.4 MB (8.7 MB after compression). The research results of the dataset were published in Geographical Research (Vol. 37, No.3, 2018).
Keywords: global trade network; network matrix; structure entropy; Geographical Research
1 Introduction
With the development of economic globalization and regional economic integration, trade among countries and regions has becoming increasingly interrelated and interactive, forming a complex geographical network[1]. As an effective quantitative tool in analyzing trade relations among countries regionally and even globally, social network analysis (SNA) can help explore not only trade connections between countries but also local and global features of the spatial distribution[2]. In this regard, international trade research, which is based on complex network theory, has become a hot topic in such fields as economics, geography and international relations, delivering a variety of achievements. However, researches that study China’s trade relations mostly focus on its peripheral countries involved in Belt and Road Initiative, with few extending to the global scope over a long time span. This dataset, on the other hand, depicted a global trade picture from the perspectives of trade network topology, community division and market diversification, with reference to the bilateral trade data of various countries from 1985 to 2015 published by United Nations Conference on Trade and Development (UNCTAD). It could provide statistic underpinning for researches in global trade landscape reconstruction and geo-economics.
2 Metadata of Dataset
Metadata of the “Dataset on bilateral trade network relationship among 227 countries and regions of the world (1985–2015)”[5] are displayed in Table 1.
Table 1 Metadata of “Dataset on bilateral trade network relationship among 227 countries and regions of the world (1985–2015)”
|
Items
|
Description
|
|
Dataset full name
|
Dataset on bilateral trade network relationship among 227 countries and regions of the world (1985–2015)
|
|
Dataset short name
|
GlobalTradeNetwork1985-2015
|
|
Authors
|
Jiang, X. R., College of Resource Environment and Tourism, Hubei University of Arts and Science, cobainj@163.com
Yang, Y. C., College of Earth and Environmental Sciences, Lanzhou University, yangych@lzu.edu.cn
Wang, S. L., College of Resource Environment and Tourism, Hubei University of Arts and Science, wangshenglan05@163.com
|
|
Geographical region
|
227 countries and regions around the world Year 1985, 1995, 2005, 2009, 2015
|
|
Data format
|
.xlsx Data size 11.4 MB (8.7 MB after compression)
|
|
Data files
|
Raw data of bilateral trade in countries and regions during 1985–2015, the adjacency matrix, structure entropy, connection flow data of Top1 and Top2
|
|
Foundation
|
National Natural Science Foundation of China (41571155)
|
|
Data publisher
|
Global change research data publishing and repository, http://www.geodoi.ac.cn
|
|
Address
|
No. 11A, Datun Road, Chaoyang District, Beijing 100101, China
|
|
Data sharing policy
|
Data from the Global Change Research Data Publishing & Repository includes metadata, datasets (data products), and publications (in this case, in the Journal of Global Change Data & Discovery). Data sharing policy includes: (1) Data are openly available and can be free downloaded via the Internet; (2) End users are encouraged to use Data subject to citation; (3) Users, who are by definition also value-added service providers, are welcome to redistribute Data subject to written permission from the GCdataPR Editorial Office and the issuance of a Data redistribution license, and; (4) If Data are used to compile new datasets, the ‘ten percent principal’ should be followed such that Data records utilized should not surpass 10% of the new dataset contents, while sources should be clearly noted in suitable places in the new dataset[6]
|
|
Communication and searchable system
|
DOI, DCI, CSCD, WDS/ISC, GEOSS, China GEOSS
|
3 Methodology
The raw data are sourced from UNCTAD. The raw data in 1985, 1995, 2005, 2009, and 2015 were selected as the objects of research on the basis of systematic sampling and critical node principle, as well as considering the availability of China’s data. There can be wide gaps between different countries in terms of foreign trade size, with bilateral trade volumes ranging from tens of dollars to billions of dollars. Despite their disadvantaged economic level and weak international influence, some periphery countries, such as countries in Africa and Pacific Islands, may have a decisive geopolitical significance in global power politics. In this regard, to display a comprehensive global trade network, this dataset has included all recorded trade flows, covering almost all countries and regions around the world. It divides the world into seven sections, namely Asian (West Asia excluded), Europe, North America, South America (including Central America and the Caribbean), Africa (North Africa excluded), Australia, and Middle East (including West Asia and North Africa), so that the global trade landscape and its evolution process can be precisely described.
3.1 Algorithm Principle
It is found when searching trade data in UN Comtrade database that reporters are not fully mapped to the 227 countries and regions as partners. This can be solved by reversing the roles importer and exporter. For example, when the import data of reporter A from its partners are absent, we could acquire its equivalent by searching for the export data of A’s partners towards A.
The global trade network constructed by this dataset is a weighted directed complex network, whose in-degree and out-degree refer to import flow and export flow of a certain country or region respectively. On this basis and with reference to relevant literature, the complexity characteristics of global trade network are described by degree centrality (including in-degree, out-degree and overall value of degree), modularity (community division), structure entropy and the number of markets with trade volume over 100 million dollars (degree of market diversification). These indicators can be calculated using Excel, Ucinet and Gephi, and spatially visualized via ECharts from Baidu.
3.2 Technical Route
(1) The formula for degree centrality: Define i to be a social network node, and the strength formula on i by Liu, Jun[7] is
 (1)
(1)
where Si is the strength of node i, and wij is the weight of edges that connects node i and node j.
To indicate the direction of the trade network, the in-degree and out-degree of node i are defined as follows:
 ,
,  (2)
(2)
where  is the outdegree of node i,
 is the indegree of node i; aij refers to the export volume of country i towards country j, while aji means right the other way around.
(2) The division of network community: modularity is an important indicator of the quality of division. Modularity calculation with Newman[8] method is displayed as follow:
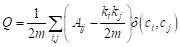 (3)
(3)
where Q is the quantitative value of network modularity, and Aij is the element of adjacency matrix corresponding to the network (if node i and node j are connected, then the value of Aij is 1, otherwise its value would be 0); ki is the degree value of node i, and kj is the degree value of node j, ci refers to the community that includes node i; if nodes i and j are in the same community, then δ(ci,cj ) =1, otherwise, δ(ci,cj ) =0; m is the number of edges in the network, and 2m is the sum of degree values of all nodes.
Community division can be drawn by Gephi. When there are dense connections in trade between two countries, the units will, according to the gravity model, come closer and cluster into a community.
(3) The formula for structure entropy: following the definition of structure entropy by Wu et al.[9], the formula is built on node properties. The network heterogeneity is manifested in the uncertainty of the probability distribution which the relative number and weight of edges of one node are subject to. The degree of trade market diversification is determined by the number of markets with trade volume over 100 million dollars. The formula for structure entropy is as follows:
 (4)
(4)
where E refers to the value of structure entropy, Ii is the ratio of degree value of node i to the overall degree value of the network, representing the importance of node i in the network. The value of Ii is calculated via:
 (5)
(5)
where ki is the degree value of node i.
4 Results
4.1 Dataset Composition
The process data and the resultwere included in this dataset. The final data consists of: (1) structural entropy data of Global trade networks of countries in 1985 (Figure 1); (2) structural entropy data of Global trade networks of countries in 2015; (3) statistics of the first trade markets (Figure 2); (4) statistics of the first two trade markets ( Figure 3).
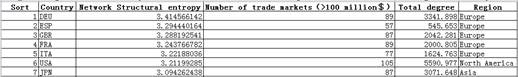
Figure 1 Example from network structural entropy of main countries and districts in 1985
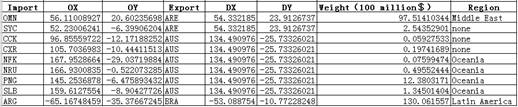
Figure 2 Example from top1 global trade network in 2015
The process data in the attachment are the raw data of bilateral imports and exports downloaded from UNCTAD database. The dataset is archived in .xlsx data format with data size of 11.4 MB.
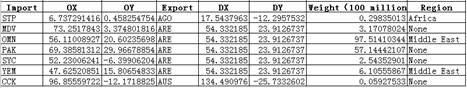
Figure 3 Example from top2 global trade network in 2015
4.2 Data Results
The data results include: (1) The raw data of bilateral trade in countries around the world in 1985, 1995, 2005, 2009, and 2015, and the corresponding transformation matrix data. Due to the access limits of UNCTAD Statistics database and the adjustment of national administrative division in history, data of different years may incorporate different countries and regions. Specifically, the trade data of 192 countries and regions in 1985 are collected, with 217 in 1995, 226 in 2005 and 2009, and 227 in 2015. Basically, this dataset has covered almost all countries and regions in the seven continents, including some island countries and overseas territories. Based on matrix data acquired, the spatial distribution and community division of global trade network are drawn with Gephi and ECharts (Figure 4). As shown in Figure 4, the global trade has been moving towards multi-polarity in the past three decades. As of today, the three-pillar landscape has been formed, with North America, Europe and East Asia dominating the whole picture.
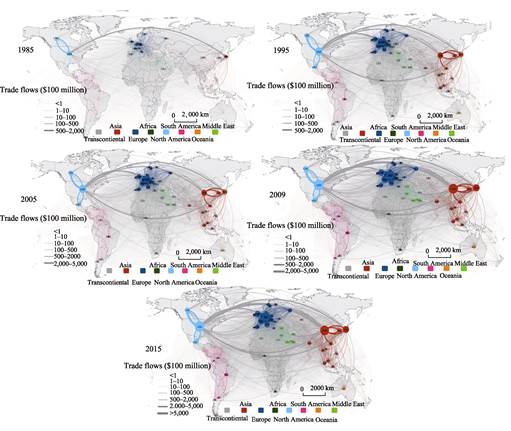
Figure 4 Spatial Distribution of Global Trade Network in 1985–2015[1]
(2) In an ever more globalized world, countries can hardly isolate themselves from bilateral trade. To avoid interference from trivial volumes and to simplify calculation, the researchers set up a threshold in the calculation of structure entropy and foreign market number, stipulating that only those trade volumes with over 100 million dollars are valid. By comparing the two indicators in 1985 and 2015, it is found that emerging economies, particularly the BRICs (Brazil, Russia, India and China), have seen a significant increase in structure entropy and foreign market number, with some even exceeding developed countries, which implies that emerging markets are becoming major players in global trade.
(3) For major powers, every economic variable has its strategic significance, especially in reflecting the trade relations with foreign countries. Select the largest trade flow data of each country from the 2015 global trade network and draw the Top1 network, then select the two largest trade flow data of each country to draw the Top2 network (Figure 5). It is evidently shown in the two networks that China, America and Germany are the three largest global traders and that they have different influence scopes and regional competition in global trade market. Apparently, the three powers all manifest their core interests in their peripheral
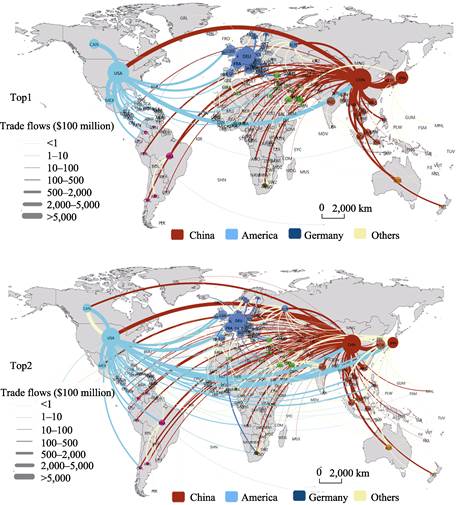
Figure 5 Spatial distribution of Top1 and Top2 networks in 2015
countries, which proves the great implications of geographical distance on economic and trade cooperation. Besides, the trade competition between China and America is most fierce in Asia and Pacific area, Africa and Latin America.
5 Discussion and Conclusion
Based on the bilateral trade data of countries around the world, this dataset, via social network analysis and visualized tools, delves into the evolution process of global trade network, the status change of global powers and their geo-economic competition over the past three decades. As demonstrated in the result data, the global trade network has become increasingly diversified and complicated, with the pivot moving eastward; the rise of China culminates in the three-pillar landscape of global trade; countries along the Belt and Road have become the new growth areas of China’s foreign trade, which presents the possibility of extending the Belt and Road Initiative to African and Latin American countries and thus transforming economic advantages into strategic implications globally. On these grounds, this dataset can provide basic data and offer reference for decision-making in geo-economic issues, economic and trade cooperation among BRI countries and for policymaking of China’s foreign trade. However, it should be noted that there are differences between bilateral trade data from UN and from custom services due to their individual statistical scales and standards. Consequently, there could be some bias in the calculation results of indicators at certain nodes, although the overall network would not possibly be affected. On the other hand, this dataset only considers total volumes of bilateral trade because of limited access to the UN Contrade database. Therefore, it is suggested that further research should look into trade data of specific commodities, focus on trade networks of commodities in different categories, and explore the driving mechanisms behind these networks.
Author Contributions
Jiang, X. R. designed the model and algorithms and wrote the paper; Yang, Y. C. set up the framework for the development of the dataset; Wang, S. L. completed the data collection, processing and verification.
References
[1] Jiang, X. R., Yang, Y. C., Wang, S. L. Spatial and temporal patterns of evolution of global trade networks during 1985–2015 and its enlightenment to China’s geostrategy [J]. Geographical Research, 2018, 37(3): 495–511.
[2] Zheng, J., Zhang, Y. Q., Huang, X. Evolution of the maritime silk road trade network structural characteristics in 2000–2014 [J]. Journal of International Trade, 2017(3): 154–165.
[3] Pan, F. H., Lai, Z. Y., Ge, Y. J. The surrounding geopolitical environment of China: a social network analysis based on trade data [J]. Geographical Research, 2015, 34(4): 775–786.
[4] Zou, J. L. Liu, W. D. Trade network of China and countries along Belt and Road initiative” areas from 2001 to 2013 [J]. Scientia Geographica Sinica, 2016, 36(11): 1629–1636.
[5] Jiang, X. R., Yang, Y. C., Wang, S. L. Dataset on bilateral trade network relationship among 227 countries and regions of the world (1985–2015) [DB/OL]. Global Charge Research Data Publishing & Repository, 2019. DOI: 10.3974/geodb.2019.03.14.V1.
[6] GCdataPR Editorial Office. GCdataPR data sharing policy [OL]. DOI: 10.3974/dp.policy.2014.05 (Updated 2017).
[7] Liu, J. Lectures on Whole Network Approach: A Practical Guide to UCINET [M]. Shanghai: Truth & Wisdom Press and Shanghai People’s Publishing House, 2009.
[8] Newman, M. E. J. The structure and function of complex networks [J]. SIAM Review, 2003, 45(2): 167–256.
[9] Wu J., Tan, Y. J., Deng, H. Z., et al. Heterogeneity of scale-free network topology [J]. Systems Engineering— Theory & Practice, 2007, 27(5): 101–105
[10] Du, D. B., Ma, Y. H. Geography of containment and anti-containment of China’s peaceful rise [J]. World Regional Studies, 2012, 21(1): 1–16.