Wheat Leaf Area Index Dataset of Luancheng Station, Hebei, China (2019) ?? China Leaf Area Index
Observation Cal-Val Network??s Serial Dataset
Sun, Y.1 Yang, J.1 Zhou, X.1 Yu, T.1 Gu, X. F.1* Chen, Y. P.2*
1. Aerospace Information
Research Institute, Chinese Academy of Sciences, Beijing 100101, China;
2. University of Electronic
Science and Technology of China, Chengdu 611731, China
Abstract: The leaf area index (LAI)
observation calibration-validation network site at Luancheng Station, Hebei
province (central coordinates: 114??41ʹ34.80ʺE, 37??53ʹ22.51ʺN), was completed
on March 22, 2019. This site is part of China??s LAI observation
calibration-validation network (China LAI Cal-Val) initiated in 2018 and
utilizes the LAI wireless sensor network observation system (LAI-NOS) to
automatically collect continuous LAI data. Luancheng Station is a typical
northern station within the China LAI Cal-Val network and operates in a winter
wheat-summer maize rotation system in the warm temperate zone of China. At this
site, LAI data were collected throughout the wheat growing season of 2019, from
March 25 to June 10, from three adjacent LAI-NOS nodes (0901, 0902, and 0904).
A dataset was assembled based on the steady window algorithm by extracting data
of early morning and evening. The dataset includes (1) the geographic locations
of the three LAI-NOS nodes at Luancheng Station in 2019; (2) daily LAI data of
the three LAI-NOS nodes at Luancheng Station from March 25 to June 10, 2019.
The dataset is archived in .xlsx, .shp, and .kmz formats and consists of nine
files with a size of 25.6 KB (compressed into two files with a total size of
21.9 KB).
Keywords: Luancheng, Hebei;
wheat; China LAI Cal-Val; LAI-NOS; steady window algorithm
DOI: https://doi.org/10.3974/geodp.2023.03.04
CSTR: https://cstr.escience.org.cn/CSTR:20146.14.2023.03.04
Dataset Availability Statement:
The dataset
supporting this paper was published and is accessible through the Digital Journal of
Global Change Data Repository at: https://doi.org/10.3974/geodb.2023.09.08.V1
or https://cstr.escience.org.cn/CSTR:20146.11.2023.09.08.V1.
1 Introduction
The
leaf area index (LAI), a dimensionless value, is widely recognized as half of
the total green leaf area per unit ground area[1]. LAI is critical
for the study of vegetation canopies. As a core structural parameter of the
vegetation canopy, it is closely related to biological and physical vegetation
processes, such as photosynthesis, respiration, and transpiration. LAI can
provide quantitative information on energy exchanges at the surface of the
vegetation canopy[2]. It is an important input parameter for global
ecological research, such as for reflecting vegetation growth, evaluating
vegetation productivity, and analyzing carbon cycling and climate. Hence, quick
and accurate acquisitions of LAI data are essential to evaluate plant growth
and the structure and function of ecosystems.
In recent years,
benefiting from the rapid progress in remote sensing technology, several
satellites with different temporal/spatial resolutions and imaging modes have
been launched, providing users with rich remote sensing data. On this basis,
various LAI remote sensing data products have been derived, such as MODIS LAI,
GLASS LAI, and GEOV1 LAI[3] (Table 1). The inversion process of LAI
remote sensing data products is affected by surface heterogeneity, remote
sensing data, computational models, and other factors. The application of LAI
products depends on their accuracy and reliability and on whether they can
capture the actual conditions of surface parameters. Accordingly, the research
on the validation of LAI remote sensing products with ground truth values is of
great significance. The ground truth values of LAI remote sensing products generally
come from ground observation values that represent ground targets. LAI measurements
can be direct and indirect. Direct measurements have the highest accuracy among
all LAI measurement methods and are often taken as a calibration standard for
other methods, but they are destructive and require considerable time, labor,
and material resources. Additionally, the representativeness of the sample is
sometimes debatable. Regarding the collection method of leaves, direct measurements
can be subdivided into destructive and non-destructive approaches[4].
The former include methods based on representative trees, regional sampling,
grid points, and grid networks, while the latter refer mostly to deciduous leaf
collection[5, 6].
Indirect
measurements usually obtain LAI data through optical instruments and therefore
are also known as optical instrument methods. Common optical instruments
include the LAI-2000 plant canopy analyzer, the TRAC analyzer, and
hemispherical imaging-based LAI meters. Compared with direct measurements,
indirect measurements are widely used for ground data acquisition of vegetation
canopy parameters due to high portability, speed, efficiency, and measurement
accuracy, as well as strong versatility. Amid the development of wireless
network technologies, the combination of wireless sensor networks and LAI measurements
based on optical instruments has been widely applied in practice. Developed
with this technology, the LAI wireless sensor network observation
system (LAI-NOS) has all the advantages of single-point
measurements based on the optical instrument method, permitting long-term and
large-scale monitoring with remote sensing. The measurement results are accurate
and reliable, convenient for maintenance, and provide long-term, stable, and
reliable ground observation data for LAI remote sensing products[7].
LAI is the ratio of vegetation leaf area to
land area, which tends to not change significantly in a short period of time.
However, changes in the data collection environment (such as variations in
illumination, winds, clouds, and other environmental conditions) can cause
large fluctuations in the measured value. While manual measurements can be
conducted in the morning and evening or in windless or cloudy weather,
automatic instruments have difficulty in determining the suitability of environmental
conditions. At the same time, the LAI-NOS generally samples every 5 min,
resulting in a large number of redundant LAI values. To address this issue,
this paper analyzed the production and validation results of the Wheat LAI Dataset of Luancheng Station, Hebei, China (2019)??China LAI Observation Cal-Val Network??s serial dataset.
The steady window algorithm was used to screen and
preprocess the raw
measurements, remove outliers, and obtain valid ground measurements
per
day[8].
Table 1 Major
LAI remote sensing data products
|
Product
|
Source
|
Spatial resolution
|
Temporal resolution
|
Main features
|
|
MODIS LAI
|
National Aeronautics and Space Administration
|
0.5 km
|
8 d
|
Global coverage,
suitable for large-scale regional LAI monitoring
|
|
SPOT/VEGETATION
LAI
|
Institute G??ographique National
|
0.5 km
|
10 d
|
Provides
high-precision LAI monitoring data, suitable for as agricultural and forest
studies
|
|
GLOBMAP LAI
|
Institute of Geographic Sciences and Natural Resources Research, CAS
|
1 km
|
10 d
|
Provides
high-quality LAI monitoring data that can be applied in conjunction with
other remote sensing products
|
|
CYCLOPES LAI
|
European Geosciences Union
|
0.5 km
|
10 d
|
Provides
high-quality LAI monitoring data by combining multiple remote sensing and
ground observation data
|
|
GLASS LAI
|
Beijing Normal University
|
0.5 km
|
8 d
|
Uses a
generalized neural network
|
2 Metadata of the Dataset
The
metadata of the Wheat leaf area index dataset of Luancheng Station Hebei China
(2019)??China Leaf Area Index Observation Cal-Val Network??s serial
dataset is summarized in Table 2.
Table 2 Metadata summary of the Wheat leaf area index dataset of Luancheng Station Hebei
China (2019)??China Leaf Area Index
Observation Cal-Val Network??s serial dataset
|
Items
|
Description
|
|
Dataset
full name
|
Wheat
leaf area index dataset of Luancheng Station Hebei China (2019)??China
Leaf Area Index Observation Cal-Val Network??s serial dataset
|
|
Dataset
short name
|
LuanchengLAI_2019
|
|
Authors
|
Sun,
Y., Aerospace Information Research Institute, Chinese Academy of Sciences,
sunyuan@aircas.ac.cn
Yang,
J., Aerospace Information Research Institute, Chinese Academy of Sciences,
yangjian@aircas.ac.cn
Gao,
H. L., Aerospace Information Research Institute, Chinese Academy of Sciences,
gaohailiang@aircas.ac.cn
Tao,
Z., Aerospace Information Research Institute, Chinese Academy of Sciences,
taozui@aircas.ac.cn
Wang,
C. M., Aerospace Information Research Institute, Chinese Academy of Sciences,
wangchunmei@aircas.ac.cn
Gu, X.
F., Aerospace Information Research Institute, Chinese Academy of Sciences,
guxf@aircas.ac.cn
Zhou,
X., Aerospace Information Research Institute, Chinese Academy of Sciences,
zhouxiang@aircas.ac.cn
|
|
Geographical
region
|
LAI
observation calibration-validation network at Hebei Luancheng Station of the
China LAI observation Cal-Val network
|
|
Year
|
March 25?CJune 10,
2019
|
|
Temporal
resolution
|
One
day
|
|
Spatial
resolution
|
10
m??10 m
|
(To be continued on the next page)
(Continued)
|
Items
|
Description
|
|
Data
format
|
.xlsx, .shp, .kmz
|
|
|
|
Data
size
|
25.9 KB
|
|
|
|
Data
files
|
(1)
Geographic location data and photos of three LAI-NOS nodes at Luancheng
Station in 2019; (2) daily LAI data of the three LAI-NOS nodes at Luancheng
Station from March 25 to June 10, 2019
|
|
Foundations
|
Ministry
of Finance of P. R. China (Y930280A2F, Y930070A2F)
|
|
Data
publisher
|
Global Change Research Data Publishing &
Repository, http://www.geodoi.ac.cn
|
|
Address
|
No.
11A, Datun Road, Chaoyang District, Beijing 100101, China
|
|
Data
sharing policy
|
(1) Data
are openly available and can be freely downloaded via the Internet; (2) end
users are encouraged to use Data subject to citation; (3)
users, who are by definition also value-added service providers, are welcome
to redistribute Data subject to written permission from the GCdataPR
Editorial Office and the issuance of a Data redistribution license; and
(4) if Data are used to compile new datasets, the ??ten percent
principal?? should be followed such that Data records utilized should not
surpass 10% of the new dataset contents, while sources should be clearly
noted in suitable places in the new dataset[9]
|
|
Communication and searchable system
|
DOI, CSTR, Crossref, DCI, CSCD, CNKI,
SciEngine, WDS/ISC, GEOSS
|
3 Methods
3.1 LAI-NOS Algorithm
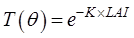
The
LAI-NOS hardware includes sensor terminals, collection nodes, sink nodes, and
auxiliary equipment, with servers and clients mainly for storing and managing
data. Figure 1 shows the overall framework of the LAI-NOS[10]. The
LAI sensor terminal is simple in structure, small in size, and convenient for
deployment, featuring high measurement accuracy. It is mainly used for
acquiring and analyzing vegetation canopy images and measuring parameters, and
is suitable for measuring scrubby gramineous plants and shrubs, as well as tall
trees.
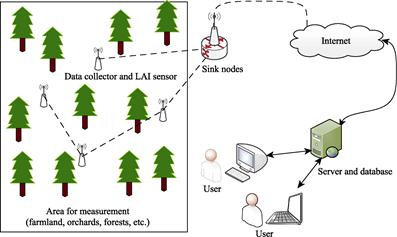
The LAI-NOS
follows three steps to acquire vegetation canopy parameters: canopy image
acquisition, image analysis and processing, and parametric statistics and
calculation. For this study, the acquisition of vegetation canopy images was
completed through hemispherical photography, which involves shooting from a
bottom-up or top-down perspective. The OV2640 fisheye lens produced by
OmniVision was used to collect vegetation canopy images, featuring a short
focal length (<16 mm) and a large field of view (typically close to 180??).
The imaging principle of the fisheye lens[11] is illustrated in
Figure 2.
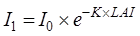
The Beer-Lambert law states that the
absorption of sunlight by a homogeneous solution relates to its path through
the solution and the solution concentration, but not to the incident light.
Assuming that the leaves of the vegetation canopy are randomly distributed and
have random inclination angles, the area of a single leaf is much smaller than
the total area of the canopy, and the overall vegetation canopy can be regarded
as a homogeneous solution with leaves as solutes. According to the Beer-Lambert
law, the intensity of solar radiation after it is attenuated by passing through
the canopy is given by the following Equation:
 (1)
(1)
 (2)
(2)
|
|
|
|
Figure 1 Overall framework of the
LAI-NOS[10]
|
Figure 2 Imaging principle of fisheye lens
|
where  is solar
radiation above the canopy;
is solar
radiation above the canopy;  is the solar
radiation below the canopy after being blocked out by the canopy; K is
extinction coefficient;
is the solar
radiation below the canopy after being blocked out by the canopy; K is
extinction coefficient;  is the transmissivity at an
incident angle of ??. Considering the direct incidence of light, can express the porosity of the canopy; K relates
to the incident angle of light ?? and the leaf inclination angle
is the transmissivity at an
incident angle of ??. Considering the direct incidence of light, can express the porosity of the canopy; K relates
to the incident angle of light ?? and the leaf inclination angle  . Then, the calculation Equation for LAI is derived according
to the intensity of solar radiation:
. Then, the calculation Equation for LAI is derived according
to the intensity of solar radiation:
 (3)
(3)
 (4)
(4)
where is the projection function, which represents the projection
area per unit leaf area on a plane perpendicular to the direction of ?? when the
viewing angle is ?? and the leaf inclination angle is ;
is the projection function, which represents the projection
area per unit leaf area on a plane perpendicular to the direction of ?? when the
viewing angle is ?? and the leaf inclination angle is ;  is the LAI value
without considering the clumping effect[12]. From the imaging
principle of hemispherical images, ?? in the above equation is the camera??s
angle of view.
is the LAI value
without considering the clumping effect[12]. From the imaging
principle of hemispherical images, ?? in the above equation is the camera??s
angle of view.
When the incident
angle is 57.5??, the projection function value is independent of the leaf inclination
angle, and the projection function G value is close to 0.5[13, 14].
Equation (5) can be simplified as:
 (5)
(5)
In practice, the assumption of a random distribution of leaves is
difficult to satisfy, especially in forest areas, where the measurement results
are affected by the clumping effect, resulting in significant errors in the
final LAI value. Wilson et al.
introduced the clumping index  to correct the
accuracy and reliability of LAI measurements. Common approaches for calculatinginclude the finite-length averaging method, the gap-size distribution
method, and the path-length distribution method[15]. The finite
length averaging method can be used to calibrate the LAI and eliminate the
clumping effect by measuring and calculating the sub-line transect of finite
length. The calculation Equation ofis as follows:
to correct the
accuracy and reliability of LAI measurements. Common approaches for calculatinginclude the finite-length averaging method, the gap-size distribution
method, and the path-length distribution method[15]. The finite
length averaging method can be used to calibrate the LAI and eliminate the
clumping effect by measuring and calculating the sub-line transect of finite
length. The calculation Equation ofis as follows:
 (6)
(6)
where,
is the clumping
index of the field of view ring corresponding to the viewing angle ??;  is the canopy porosity at the viewing angle ?? and
azimuth angle
is the canopy porosity at the viewing angle ?? and
azimuth angle  .
.
When the canopy
porosity is 0 within a certain range of viewing angles, the clumping index
cannot be calculated. At this time, it is considered that there is only one background
pixel within the sub-viewing angle, and the calculation is shown in Equation
(7):
 (7)
(7)
where
N is
the total number of pixels in the effective area of the hemispherical image.
The true LAI can be obtained after correction with the:
 (8)
(8)
3.2 Raw Data Acquisition
The
area for raw data acquisition of the LAI-NOS is located at the Luancheng
Station in the LAI ground observation network of the Chinese Academy of
Sciences. This area locates in Shijiazhuang city, Hebei province. Luancheng
Station is in a semi-humid region with a climate of warm-temperate monsoon, in
the center of the arid climate zone of the North China Plain. It has an annual
precipitation of 530 mm and an altitude of 160?C820 m, with a mild climate,
sufficient sunshine, moderate precipitation, and four distinct seasons.
Luancheng Station is dominated by meadow cinnamon soils. The farmland ecosystem
is a winter wheat-summer maize double cropping system representing the typical
high-yield agricultural ecological type of meadow cinnamon soil in the north of
the North China Plain. It is also located in the Taihang Mountain piedmont
plain, with an area of 49,800 km2 and 38 million mu (??2,533,333.33 ha) of arable land, characterized by intensive high-yield, resource-constrained,
well-irrigated agricultural, and suburban agricultural ecology.
The measuring
frequency of each node in the LAI-NOS is 5 min, and each node automatically
measures 288 points of raw LAI data every day and sends them back to the
server. This dataset comprises all the valid raw data from the LAI-NOS from
March 25 to June 10, 2019, with a total of more than 24,000 points of data,
including time of data acquisition, air temperature, and LAI. The valid raw
data totaled more than 10,000 points after some missing or invalid data caused
by weather effects were removed.
|
|
|
|
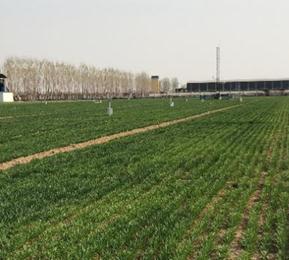
(a) Site photo of the experimental area of Luancheng Station
|
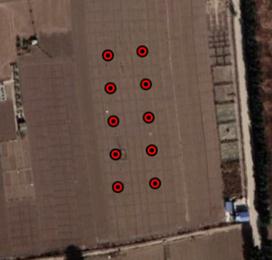
(b) Layout of instruments at
Luancheng Station
|
Figure 3 Experimental area and
nodes at Luancheng Station
3.3 Data Processing
The
LAI accuracy correction algorithm of the LAI-NOS follows three steps: (1)
extract data of early morning and evening, and then filter out predefined
outliers, such as those caused by environmental factors, i.e., too bright or
too dark light, cloud interference, and equipment failures in data collection;
(2) use the box plot to filter out data outliers; (3) use the steady window
algorithm to accurately tune the original data. The core idea of the steady
window algorithm is to find the steadiest interval with the smallest standard
deviation of LAI in the time window, and then take the average value of LAI in
that interval as the representative value of LAI for that day. Finally, the
daily wheat LAI dataset (2019) was obtained from the LAI-NOS at Luancheng
Station.

Figure
4 Accurate correction strategy for LAI data
of the LAI-NOS
With the steady
window algorithm, the accurate correction of raw data proceeds as follows:
(1) Preprocess
each piece of data to determine whether there are any outliers that need to be
removed, such as those resulting from communication anomalies, image darkness,
failed conversion of data formats, improper allocation of image memory, and
image overexposure.
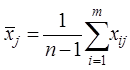
(2) Set the
window size as m, and calculate the mean and variance corresponding to
each window through window sliding, as shown in Equation (9) and (10):
 (9)
(9)
 (10)
(10)
where,
 is the average of the j-th window;
 is the i-th data of the j-th window;
 is the variance of the j-th window.
(3) Equation
(10) finds the minimum variance in Equation (9) and is evaluated with the
following conditions:
 (11)
(11)
where,
 is the set threshold, with an
empirical value of 0.5. The empirical value greater than 0.5 indicates that the
variance is too large and the data is unstable.
is the set threshold, with an
empirical value of 0.5. The empirical value greater than 0.5 indicates that the
variance is too large and the data is unstable.
(4) If there is
a variance satisfying Equation (11), the average value of the window corresponding
to this variance is taken as the representative value of LAI. If not, the system
concludes that no valid data are available for that day.
4 Data Results and Validation
4.1 Data Composition
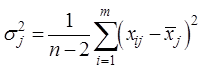
The
dataset contains LAI data collected in the wheat growing season from March 25
to June 10, 2019 (from wheat turning green period to maturation), from three
adjacent LAI-NOS nodes (0901, 0902, and 0904) at Luancheng Station. It includes
(1) the geographic location of three nodes at Luancheng Station in 2019; (2)
daily LAI data of the three LAI-NOS nodes at Luancheng Station from March 25 to
June 10, 2019. The dataset is archived in .xlsx, .shp, and .kmz formats, and
consists of nine files with a size of 25.6 KB (compressed into two files, 21.9
KB).
4.2 Data Products
The
daily wheat LAI dataset (2019) from March 25 to June 10, 2019 was obtained from
the three LAI-NOS nodes at Luancheng Station of the China LAI observation Cal-Val network.
Figure 5 Daily LAI data at three LAI-NOS nodes of
Luancheng Station in Hebei (Mar. 25?CJune 10, 2019)
4.3
Data Validation
To
verify the accuracy of the LAI measurements of the LAI-NOS system, an
experiment was carried out on August 15, 2023, at Luancheng Station in the LAI
ground observation network of the Chinese Academy of Sciences, and the
LAI-2200C of LI-COR Company, USA, was used for reference. The specific process
of data acquisition was as follows: Through back-to-back measurements, one
group of researchers collected the LAI value with LAI-2200C at the same
position of the LAI-NOS node; another group downloaded the LAI value of the day
from the system; then Passing-Bablok (PB) regression was carried out on the
measurements of the two groups. PB regression is a method of statistical
analysis that widely used in the comparative study of methods and instruments.
It uses non-parametric regression to fit parameters a and b of the
linear equation y = a + bx.
Intercept a is a measure of the systematic
difference between the two methods. The 95% confidence interval of intercept a can be used to test the hypothesis
that a = 0. If the confidence
interval of a contains the
value of 0, the assumption is accepted, and there is no significant difference
between the value of a and 0;
otherwise, the hypothesis is rejected, and the value of a is significantly different from 0. Slope b is a measure of the proportional difference
between the two methods. The 95% confidence interval of slope b can be used to test the hypothesis
that b = 1. If the confidence
interval of b contains a value
of 1, the assumption is accepted, indicating that there is no significant difference
between the value of b and 1;
otherwise, the hypothesis is rejected, which means that the value of b is significantly different from 1.
The intercept of
the PB regression was 2.411,5, and the 95% confidence interval is
−0.653,4?C3.697,1, including 0 (Table 3). The slope of the PB regression was
1.081,6, and the 95% confidence interval was 0.526,0?C2.443,0, including 1.
Because the 95% confidence interval of the slope contained ??1 and the 95%
confidence interval of intercept included 0, the LAI-NOS data at Luancheng Station
was deemed valid, with a significant correlation with the actual LAI-2200C
data.
Table 3 PB
regression analysis of LAI-NOS and LAI-2200C data at Luancheng Station, Hebei
province
|
Parameter
|
Intercept a
|
95% CI
|
Slope b
|
95% CI
|
|
Result
|
2.412
|
−0.653?C3.697
|
1.082
|
0.526?C2.443
|
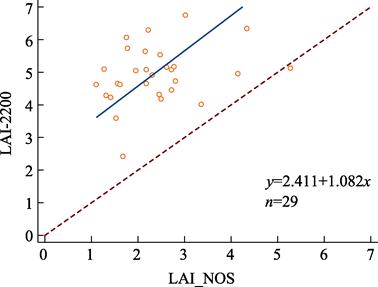
Figure 6 Sample distribution and
regression equation of LAI-NOS and LAI-2200C data at Luancheng Station, Hebei
province
5 Discussion and Conclusion
This paper
illustrated the wheat LAI dataset of Luancheng
Station, Hebei, China (2019) ?? China LAI
Observation Cal-Val Network??s serial dataset. In this dataset, more than
10,000 pieces of effective raw data of the LAI-NOS were obtained at a frequency of 5 min from March 25 to June 10,
2019. The steady window algorithm was used to screen and preprocess the raw
data and filter out the outliers. A portion of effective ground measurement
data was obtained every day and represented the relative true value of LAI
remote sensing products, thus providing data support for the validation of LAI
remote sensing products. This dataset has evident advantages for validating
long-time series of LAI remote sensing products, especially in application
scenarios including different phenological growth periods and different scales.
The research of this dataset only focused on the images near the research site,
in a limited geographical scope. How to validate LAI remote sensing products
for long time series on a national and even global scale remains an important
issue. In the future, a validation test can be extended to the measured sample
areas of different vegetation types all over the country to evaluate the
uncertainty of LAI remote sensing products in these areas. A longer time series
for data verification will be constructed to further evaluate the changes in
LAI remote sensing products.
Author Contributions
Gu,
X. F. , Zhou, X. ,Yang, J. , Yu, T. designed the algorithms of the dataset. Chen, Y. P. contributed to the
data processing and analysis. Sun, Y. completed data validation and wrote the
paper.
Conflicts of Interest
The authors declare no conflicts of interest.
References
[1]
Chen, J. M., Black, T. A. Defining
leaf area index for non-flat leaves [J]. Plant,
Cell & Environment, 1992, 15(4): 421?C429. DOI: 10.1111/j.1365-3040.1992.tb00992.x.
[2]
Fassnacht, K. S., Gower, S. T.,
Norman, J. M., et al. A comparison of
optical and direct methods for estimating foliage surface area index in forests
[J]. Agricultural & Forest Meteorology, 1994, 71(1/2):
183?C207. DOI: 10.1016/0168-1923(94)90107-4.
[3]
Fang, H. L. Development and
validation of satellite Leaf Area Index (LAI) products in China [J]. Remote Sensing Technology and Application,
2020, 35(5): 990?C1003.
[4]
Sun, C., Liu, L., Guan, L., et al. Validation and error analysis of
the modis lai product in Xilinhot grassland [J]. Journal of Remote Sensing, 2014, 18(3): 518?C536. DOI:
10.11834/jrs.20143097.
[5]
Chen, X. D. The collect
decidous leaves method for measurement leaf area index [J]. Journal of Southwest China Normal University
(Natural Science), 1990, 15(2): 3.
DOI: CNKI: SUN: XNZK.0.1990-02-021.
[6]
Wen, Y., Fan, W., Chang, Y., et al. Design and experiment of
automatic measuring system for forest canopy structure parameters [J]. Transactions of the Chinese Society for
Agricultural Machinery, 2015, 46(11): 7. DOI: 10.
6041/j.issn.1000-1298.2015.11.041.
[7]
Chen, Y. P., Jiao, S. F.,
Cheng, Y. L., et al. LAI-NOS: An
automatic network observation system for leaf area index based on hemispherical
photography [J]. Agricultural & Forest Meteorology, 2022, 322: 108999. DOI:
10.1016/j.agrformet.2022.108999.
[8]
Sun, Y., Yang, J., Gao, H. L., et al. Wheat leaf area index dataset of
Luancheng Station Hebei China (2019) ??China Leaf Area Index Observation Cal-Val Network??s serial dataset [J/DB/OL].
Digital Journal of Global Change Data
Repository, 2023. https://doi.org/10.3974/geodb.2023.09.08.V1. https://cstr.escience.org.cn/CSTR:20146.11.2023.09.08.V1.
[9]
GCdataPR Editorial Office.
GCdataPR data sharing policy [OL]. https://doi.org/10.3974/dp.policy.2014.05
(Updated 2017).
[10]
Chen, Y. P., Sun, Y., Yang J., et al. Design of full-automatic LAI
network monitoring system [J]. Research
and exploration in laboratory, 2019, 38(11): 5. DOI: CNKI: SUN: SYSY. 0.2019-11-015.
[11]
Zhang, X., Lv, L. J. Aspheric
optimization design of fisheye lens optical system [J]. Journal of Applied Optics, 2019, 40(5): 863?C870. DOI:
10.5768/JAO201940.0505001.
[12]
Baret, F., Solan, B. D.,
Lopez-Lozano, R., et al. GAI
estimates of row crops from downward looking digital photos taken perpendicular
to rows at 57. 5?? zenith angle: Theoretical considerations based on 3D architecture
models and application to wheat crops [J].
Agricultural & Forest Meteorology,
2010, 150(11): 1393?C1401. DOI: 10.1016/j. agrformet.2010.04.011.
[13]
Chen, J. M. Black, T. A.
Measuring leaf area index of plant canopies with branch architecture [J]. Agricultural & Forest Meteorology, 1991, 57(1/3): 1?C12. DOI:
10.1016/0168-1923(91)90074-Z.
[14]
Liu, P. X. Research on
extraction of vegetation parameters based on hemispherography [D]. Chengdu: University
of Electronic Science and Technology of China, 2019.
[15]
Yan, G. J., Hu R. H., Luo J.
H., et al.. Review of indirect
methods for leaf area index measurement [J]. Journal of Remote Sensing, 2016, 20(5): 958?C978.