The Dataset Curation of Vegetation Net Primary
Productivity and Climate Impacts in China in the Following Century
Chen, X.1,2 Wang, J. B.1,2* He, Q. F.3 Wang, C. Y.4 Ye, H.4 Watson, A. E.1
1. National Ecosystem Science Data Center,
Key Laboratory of Ecosystem Network Observation and Modeling, Institute of
Geographic Sciences and Natural Resources Research, Chinese Academy of Sciences, Beijing 100101, China;
2. University of Chinese Academy of
Sciences, Beijing 100049, China;
3. College of Tourism and Geography,
Jiujiang University, Jiujiang 332005, China;
4. Qilu Normal University, Jinan 205200,
China;
Abstract: Ecosystem
model simulation is one of the most important methods for studying the impacts
of climate change on ecosystem. Presently, most ecosystem models predict an
increasing net primary productivity (NPP) in most regions of the globe,
however, interannual changes in NPP and its stability at long time scales of
nearly 100 years have rarely been studied under future climate scenarios. The
interannual NPP with a spatial resolution of 0.1?? was simulated for the
terrestrial ecosystem of China for the period from 2006 to 2019, through an
ecosystem process model carbon exchange between vegetation, soil and
atmosphere-remote sensing (CEVSA-RS) using RCP4.5 and RCP8.5 climate scenarios
data from the Regional Climate Model Version 4 (RegCM4.6) and Coupled Model
Intercomparison Project Phase 5 (CMIP5). Then the dataset described here was
produced and includes the interannual trends, multi-year averages, and
stability data for the period from 2006 to 2099, but also in time periods: the
early period (2006-2035),
the middle period (2036-2065),
and the far period (2066-2099),
each under
the RCP4.5 and RCP8.5 climate scenarios. This dataset has scientific and practical
application potential for climate change mitigation and research and adaptation
actions.
Keywords: NPP;
CEVSA-RS model; future climate scenarios; stability
DOI: https://doi.org/10.3974/geodp.2023.02.05
CSTR: https://cstr.escience.org.cn/CSTR:20146.14.2023.02.05
Dataset Availability Statement:
The
dataset supporting this paper was published and is accessible through the Digital
Journal of Global Change Data Repository at: https://doi.org/10.3974/geodb.2023.06.01.V1
or https://cstr.escience.org.cn/CSTR:20146.11.2023.06.01.V1.
1 Introduction
Vegetation
net primary productivity (NPP) characterizes the rate of atmospheric carbon
fixation and biomass accumulation through photosynthesis[1]. It is
the primary basis for studying the response of global terrestrial ecosystem to
climate change[2]. Climate factors driving changes in carbon sinks
are highly heterogeneous in time and space[3], and resulting
fluctuations in productivity can have an impact on carbon fixation[4].
How to cope with the rising temperatures, changing precipitation patterns, and
determine the degree of stabilization of NPP under global change is an
important research topic today.
Ecosystem model simulation is one of the most important methods used to
study the response of terrestrial ecosystem to climate change[5, 6],
which is usually categorized into climate statistical models, remote sensing
parameter models and ecological process models[7, 8]. Ecological process models based on small-scale, fine-tuned
experimental analyses, can more accurately predict future changes from
ecosystem mechanistic simulation. By combining these predictions with remote
sensing parameter models, model-data fusion can be accomplished in order to
produce a more accurate simulation of ecosystem carbon dynamics[9?C12].
Considering effects from hydrology, atmospheric carbon dioxide, land cover and
land use change, species composition and nitrogen deposition on the carbon
cycle of terrestrial ecosystem, those effects can be more accurately simulated,
which can greatly improve the accuracy and precision of models to simulate the
responses of terrestrial ecosystem to climate change, and has been considered
an important research field for future model improvements[13]. The
remote sensing-driven ecosystem process model (CEVSA-RS), has high accuracy in
simulating ecosystem productivity[14, 15]. The model provides the
methodological basis for diagnosing the historic dynamics of carbon cycles and
predicting future responses to climate scenarios for terrestrial ecosystem by
opening or closing remote sensing-driven submodule.
The dataset
described here incorporated a future climate that was simulated based on
different GHG emission scenarios in CMIP5. However, the two scenarios selected,
RCP 4.5 and RCP8.5, are important because the RCP4.5 simulates a balanced
economic development model as the ??better situation?? of climate change if the
measures will be implemented to effectively mitigate climate change, while
RCP8.5 represents the ??worst situation?? climate change without taking any effective
measures.
Therefore, in the
dataset described here, vegetation NPP was simulated through the CEVSA-RS
model. The simulation considered the two climate scenarios of RCP 4.5 and
RCP8.5 for the terrestrial ecosystem in China. The annual NPP were output for
the period from 2006 to 2099. Then the average, trend and stability of the NPP
were calculated for the different periods and shared openly for public access.
The stability of NPP is defined as the inverse of the coefficient of variation.
As we know, there are few open datasets available on the interannual stability
of NPP for Chinese terrestrial ecosystem. Therefore, opening this dataset
should provide an opportunity for the further understanding of carbon cycles,
carbon sink management, ecological restoration and development of responsive of
policies.
2 Metadata of the Dataset
The
metadata of the dataset[16] described here are summarized in Table
1.
Table 1 Metadata summary of the dataset of Stability
of vegetation net primary productivity and climate impacts in China in the
following century
|
Items
|
Description
|
|
Dataset full name
|
Stability of vegetation net primary
productivity and climate impacts in China in the following century
|
|
Dataset short
name
|
RCPsNPPChina
|
|
Authors
|
Chen, X.
0009-0006-4886-3974, Institute of Geographic Sciences and Natural Resources
Research, Chinese Academy of Sciences, chenx.20s@igsnrr.ac.cn
Wang, J. B.
0000-0001-5169-6333, Institute of Geographic Sciences and Natural Resources
Research, Chinese Academy of Sciences, jbwang@igsnrr.ac.cn
He, Q. F.
0009-0009-9554-4812, College of Tourism and Geography, Jiujiang University,
2051936579@qq.com
Wang, C. Y.
0000-0002-9960-5530, Qilu Normal University, 1871302580@qq.com
Ye, H.
0000-0003-0278-5406, College of Tourism and Geography, Jiujiang University,
fever2cn.huiye@outlook.com
|
|
Geographical
region
|
3??51??N?C53??33??N??73??33??E?C135??05??E
|
|
Years
|
2006?C2099
|
|
Spatial
resolution
|
0.1??
|
|
Data format
|
.tif
|
|
|
|
Data size
|
4.26 KB
(compressed)
|
|
|
|
Data files
|
A total of 16
raster data files, including multi-year average, trends, and stability of NPP
in different periods under the RCP4.5 and RCP8.5 scenarios
|
|
Foundations
|
National Natural
Science Foundation of China (31861143015, 31971507); Chinese Academy of
Sciences-Qinghai Provincial People??s Government Sanjiangyuan National Park
Joint Research Program (LHZX-2020-07)
|
|
Data publisher
|
Global Change Research Data Publishing & Repository,
http://www.geodoi.ac.cn
|
|
Address
|
No. 11A, Datun
Road, Chaoyang District, Beijing 100101, China
|
|
Data sharing
policy
|
Data from the Global
Change Research Data Publishing & Repository includes metadata, datasets (in the Digital Journal of Global Change Data Repository), and
publications (in the Journal of Global Change Data & Discovery). Data sharing policy includes: (1) Data are openly
available and can be free downloaded via the Internet; (2) End users are
encouraged to use Data subject to citation; (3) Users, who are by definition
also value-added service providers, are welcome to redistribute Data
subject to written permission from the GCdataPR Editorial Office and the
issuance of a Data redistribution license; and (4) If Data are used to
compile new datasets, the ??ten per cent principal?? should be followed such
that Data records utilized should not surpass 10% of the new
dataset contents, while sources should be clearly noted in suitable places in
the new dataset[17]
|
|
Communication and searchable system
|
DOI, CSTR, Crossref, DCI, CSCD, CNKI,
SciEngine, WDS/ISC, GEOSS
|
3 Methods
3.1 Data Acquisition Methods
The
model input for this data uses the 2006-2099 climate scenario data for terrestrial ecosystem in China[18,
19]. These data are based on the HadGEM2-ES data scenarios in the
Regional Climate Model version 4 (RegCM 4.6) and CMIP5, of which the medium
(RCP4.5) and high (RCP8.5) emission climate scenario data are used. The
original data had a spatial and temporal resolution of 0.25?? and 3 h, including
air temperature, precipitation, cloudiness, and relative air humidity,
respectively, which were processed to a time step of 10 days and a spatial
resolution of 0.1?? for model input.
The vegetation
classification was from Chinese land cover (ChinaCover) remote sensing data in
2010. The ChinaCover data was based on Landsat TM/ETM, HJ-1 satellite data, and
field survey data. Its original data having a spatial resolution of 30 m, and
the accuracy of the first-level classification at the national scale of 94% and
the accuracy of the second-level classification of 86%[20, 21]. Its
secondary classification was merged, and spatially resampled to obtain the
model input data with a spatial resolution of 0.1??. The detailed model inputs
and outputs are shown in Table 2.
In this work, the
national terrestrial ecosystem climate scenario data for 2006-2099 under medium- and high-emission climate scenarios were used to
simulate the NPP data under different future climate scenarios using the 2010
Chinese land cover remote sensing data, based on the satellite-based remote
sensing-driven CEVSA-RS model.
Table 2 List
of input and
output data of the model
|
Data type
|
Indicators
|
Time resolution
|
Spatial resolution
|
Unit
|
|
Input meteorological data
|
Temperature (Tas)
|
10 days
|
0.1??
|
??
|
|
Precipitation (Prc)
|
10 days
|
0.1??
|
mm
|
|
Relative humidity (Hum)
|
10 days
|
0.1??
|
%
|
|
Cloud fraction (Clo)
|
10 days
|
0.1??
|
%
|
|
Input land use data
|
Land cover data (ChinaCover in 2010)
|
Year (2010)
|
0.1??
|
dimensionless
|
|
Output Variables
|
Net primary productivity of vegetation (NPP)
|
Year
|
0.1??
|
g
Cžm?C2ža?C1
|
|
Mean, trend and Stability of NPP
|
Year
|
0.1??
|
dimensionless
|
3.2
Data Processing
The
annual NPP data are subjected to calculating average, trend and stability for
the different periods, and the data processing specifically includes the
following parts:
(1) The trend
analysis is based on linear regression and its slope was calculated with the
following Equation:
 (1)
(1)
where,
Slope is the slope of the linear
regression equation at the pixel scale, Xi
is the NPP in the i-th year; n is the length of the period.
(2) Stability of a
system was defined as remaining unchanged or changes regularly, and the
coefficient of variation itself expresses volatility [20], so the
absolute value of the inverse of the coefficient of variation is usually used
to quantify the stability, and the calculation Equation is as follows:
 (2)
(2)
where, SX, MX and STDX
denote the stability, mean and standard deviation of the NPP for a given time
series. The i stands for the i-th period, and j stands for the j-th
pixel.
4 Data Results and Validation
4.1 Data Composition
This
dataset consists of a total of 16 raster data files, including the average,
trend, and stability raster data of NPP in four periods under the RCP4.5 and
RCP8.5 scenarios [22, 23]. The four periods are defined as the whole
period from 2006 to 2099, the near-term from 2006 to 2035, the mid-term from
2036 to 2065, and the far-term from 2066 to 2099. In the file name, the periods
were formatted as 200620999, 20062035, 20362065, and 20662099 respectively.
(1) RCP45
represents the RCP4.5 climate scenario and RCP85 represents the RCP8.5 climate
scenario;
(2) npp_mean
represents the NPP mean in the specific period;
(3)
npptrend20062099 represents the NPP trend at the pixel scale from 2006 to 2099;
(4) P20062099
represents the significance level of the NPP trend at the pixel scale from 2006
to 2099;
(5) R220062099
represents the coefficient of determination of the NPP trend at the pixel scale
from 2006 to 2099;
(6) stable20062035
represents the multi-year stability for the near-term, where 20062035
represents the near-term from 2006 to 2035.
Notes on units:
(1) NPP: g Cžm?C2ža?C1;
(2) NPP stability:
dimensionless;
(3) NPP trend: g Cžm?C2ža?C1;
(4) Significance
level, coefficient of determination: dimensionless.
4.2 Data Products
The dataset also presents
the spatial pattern of NPP and its trends and its stability under the two
future climate scenarios. The NPP of China??s terrestrial ecosystem from 2006-2099 generally had a spatial pattern of ??high?? in the east, ??low?? in
the west, ??high?? in the south and ??low?? in the north (Figure 1). Among them,
under the RCP4.5 scenario, the total NPP reached 4.41 Pg Cža?C1 for the whole terrestrial ecosystem of China, and it was slightly
higher under the RCP4.5 scenario compared with that under the RCP8.5 scenario.
NPP showed a spatial variation but was more similar within the same climate
zones, such as the total NPP of 0.57 Pg Cža?C1 in the Tibetan Plateau zone, which was the region with the lowest
total
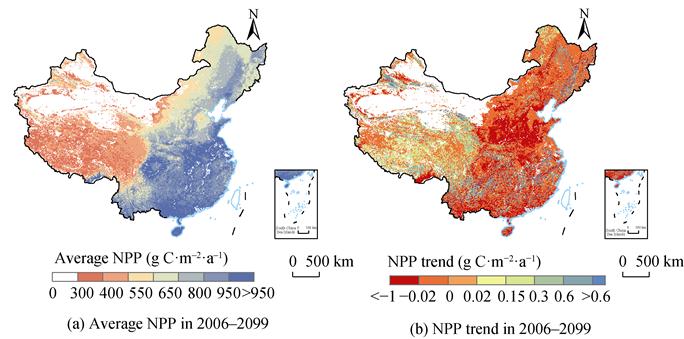
Figure 1 Map of the the average NPP and its
trend under the RCP4.5 scenario in 2006 to 2099 over the terrestrial ecosystem
in China
NPP
among the four major climate zones in China. The tropical-subtropical monsoon
zone had the highest total NPP among the four zones with 2.09 Pg Cža?C1.
The NPP showed a decreasing trend over most
climate zones except for the Tibetan Plateau (Figure 1). The inter-annual
changes are shown in figure 2, which illustrates that the total NPP shows a
significant decreasing trend in both the RCP4.5 scenario and the RCP8.5
scenario for the future 94-years, from 2006 to 2099 (Figure 2). The decreasing
rate for the medium-emission scenario will be greater than that in the
high-emission scenario. Moreover, it is worth noting that the change in total
NPP will turn around in the 2060s, from an increasing to a decreasing trend.
Figure 3 shows the
spatial distribution pattern of NPP stability in the different periods. NPP
stability for the Tibetan Plateau region shows higher values in 2006-2099, while the temperate monsoon region and the temperate
continental climate region show lower values. NPP stability in 2006-2035 (near-term) shows higher values in south China and lower values
in north China. NPP stability in the period 2036-2065 (medium-term) also shows higher values in the south and lower
values in north China. But the stability is relatively higher in the
medium-term compared to that in the near term in south China. In the period
2066-2099 (far-term), NPP stability is
relatively lower with a large number of regions having very low NPP stability.
4.3 Data Validation
The model was extensively
validated and evaluated based on ChinaFLUX observations in previous studies.
The modelled GPP can explain 58%-94% of
the seasonal variations in GPP observations from the eddy covariance towers on
grassland, in forest and on cropland[14]. Meanwhile, it showed good
consistence with the remote sensing-based GPP product (MYD17A2H) of MODIS[14].
The validations and evaluation indicate that the CEVSA-RS model has high
reliability in the GPP estimation[16].
Figure 2 Map of the inter-annual changes for the
total NPP of the terrestrial ecosystem in China from 2006-2099
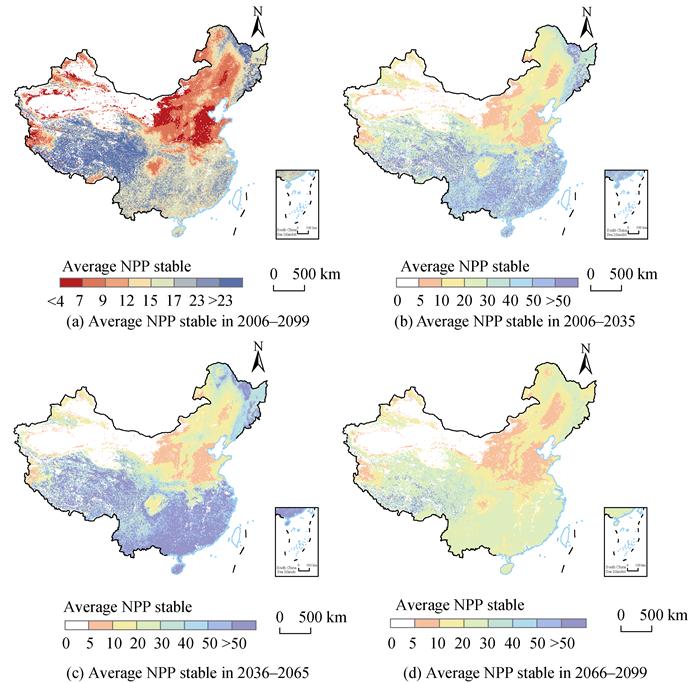
Figure 3 Map of the NPP stability in Chinese
terrestrial ecosystem at different time periods under the RCP4.5 scenario
5 Conclusion
This
dataset includes not only the CEVSA-RS model based NPP under the two future
climate scenarios, but also its mean, trend and stability in the near, medium,
and long term. It can be used to assess the total NPP for different
sub-regions, and also to assess the degree of stability of NPP in response to climate
change. The CEVSA-RS model has been evaluated on its performance to quantify
carbon flux in different ecosystem, which demonstrated the reliability of the
data in this study. These data present the spatial-temporal changes in NPP and
its mean, trend and stability under climate change scenarios, which can be
applied in research on ecological conservation and restoration, dual-carbon
actions, and climate change mitigation and adaptation by considering regional
and decadal differences.
Author Contributions
Wang, J. B. did the overall design for the
development of the dataset; Chen, X. collected and processed the NPP stability
data; Ye, H. and He, Q. F. collected and processed the NPP data; Wang, J. B.
designed the models and algorithms; Wang, C. Y. did the data validation; and
Chen, X. and Watson A. E. wrote the data paper.
Conflicts of Interest
The
authors declare no conflicts of interest.
References
[1]
Behrenfeld, M. J., O??Malley, R.
T., Siegel, D. A., et al.
Climate-driven trends in contemporary ocean productivity [J]. Nature, 2006. 444(7120): 752?C755.
[2]
Zhao, M. S., Running, S. W.
Drought-induced reduction in global terrestrial net primary production from
2000 through 2009 [J]. Science, 2010,
329(5994): 940?C943.
[3]
Ostberg, S., Schaphoff, S.,
Lucht, W., et al. Three centuries of
dual pressure from land use and climate change on the biosphere [J]. Environmental Research Letters, 2015,
10(4): 044011.
[4]
Zhang, L., Ren, X. L., Wang, J. B., et
al. Interannual variability of terrestrial net ecosystem productivity over
China: Regional contributions and climate attribution [J]. Environmental Research Letters, 2019, 14(1): 014003.
[5]
Fu, B. J. Geography: from
knowledge, science to decision making support [J]. Acta Geographica Sinica, 2017, 72(11):1923?C1932.
[6]
Peng, S. S., Piao, S. L., Yu,
J. S., et al. A review of
geographical system models [J]. Progress
in Geography, 2018, 37(1): 109?C120.
[7]
Xu, Y. Q., Xiao, F. J., Yu, L.
Review of spatio-temporal distribution of net primary productity in forest ecosystem and its responses to climate change in
China [J]. Acta Ecologica Sinica,
2020, 40(14): 4710?C4723.
[8]
Sun, Q. L., Li, B. L., Li, F., et al. Review on the estimation of net
primary productivity of vegetation in the Three River Headwater Region, China [J].
Acta Geographica Sinica, 2016, 71(9):
1596?C1612.
[9]
Law, B. E., Turner, D.,
Campbell, J., et al. Disturbance and
climate effects on carbon stocks and fluxes across Western Oregon USA [J]. Global Change Biology, 2004, 10(9):
1429?C1444.
[10]
Wang, J. B., Liu, J. Y., Shao,
Q. Q., et al. Spatial-temporal
patterns of net primary productivity for 1988-2004 based on GLOPEM-CEVSA model in the ??Three-river Headwaters??
region of Qinghai province, China [J]. Journal
of Plant Ecology, 2009, 33(2): 254?C269.
[11]
Zhao, Y. M., Niu, S. K., Wang,
J. B., et al. Light use efficiency of
vegetation: a review [J]. Chinese Journal
of Ecology, 2007, 26(9): 1471?C1477.
[12]
Dai, W. J., Jin, H. Y., Zhang,
Y. H., et al. Advances in plant
phenology [J]. Acta Ecologica Sinica,
2020, 40(19): 6705?C6719.
[13]
Chapin, F. S., McFarland, J.,
McGuire, A. D., et al. The changing
global carbon cycle: linking plant-soil carbon dynamics to global consequences [J].
Journal of Ecology, 2009, 97(5):
840?C850.
[14]
Wang, J. B., Yang, Y. H., Zuo,
C., et al. Impacts of human
activities and climate change on gross primary productivity of the terrestrial
ecosystems in China [J]. Acta Ecologica
Sinica, 2021, 41(18): 7085?C7099.
[15]
Yang, Y. H. Impacts of human
activities and climate change on gross primary productivity of the terrestrial
ecosystems in China since 2000 [D]. Beijing: University of Chinese Academy of
Sciences, 2019.
[16] Chen, X., Wang, J. B., He, Q. F., et al. A dataset for estimating the stability of net primary
productivity of vegetation in China under future 100-year climate scenarios [J/DB/OL].
Digital Journal of Global Change Data
Repository, 2023. https://doi.org/10.3974/geodb.2023.06.01.V1. https://cstr.escience.org.cn/CSTR:
20146.11.2023.06.01.V1.
[17]
GCdataPR
Editorial Office. GCdataPR data sharing policy[OL].
https://doi.org/10.3974/dp.policy.2014.05 (Updated 2017).
[18]
Pan, X. D., Zhang, L. Future
climate projection over Northwest China based on RegCM4.6 (2007-2099) [DB]. National Tibetan Plateau/Third Pole Environment Data
Center, 2019. https://doi.org/10.11888/ Meteoro.tpdc.270120. https://cstr.cn/18406.11.Meteoro.tpdc.270120.
[19]
Pan, X. D., Zhang, L., Huang,
C. L. Future climate projection in Northwest China with RegCM4.6 [J]. Earth and Space Science, 2020, 7(2): e2019EA000819.
[20]
Wu, B. F., Yuan, Q. Z., Yan, C.
Z., et al. Land cover change in China
in the first decade of the 21st century [J]. Quaternary Sciences, 2014, 34(4): 723?C731.
[21]
Zhang, L., Wu, B. F., Li, X. S.,
et al. Classification system of China
land cover for carbon budget [J]. Acta
Ecologica Sinica, 2014, 34(24): 7158?C7166.
[22]
Liu, L., Guan, J. Y., Mu, C., et al. Spatio-temporal characteristics
of vegetation net primary productivity in the Ili River Basin from 2008 to 2018
[J]. Acta Ecologica Sinica, 2022,
42(12): 4861?C4871.
[23]
Chen, X., Wang, J. B., He, Q. F., et al. Stability of vegetation net primary
productivity and climate impacts in China under future climate scenarios [J]. Acta Geographica Sinica, 2023, 78(3):
694?C713.