A Dataset of Provincial Carbon Emissions Reduction
Performance in the Process of Carbon Emissions Intensity Reduction in China’s
Energy Consumption from 2005 to 2016
Cui, P.
P.1 Zhang,
L. J.1 Qin, Y. C.1,2*
1.
College of Geography and Environmental Science / Key Laboratory of Geospatial
Technology for the Middle and Lower Yellow River Regions ,Henan University,
Kaifeng 475004, China;
2.
Key Research Institute of Yellow River Civilization and Sustainable Development
& Collaborative Innovation Center on Yellow River Civilization jointly
built by Henan Province and Ministry of Education, Henan University, Kaifeng
475004, China
Abstract: Based on the energy consumption and economic development
data of 30 Chinese provinces (excluding Tibet, Hong Kong, Macao, and Taiwan), a
dataset of China’s carbon emissions intensity and provincial output share and
carbon emissions intensity in China was built. The correction coefficient was
applied to measure carbon emissions reduction effectiveness in each Chinese province.
According to the carbon emissions intensity of energy consumption and the output
value share of each province, the equation of national carbon emissions
intensity in China’s energy consumption was established from top to bottom, and
the contribution rate of the carbon emissions intensity of energy consumption
and the output value share in each province to the decline of national carbon
emissions intensity in energy consumption was determined using the LMDI-Ⅰ
method. Following the idea of “emissions reduction effectiveness-carbon
emissions intensity contribution-comprehensive contribution by
province-relationship between provincial carbon emissions reduction
effectiveness and the comprehensive contribution of each province”, the
performance of carbon emissions reduction of each province in the process of
carbon emissions intensity reduction in China’s energy consumption was
evaluated. The results of the dataset analysis showed that: (1) The carbon
emissions intensity of China’ energy consumption followed a downward trend,
decreasing by more than 45% in 2016 from 2005 levels. (2) More than half of the
provinces of China were evaluated as effectiveness areas for carbon emissions
reduction, and this number increased during the study period; most of the
provinces that did not meet the carbon emissions reduction standards were
located in economically underdeveloped areas, and there were significant
differences in carbon emissions reduction paths across provinces. (3) The
contribution rate of the carbon emissions intensity of energy consumption in
most provinces followed an upward trend, and the regional differences gradually
decreased. (4) The competing momentum of the comprehensive contribution by
provinces was strong, and most provinces contributed to the reduction of the
carbon emissions intensity of China’s energy consumption. (5) The number of
provinces with good carbon emissions reduction performance was the highest; the
general areas were scattered in the eastern coastal area and in a few inland
areas, while the spatial pattern of the poor areas remained durably in the
western region. The dataset built includes the following data: (1) Carbon
emissions intensity of energy consumption in China; (2) Correction coefficients
of the provincial carbon emissions reduction of energy consumption; (3) Decomposition
factors’ contribution rate to the reduction of carbon emissions intensity in
China; (4) Order of effectiveness and comprehensive contribution of provincial carbon
emissions reduction. The dataset consisted in one file in .xlsx format, with a
size of 18.8 KB.
Keywords: province; energy consumption; carbon emissions
intensity; carbon emissions reduction performance
DOI: https://doi.org/10.3974/geodp.2022.04.07
CSTR: https://cstr.escience.org.cn/CSTR:20146.14.
2022.04.07
Dataset Availability
Statement:
The dataset supporting this paper
was published and is accessible through the Digital Journal of Global Change Data Repository
at: https://doi.org/10.3974/geodb.2022.07.03.V1
or https://cstr.escience.org.cn/CSTR:20146.11.2022.07.03.V1.
1
Introduction
The collaborative reduction of regional carbon emissions
is an important means to promote the reduction of national carbon intensity. Current
research mainly focuses on two topics: the regional allocation of
responsibility of carbon emissions reduction[1–3], and the decline
in regional carbon emissions intensity[4–6]. These two strands of
research provide a reference for regional low carbon development; however, as
the time is currently in the first emissions reduction target completion stages
and second emissions reduction target implementation stages, further
investigations should focus on the provincial performance evaluation in the
process of promoting the national carbon emissions reduction.
The
performance of carbon emissions reduction can be evaluated from multiple
perspectives; previous studies investigated aspects such as emissions reduction
efficiency[7–9], emissions reduction status[10],
emissions reduction benefits[11], and emissions reduction potential[12,13].
However, these studies did not address the contribution of emissions reduction
units in China’s process of carbon emissions intensity reduction. Therefore,
the evaluation of the carbon emissions reduction performance of the various
provinces of China in the process of the carbon emissions intensity reduction
of energy consumption can provide scientific support for the future achievement
of provincial carbon emissions reduction and the formulation of carbon emissions
reduction policies.
2 Metadata of
the Dataset
The metadata of the Carbon emission reduction
effectiveness dataset in provinces of China (2005−2016)[14] are shown in Table 1, which include the dataset name,
authors, year, data format, data size, data files, data publisher, and data
sharing policy, etc.
3 Methods of
Data Development
3.1 The Algorithm
Principle
For the purpose to
select the relevant energy types to measure carbon emissions, the
Table 1 Metadata summary of the Carbon emission
reduction effectiveness dataset in provinces of China (2005−2016)
|
Item
|
Description
|
|
Dataset full name
|
Carbon emission
reduction effectiveness dataset in provinces of China (2005−2016)
|
|
Dataset short
name
|
ProvCReducEffectChina_2005-2016
|
|
Authors
|
Cui, P. P.
X-9461-2018, College of Geography and
Environmental Science, Henan University/Key Laboratory of Geospatial
Technology for the Middle and Lower Yellow River Regions (Henan University), cuipan3353@163.com
Zhang, L. J.
X-9839-2018, College of Geography and Environmental Science, Henan University/
Key Laboratory of Geospatial Technology for the Middle and Lower Yellow River
Regions (Henan University), zlj7happy@163.com
Qin, Y. C.
N-4027-2016, College of Geography and Environmental Science, Henan University/
Key Laboratory of Geospatial Technology for the Middle and Lower Yellow River
Regions (Henan University); Key Research Institute of Yellow River
Civilization and Sustainable Development & Collaborative Innovation
Center on Yellow River Civilization jointly built by Henan Province and
Ministry of Education, Henan University, qinyc@henu.edu.cn
|
|
Geographical
region
|
30 provinces in
China (excluding Hong Kong Macao, Taiwan and Tibet)
|
|
Year
|
2005–2016
Data format .xlsx Data
size 18.8 KB
|
|
Data files
|
4 Excel files:
(1) energy consumption carbon emissions intensity in china; (2) correction
coefficients of provincial energy consumption carbon emissions reduction; (3)
decomposition factors’ contribution rate to carbon emissions intensity
decline in China; (4) ranking of provincial emissions reduction effectiveness
and comprehensive contribution
|
|
Foundations
|
National Natural
Science Foundation of China (42171295, 42071294, 42101206); Henan Province
(2019SJGLX043, 222300420030, 222300420132)
|
|
Data publisher
|
Global Change
Research Data Publishing & Repository, http://www.geodoi.ac.cn
|
|
Address
|
No. 11A, Datun
Road, Chaoyang District, Beijing, 100101, China
|
|
Data sharing
policy
|
Data from
the Global Change Research Data Publishing & Repository includes metadata, datasets
(in the Digital Journal of Global Change Data Repository), and
publications (in the Journal of Global Change Data & Discovery). Data sharing policy
includes: (1) Data are openly available and can be free downloaded via the
Internet; (2) End users are encouraged to use Data subject to
citation; (3) Users, who are by definition also value-added service
providers, are welcome to redistribute Data subject to written permission
from the GCdataPR Editorial Office and the issuance of a Data redistribution
license; and (4) If Data are used to compile new
datasets, the ‘ten per cent principal’ should be followed such that Data
records utilized should not surpass 10% of the new dataset contents, while
sources should be clearly noted in suitable places in the new dataset[15]
|
|
Communication and searchable system
|
DOI, CSTR, Crossref, DCI, CSCD, CNKI,
SciEngine, WDS/ISC, GEOSS
|
carbon emissions from energy consumption and the output
value at national level could be obtained by adding the corresponding values of
the 30 Chinese provinces. Moreover, the corresponding carbon emissions
intensity could be deduced by the ratio of carbon
emissions and output value. The
correction coefficient was used to measure whether the magnitude of decline of
carbon emissions intensity in various provinces was higher than the national
value, thereby reflecting the effectiveness of carbon emissions reduction. On
the basis of constructing the carbon emissions intensity formula, the
intensity of the change of carbon emissions from national energy consumption
was decomposed into the provincial energy consumption-related carbon emissions
intensity and the shares of output value were assessed using the LMDI-I method.
Superanalysis and positional relationship analysis were used to measure the
relationship between the effectiveness and the contribution of carbon emissions
reductionto carbon emissions intensity at national level,
and to further determine the types of carbon emissions reduction performance.
3.2 Methods
3.2.1
Carbon Emissions Coefficient Method
Coal, coke,
crude oil, gasoline, kerosene, diesel, fuel oil, and natural gas were selected as
energy types and carbon emissions were calculated
based on the default values and calculation method provided by the “Guidelines
for National Greenhouse Gas Inventory” of the United Nations Intergovernmental
Panel on Climate Change (IPCC)[16]. The calculation formula employed
is as follows:
 (1)
(1)
where Ci indicates the carbon emissions of province i,
with i=1,2,……30, in ten thousand t CO2; Eij
indicates the energy consumption for each energy type j in province i,
with j=1,2,……8, in ten thousand t; and βj indicates
the carbon emissions coefficient for energy type j. The carbon emissions
intensity of energy consumption at national and provincial level in China was
expressed by the ratio of the corresponding total carbon emissions and GDP, in
t CO2/ten thousand Yuan; the GDP was converted to comparable GDP for
2005 using the GDP index.
3.2.2 The
Correction Coefficient Method
Referring to
related literature[17,18], and assuming that China’s target of
reduction of the carbon emissions intensity of energy consumption is consistent
with China’s 2020 carbon emissions intensity target, we quantitatively evaluated
the effectiveness of the reduction
of the carbon emissions intensity of energy consumption by constructing the
correction coefficient index, which can measure whether the reduction of the carbon
emissions intensity of provincial energy consumption is higher than the
national average level.
3.2.3 The LMDI-I Method
The formula of carbon emissions
intensity in China’s energy consumption including provincial carbon emissions
intensity and output value was constructed, and the decomposition model was
selected following Ang[19]. The LMDI-I method was employed following
the specific steps proposed by Cui, et al.
(2020)[18].
4 Data Results
4.1 Dataset Composition
|
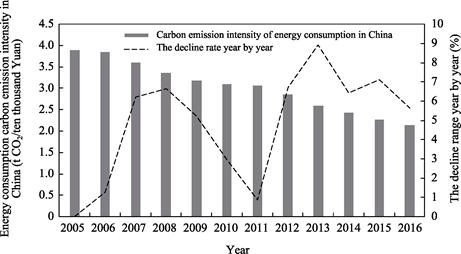
Figure 1 Evolution of the carbon
emissions intensity of energy consumption in China from 2005 to 2016
|
The
dataset was archived in .xlsx format with a size of 18.8 KB. It included data
on the carbon emissions intensity of energy consumption in China, the provincial
correction coefficient of carbon emissions reduction, the decomposition effect
of Chinese carbon emissions intensity change in energy consumption (including the
contribution rate of provincial carbon emissions
intensity, the output value share and their sum), and the ranking
of provincial effectiveness and comprehensive
contribution of emissions reduction in China.
4.2 Data Results
The data
results of this study are as follows:
(1) The data
of carbon emissions intensity of energy consumption in China from 2005 to 2016
and its decline rate year by year are illustrated in Figure 1.
(2) The correction coefficients of carbon emissions reduction from 2005
to 2016 are presented in Table 2 as divided into two periods, i.e., from 2005
to 2010 and from 2010 to 2016.
(3) The
contribution rates of provincial carbon emissions intensity, output value share
and their sum to the change of carbon emissions intensity of energy consumption
in China from 2005 to 2016 are displayed in Table 3.
(4) The
order of effectiveness and the comprehensive contribution of carbon emissions
reduction in Chinese provinces from 2005 to 2010 and from 2010 to 2016 are
displayed in Figure 2. A positive relationship was observed between the
effectiveness and the comprehensive contribution of carbon emissions reduction,
that is, the higher the level of the effectiveness and the comprehensive
contribution of carbon emissions reduction, the higher the order value of two
variables.
Table 2 Correction coefficients of
provincial carbon emissions reduction from energy consumption in China
|
Province
|
2005–2010
|
2010–2016
|
Province
|
2005–2010
|
2010–2016
|
Province
|
2005–2010
|
2010–2016
|
|
Beijing
|
1.61
|
1.53
|
Zhejiang
|
0.88
|
1.15
|
Hainan
|
–3.75
|
0.68
|
|
Tianjin
|
1.45
|
1.54
|
Anhui
|
0.71
|
1.01
|
Chongqing
|
1.31
|
1.58
|
|
Hebei
|
0.93
|
1.05
|
Fujian
|
0.49
|
1.20
|
Sichuan
|
1.02
|
1.42
|
|
Shanxi
|
1.49
|
0.78
|
Jiangxi
|
0.99
|
0.93
|
Guizhou
|
1.10
|
1.16
|
|
Neimenggu
|
0.67
|
0.79
|
Shandong
|
0.86
|
0.72
|
Yunnan
|
1.09
|
1.76
|
|
Liaoning
|
1.38
|
0.88
|
Henan
|
1.07
|
1.31
|
Shaanxi
|
0.21
|
0.65
|
|
Jilin
|
1.37
|
1.33
|
Hubei
|
1.07
|
1.47
|
Gansu
|
1.06
|
1.12
|
|
Heilongjiang
|
1.07
|
1.01
|
Hunan
|
1.43
|
1.25
|
Qinghai
|
0.84
|
0.45
|
|
Shanghai
|
1.51
|
1.13
|
Guangdong
|
0.76
|
1.05
|
Ningxia
|
0.13
|
0.26
|
|
Jiangsu
|
1.25
|
0.79
|
Guangxi
|
0.46
|
0.75
|
Xinjiang
|
–0.45
|
–0.14
|
Table 3 Decomposition factors of the contribution
rate of the carbon emissions intensity of energy consumption in China from 2005–2016 (%)
|
Province
|
2005–2010
|
2010–2016
|
|
Provincial carbon emissions intensity contribution
|
Provincial output value share contribution
|
Provincial comprehensive contribution
|
Provincial carbon emissions intensity contribution
|
Provincial output value share contribution
|
Provincial comprehensive contribution
|
|
Shanxi
|
11.05
|
2.42
|
13.47
|
4.63
|
1.62
|
6.25
|
|
Liaoning
|
9.24
|
–1.16
|
8.08
|
5.01
|
2.73
|
7.74
|
|
Jiangsu
|
8.22
|
–0.59
|
7.63
|
4.90
|
–0.17
|
4.73
|
|
Shanghai
|
4.48
|
0.99
|
5.47
|
2.68
|
0.60
|
3.28
|
|
Shandong
|
8.29
|
–0.09
|
8.21
|
7.23
|
0.05
|
7.28
|
|
Hunan
|
4.25
|
–0.52
|
3.73
|
3.45
|
–0.35
|
3.10
|
|
Beijing
|
2.51
|
0.45
|
2.96
|
1.85
|
0.27
|
2.12
|
|
Heilongjiang
|
3.50
|
0.65
|
4.15
|
3.09
|
0.54
|
3.63
|
|
Jilin
|
3.35
|
–0.83
|
2.51
|
3.07
|
0.06
|
3.13
|
|
Qinghai
|
0.31
|
–0.01
|
0.30
|
0.18
|
–0.08
|
0.10
|
|
Jiangxi
|
1.57
|
–0.04
|
1.53
|
1.53
|
–0.27
|
1.26
|
|
Gansu
|
1.77
|
0.59
|
2.36
|
1.82
|
–0.22
|
1.60
|
|
Ningxia
|
0.13
|
0.07
|
0.20
|
0.32
|
–0.10
|
0.22
|
|
Tianjin
|
2.59
|
–0.99
|
1.60
|
2.79
|
–0.64
|
2.15
|
|
Guizhou
|
2.44
|
0.18
|
2.62
|
2.70
|
–1.00
|
1.69
|
|
Xinjiang
|
–0.88
|
1.09
|
0.21
|
–0.37
|
–0.52
|
–0.89
|
|
Chongqing
|
1.97
|
–0.53
|
1.44
|
2.48
|
–0.67
|
1.81
|
(To be continued on the next page)
(Continued)
|
Province
|
2005–2010
|
2010–2016
|
|
Provincial
carbon emissions intensity contribution
|
Provincial
output value share contribution
|
Provincial
comprehensive contribution
|
Provincial
carbon emissions intensity contribution
|
Provincial
output value share contribution
|
Provincial
comprehensive contribution
|
|
Guangxi
|
0.63
|
–0.25
|
0.38
|
1.21
|
–0.12
|
1.09
|
|
Hebei
|
7.08
|
1.99
|
9.07
|
7.71
|
1.00
|
8.71
|
|
Zhejiang
|
3.46
|
0.89
|
4.35
|
4.42
|
0.59
|
5.01
|
|
Anhui
|
1.91
|
–0.19
|
1.73
|
3.02
|
–0.58
|
2.44
|
|
Hainan
|
–0.82
|
–0.02
|
–0.84
|
0.33
|
0.00
|
0.33
|
|
Henan
|
6.12
|
0.15
|
6.27
|
7.39
|
–0.21
|
7.18
|
|
Neimenggu
|
3.14
|
–4.18
|
–1.04
|
4.44
|
–0.38
|
4.06
|
|
Sichuan
|
3.22
|
–0.41
|
2.80
|
4.66
|
–0.50
|
4.15
|
|
Hubei
|
3.58
|
–0.55
|
3.03
|
5.03
|
–0.53
|
4.50
|
|
Yunnan
|
2.55
|
0.57
|
3.12
|
4.04
|
–0.44
|
3.60
|
|
Guangdong
|
3.89
|
0.62
|
4.51
|
5.47
|
0.61
|
6.09
|
|
Shaanxi
|
0.54
|
–0.96
|
–0.43
|
2.13
|
–0.70
|
1.44
|
|
Fujian
|
0.88
|
–0.30
|
0.58
|
2.59
|
–0.37
|
2.22
|
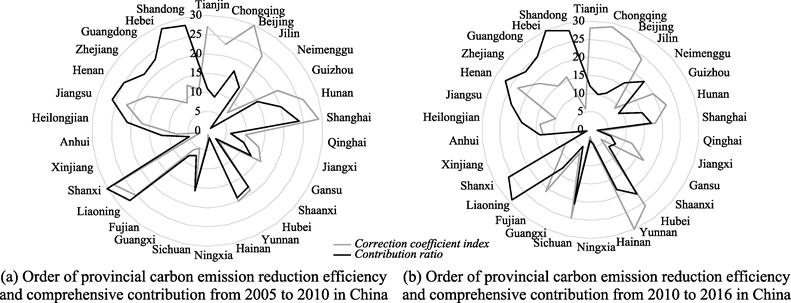
Figure 2 Order of provincial carbon emissions
reduction effectiveness and comprehensive contribution from 2005 to 2016 in
China.
5
Discussion and Conclusion
Based on
relevant data and methods, this study evaluated the performance of carbon emissions
reduction in the context of China’s decline of carbon emissions intensity from energy
consumption, focusing on its effectiveness and contributors. This study could better
reflect provincial carbon emissions reduction efforts and contribution in the
process of reduction of the carbon emissions intensity of energy consumption at
national level. Differences and interlinkages were found between carbon emissions
reduction effectiveness and contributions. Although these two were misplaced in
order, they were found to have an overall positive relationship. This illustrates
that the provincial comprehensive contributions has some laziness in exerting
the effectiveness of carbon emissions reduction. In the future, the theoretical
and empirical analysis of the relationship between these two should be further
analyzed, so as to lay a foundation to determine the performance type of provincial
carbon emissions reduction.
Author
Contributions
Cui, P. P. carried out the overall
design for the development of the dataset; Cui, P. P. and Zhang, L. J.
collected and processed the data of energy consumption and economic output
value; Zhang, L. J. and Qin, Y. C. designed the models and algorithms; Cui, P.
P. conducted data validation, and wrote the data paper.
Conflicts
of Interest
The
authors declare no conflicts of interest.
References
[1]
Wang, W. J., Chen, Z. L.
Research on the allocation scheme of initial carbon quota in provincial regions
of China: based on the perspective of responsibility and goal, fairness and
efficiency [J]. Management World, 2019, 35(3): 81–98.
[2]
Zhou, P., Wang, M. Carbon
dioxide emissions allocation: a review [J]. Ecological Economics, 2016,
125: 47–59.
[3]
Qian, H. Q., Wu, L. B., Ren, F.
Z. From “spurring a willing horse” to efficiency driven: a study of China’s
regional CO2 emission permit allocation [J]. Economic Research
Journal, 2019, (3): 86–102.
[4]
Feng, D., Yu, B. L., Hadachin,
T., et al. Drivers of carbon emission
intensity change in China [J]. Resources, Conservation & Recycling, 2018, 129: 187–201.
[5]
Junna, Y., Bin, S., Yu, L.
Multiplicative structural decomposition and attribution analysis of carbon
emission intensity in China, 2002–2012 [J]. Journal of Cleaner Production,
2018, 198: 195–207.
[6]
Chen, C., Zhao, T., Yuan, R., et al. A spatial-temporal decomposition
analysis of China’s carbon intensity from the economic perspective [J]. Journal
of Cleaner Production, 2019, 215: 557–569.
[7]
Pan, J. H., Zhang, L. F.
Research on the regional variation of carbon productivity in China [J]. China
Industrial Economics, 2011, (5): 47–57.
[8]
Mielnik, O., Goldemberg, J. The
Evolution of the “Carbonization Index” in developing countries [J]. Energy
Policy, 1999, 27 (5): 307–308.
[9]
Ma, D. L., Chen, Z. C., Wang,
L. Spatial econometrics research on inter-provincial carbon emissions
efficiency in China [J]. China Population, Resources and Environment, 2015, 25(1): 67–77.
[10]
Wang, W. W., Li, M., Zhang, M.
Study on the changes of the decoupling indicator between energy-related CO2,
emission and GDP in China [J]. Energy, 2017, 128: 11–18.
[11]
Yang, Z. H., Chen, L. X., Luo
T. Marginal cost of emission reduction and regional differences [J]. Journal
of Management Sciences in China, 2019, 22(2): 1–21
[12]
Wang, K., Yu, F. F., Hu, Y., et al. Spatial correlation network
structure of tourism carbon emission reduction potential and the determinants
in China [J]. Scientia Geographica Sinica, 2022, 42(6): 1034–1043.
[13]
Wang, K., Yu, F. F., Zhou, X.,
B., et al. Spatial-temporal evolution
and influencing factors of carbon emission reduction potential of tourism in
China [J].Geography and Geo-information Science, 2022, 38(3): 112–119.
[14]
Cui, P. P., Zhang, L. J., Qin, Y. C. Carbon emission
reduction effectiveness dataset in provinces of China (2005−2016) [J/DB/OL]. Digital Journal of Global Change Data
Repository, 2022. https://doi.org/10.3974/geodb.2022.07.03.V1.
https://cstr.escience.org.cn/CSTR:20146.11.2022.07.03.V1.
[15]
GCdataPR Editorial Office.
GCdataPR data sharing policy [OL]. DOI: 10.3974/dp.policy.2014.05 (Updated
2017).
[16]
IPCC/OECD. 2006 IPCC guidelines
for national green-house gas inventories [OL]. .https://www.ipcc-nggip. iges.or.jp/public/2006gl/pdf/2_Volume2/V2_2_Ch2_Stationary_Combustion.pdf,
2019-08-02.
[17]
Diakoulaki, D., Mandaraka, M.
Decomposition analysis for assessing the progress in decoupling industrial
growth from CO2 emissions in the EU manufacturing sector [J]. Energy
Economics, 2007, 29(4): 636–664.
[18]
Cui, P. P., Zhao, Y., Hao, L.
S., et al. Evaluation on the
effectiveness of provincial emission reduction in the process of carbon
emission intensity decline in China’s energy industry [J]. Geographical
Research, 2020, 39(8): 1864–1878.
[19]
Ang, B. W. LMDI decomposition
approach: a guide for implementation [J]. Energy Policy, 2015, 86: 233–238.