Accuracy Assessment of GlobeLand30 (2010)
over China with a Landscape Shape Index-based
Sampling Approach
Wang, Y.1* Zhang, J. X.2 Liu, D.2 Yang, W. J.1 Zhang, W. L.1
1. School of Remote Sensing and Information Engineering, Wuhan University, Wuhan 430079, China;
2. School of Geodesy and Geomatics, Wuhan University, Wuhan 430079, China
Abstract: Large-scale land cover data is vital for the study of earth science, particularly in the fields of earth surface processes research, ecosystem assessment, and environmental modeling. The assessment of existing land cover datasets is instructive for dataset use and new dataset production. The GlobeLand30 (2010) dataset over China was evaluated in this study. To obtain more appropriate sample sizes for each class, especially sufficient sample numbers for rare classes, 1,000 validation sample units based on a landscape shape index (LSI) were selected, and the classification accuracy of the GlobeLand30 (2010) dataset was evaluated using Google Earth high-resolution satellite images. The overall accuracy of the GlobeLand30 (2010) dataset over China was 77.90%, which indicated that the consistency between the GlobeLand30 (2010) dataset and the true land cover was high, and thus it could accurately reflect the distribution of different land cover types in China.
Keywords: GlobeLand30 (2010); accuracy assessment; sampling approach
1 Introduction
Large-scale land cover datasets are widely used in earth surface processes research, ecosystem assessments, environmental modeling, and sustainable development planning. GlobeLand30 (2010) was developed by the National Geomatics Center of China during 2009-2014 and is the first global land cover product at 30 m resolution. The product has been available worldwide since September 2014[1]. The database categorizes land use into ten classes (water bodies, wetland, permanent snow and ice, artificial surfaces, cultivated land, bare land, forest, shrub land, grassland, and tundra) in accordance with a hierarchical classification method based on pixel classification, object optimization, and proof of knowledge[2].
To verify the accuracy of this product, a preliminary accuracy assessment was conducted by third-party experts based on a two-rank sampling strategy. During the first-rank sampling, map sheet samples were selected from global map sheets, while the second-rank sampling selected feature samples of each land cover type within each of the selected map sheets[3]. Eighty map sheet samples were selected from a total of 847 map sheets in the first-rank sampling, and these samples were spatially distributed into five continents based on the proportional area of each land class. A total of 159,874 pixel samples were selected for the assessment of GlobeLand30 in the baseline year of 2010, and the overall accuracy of GlobeLand30 (2010) data was 80.33% ± 0.2%[4].
There have only been a few studies of GlobeLand30 (2010) product validation in China. To compare and assess large-scale land cover datasets in China, Yang et al. (2017) resized the GlobeLand30 (2010) product to a scale of 300 m, and manually selected 1,063 sample points from homogenous regions. It was found that GlobeLand30 (2010) was the most accurate of the datasets investigated, with an overall accuracy of 82.39% in China[5]. Lu et al. (2016) compared the accuracy of five global cultivated land datasets for the base-year of 2010. They found that the accuracy of cultivated land of GlobeLand30 (2010) was higher than for the other four products, with an overall accuracy of 79.61%[6]. Obviously, different sampling designs lead to different verification results. The aim of this study was to assess the GlobeLand30 (2010) dataset over China with a landscape shape index (LSI)-based sampling approach, to obtain a creditable accuracy assessment result, especially for the easily misclassified heterogeneous regions.
2 Metadata of Dataset
The validation dataset has both a full name and a short name[7]. It contains details of the corresponding author, authors, geographical regions covered by the content, year that data were acquired, the spatial and temporal resolutions of data, the number of dataset tiles, data format and size, data files, the foundation that owns the data, data publisher, data access and services platform, and data sharing policy. Table 1 summarizes the main metadata elements of the dataset.
3 Methods
Different sampling designs lead to different verification results. To take account of the spatial heterogeneity of the land cover, this study adopted an LSI-based sampling approach and used Google Earth high-resolution historical images to evaluate the accuracy of the GlobeLand30 (2010) dataset over China.
3.1 Sampling Design
Accuracy assessment is a key step in land cover mapping and is implemented by selecting samples for which reference data will be collected and used to estimate the overall and class-specific accuracies in the target region. Many sampling approaches (cluster sampling, stratified random sampling, and systematic sampling) have been developed to determine the sample size and spatial distribution according to several fundamental criteria, such as probability, cost effectiveness, and spatial balance. However, most traditional methods ignore the spatial heterogeneity of land cover in large areas and may not obtain credible spatial samplings, which include sample size and sample distribution.
Table 1 Metadata summary of validation of globeLand30 in China with a LSI-based sampling approach
|
Items
|
Description
|
|
Dataset full name
|
|
|
Dataset short name
|
Samples_LSI_CHN
|
|
Authors
|
Wang, Y. B-5868-2018, Wuhan University, wangyuchn@whu.edu.cn
Zhang, J. X. B-6210-2018, Wuhan University, jxzhang@whu.edu.cn
Liu, D. B-6783-2018, Wuhan University, alliu0815@whu.edu.cn
Yang, W. J. B-6720-2018, Wuhan University, yangwj@whu.edu.cn
Zhang, W. L. B-6084-2018, Wuhan University, zhangwl@whu.edu.cn
|
|
Geographical region
|
3°52′N-53°33′N, 73°40′E-135°2′30″E
|
|
Year
|
2010
|
|
Spatial resolution
|
30 m
|
|
Data format
|
.rar, .kmz
|
Data size 88.4 MB (after compression)
|
|
Dataset and data files
|
The ValPlotChinaGlobeLand30(2010) consists of two files. They are Samples_LSI_CHN.rar and Samples_LSI_CHN.kmz
1. Samples_LSI_CHN.rar; this is the table and vector data. Data size is 90,576.76 KB
2. Samples_LSI_CHN.kmz; this is the sampling points’ geographic information system data Data size is 40.25 KB
|
|
Foundation(s)
|
National Natural Science Foundation of China (41471375)
|
|
Data publisher
|
Global Change Research Data Publishing & Repository, http://www.geodoi.ac.cn/
|
|
Address
|
No.11A, Datun Road, Chaoyang District, Beijing 100101, China
|
|
Data sharing policy
|
Data from the Global Change Research Data Publishing & Repository includes metadata, datasets (data products), and publications (in this case, in the Journal of Global Change Data & Discovery). Data sharing policy includes: (1) Data are openly available and can be free downloaded via the Internet; (2) End users are encouraged to use Data subject to citation; (3) Users, who are by definition also value-added service providers, are welcome to redistribute Data subject to written permission from the GCdataPR Editorial Office and the issuance of a Data redistribution license, and; (4) If Data are used to compile new datasets, the ‘ten percent principal’ should be followed such that Data records utilized should not surpass 10% of the new dataset contents, while sources should be clearly noted in suitable places in the new dataset[8]
|
To solve this problem, Chen et al. (2016) proposed an LSI-based sampling approach[9]. This method needs to calculate LSI to characterize the spatial heterogeneity of land cover at three-levels. At the first level, a regional LSI can be calculated in the target regions and used to estimate the sample size per region. Second, a class-level LSI must be derived for allocating the sample size into classes. Finally, because the samples allocated into each class should be distributed into geographical units according to their spatial heterogeneities, the LSI per class must be calculated in each geographical unit. It has been proven that the accuracy of this method is closer to the true accuracy, with the accuracy assessment of rare classes being significantly improved[9].
Table 2 shows that the distribution of land cover in China is not uniform and the spatial heterogeneity of land cover can be easily observed from the GlobeLand30 map. The areas of cultivated land, forest, grassland, and bare land are similar and together account for 94.07% of the Chinese land area. The area occupied by the remaining categories of land cover is very small, accounting for about 6% of the Chinese land area. If the traditional sampling approaches were to be adopted, the proportion of sampling points in the rare classes would be very low, and the sample sizes of rare classes allocated from the limited total sample size would be relatively small, which would lead to an unreliable accuracy assessment. The LSI-based sampling approach was therefore adopted in this study. The sample sizes and distribution of the validation points are shown in Figure 1 and Table 2.
|
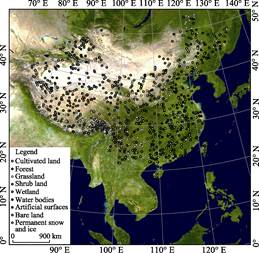
Figure 1 Distribution of samples used in the GlobeLand30 (2010) dataset over China
Table 2 Derived sample sizes of different land cover classes in the GlobeLand30 (2010) dataset over China
|
|
Code
|
Classification
|
Proportion of
land area (%)
|
Sample
size
|
|
10
|
Cultivated land
|
21.34
|
135
|
|
20
|
Forest
|
22.23
|
142
|
|
30
|
Grassland
|
29.60
|
146
|
|
40
|
Scrub land
|
1.05
|
116
|
|
50
|
Wetland
|
0.43
|
62
|
|
60
|
Water bodies
|
1.56
|
96
|
|
80
|
Artificial surfaces
|
1.81
|
100
|
|
90
|
Bare land
|
20.90
|
124
|
|
100
|
Permanent snow
& ice
|
1.08
|
79
|
|
Total
|
|
100
|
1,000
|
As shown in Table 2, an LSI-based sampling approach considers the distribution of rare classes in China (shrub land, wetland, water bodies, artificial surfaces and permanent snow and ice) and obtains sufficient sample numbers for rare classes and optimal sample distributions in geographical space. Thus, a more precise accuracy is achieved for rare classes using the LSI approach. It should be noted that the tundra area in China is very small, and due to its limited distribution it was not included in the validation.
3.2 Sampling Evaluation
The land cover types of the sample point or polygon were evaluated by validation experts. The evaluation of the properties of the validation samples were mainly based on Google Earth high-resolution images. Images of the 2010 growing season were preferred. The basic approach taken in the evaluation was as follows: the collection of multi-source reference data, the collection of interpretation elements (shape, size, pattern, shadow, tone, texture, site, temporal serial, spatial serial, and altitude), and sample integration. The sample assessment unit
|
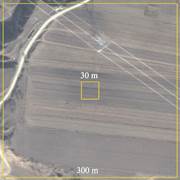
Figure 2 The sample assessment unit
|
(SAU) for a GlobeLand30 validation sample was the region corresponding to a 30×30 m pixel. For implementation, the SAU is a square polygon in Google Earth format (.kmz) and can be displayed over Google Earth images for interpretation. Considering that there is no dominant land cover type in the SAU or the SAU can sometimes be isolated, a polygon of 300 m×300 m was also used to assist the interpretation (Figure 2).
4 Results
Accuracy assessment is one of the key steps in land cover mapping and is implemented by selecting samples for which reference data is collected. From the classification results and “real results”, an error matrix was constructed, and thus accuracy indicators, such as overall accuracy, user’s accuracy, producer’s accuracy, and the Kappa
coefficient, could be calculated[10]. The error matrix, also called a confusion matrix, is a comparison array for representing the number of cells classified as a certain category and the number actually verified as being within that category.
In general, the columns in the array represent reference data; the rows represent the category data classified by a remote sensing approach. There are two forms of error matrix: one uses the number of pixels, while the other uses the percentage. Error matrix results for 1,000 GlobeLand30 (2010) sampling points in China are shown in Table 3.
Table 3 The error matrix of GlobeLand30 (2010) sampling results
|
Code
|
10
|
20
|
30
|
40
|
50
|
60
|
80
|
90
|
100
|
Total
|
|
10
|
106
|
15
|
2
|
4
|
0
|
2
|
6
|
0
|
0
|
135
|
|
20
|
8
|
108
|
14
|
8
|
0
|
0
|
2
|
1
|
1
|
142
|
|
30
|
6
|
13
|
102
|
12
|
2
|
2
|
4
|
5
|
0
|
146
|
|
40
|
2
|
0
|
19
|
88
|
1
|
0
|
0
|
6
|
0
|
116
|
|
50
|
1
|
1
|
1
|
0
|
55
|
3
|
1
|
0
|
0
|
62
|
|
60
|
6
|
1
|
6
|
4
|
4
|
72
|
1
|
1
|
1
|
96
|
|
80
|
14
|
5
|
3
|
6
|
0
|
3
|
67
|
2
|
0
|
100
|
|
90
|
1
|
1
|
7
|
3
|
0
|
1
|
0
|
111
|
0
|
124
|
|
100
|
0
|
1
|
0
|
0
|
0
|
0
|
0
|
8
|
70
|
79
|
|
Total
|
144
|
145
|
154
|
125
|
62
|
83
|
81
|
134
|
72
|
1,000
|
The error matrix is the basis for evaluating the accuracy of a thematic map. It is often used to calculate the following four accuracy indicators.
(1) Overall accuracy: a comprehensive description of the entire land cover product. The overall accuracy can be expressed as the ratio of the sum of the pixels correctly classified to the total sample size.
(2) User’s accuracy: this refers to the ratio of the number of pixels in the actual type of ground surface to the number of pixels in the map classification result. Therefore, it is the row total in the error matrix divided by the number of correctly classified pixels.
(3) Producer’s accuracy: this is the ratio of the number of pixels of a certain category correctclassified pixels in the error matrix.
Table 4 User’s and producer’s accuracy of each class
|
Class
|
Producer’s accuracy (%)
|
User’s accuracy (%)
|
|
Cultivated land
|
73.61
|
78.52
|
|
Forest
|
74.48
|
76.06
|
|
Grassland
|
66.23
|
69.86
|
|
Shrub land
|
70.40
|
75.86
|
|
Wetland
|
88.71
|
88.71
|
|
Water bodies
|
86.75
|
75.00
|
|
Artificial surfaces
|
82.72
|
67.00
|
|
Bare land
|
82.84
|
89.52
|
|
Permanent snow and ice
|
97.22
|
88.61
|
(4) Kappa coefficient: this is a statistic that measures the inter-rater agreement for qualitative (categorical) items. It is generally thought to be a more robust measure than a simple percentage agreement calculation, because it takes into account the possibility of the agreement occurring by chance. The range of the Kappa coefficient is from 0 to 1, and the larger the value, the greater the reliability of the result.
5 Discussion and Conclusion
An error matrix was established after sample design and interpretation, and a statistical analysis was completed. The user’s and producer’s accuracy of each class could be calculated based on the error matrix (Table 4).
For permanent snow and ice, wetland, water bodies, bare land, and artificial surfaces, the producer’s accuracy was above 80%, but it was low for forest, cultivated land, shrub land, and grassland. The user’s accuracy for land cover other than grassland and artificial surfaces was generally higher than 75%.
The overall classification accuracy of GlobeLand30 (2010) over China is 77.90%, the Kappa coefficient is 0.75, while the overall area weighted[11] accuracy was 77.57%.
Author contributions
Zhang, J. X. designed the study. Wang, Y. wrote the paper. Yang, W. J. and Zhang, W. L. contributed to the data processing and analysis. Wang, Y. and Liu, D. undertook data
validation.
Acknowledgements
We thank the National Geomatics Center of China for providing GlobeLand30 (2010) data products. Thanks to Professor Chen, J., Wu, H., and Zheng, X. Y. for guidance on the LSI-based sampling approach.
References
[1] Chen, J., Ban, Y., Li, S. China: open access to earth land-cover map [J]. Nature, 2014, 514(7523): 434. DOI: 10.1038/514434c.
[2] Cao, X., Chen, X., Zhang, W., et al. Research on remote sensing mapping of cultivated land in global 30 m resolution [J]. Science China Earth Sciences, 2016, 46(11): 1426-1435. DOI: 10.1360/N072015-00291.
[3] Tong, X., Wang, Z., Xie, H., et al. Designing a two-rank acceptance sampling plan for quality inspection of geospatial data products [J]. Computers & Geosciences, 2011, 37(10): 1570-1583. DOI: 10.1016/ j.cageo.2011.02.006.
[4] Chen, J., Chen, J., Liao, A., et al. Global land cover mapping at 30 m resolution: A POK-based operational approach [J]. Isprs Journal of Photogrammetry & Remote Sensing, 2015, 103: 7-27. DOI: 10.1016/j.isprsjprs.2014.09.002.
[5] Yang, Y., Xiao, P., Feng, X., et al. Accuracy assessment of seven global land cover datasets over China [J]. Isprs Journal of Photogrammetry & Remote Sensing, 2017, 125: 156-173. DOI: 10.1016/j.isprsjprs. 2017.01.016.
[6] Lu, M., Wu, W., Zhang, L., et al. A comparative analysis of five global cropland datasets in China [J]. Science China Earth Sciences, 2016, 59(12): 2307-2317. DOI: 10.1007/s11430-016-5327-3.
[7] Wang, Y., Zhang, J., Liu, D., et al. Validation plots dataset for accuracy assessment dataset of GlobeLand30 (2010) covering China based on the landscape shape index samples [DB/OL]. Global Change Research Data Publishing & Repository, 2018. DOI: 10.3974/geodb.2018.01.13.V1.
[8] GCdataPR Editorial Office. GCdataPR Data Sharing Policy [OL]. DOI:10.3974/dp.policy.2014.05 (Updated 2017).
[9] Chen, F., Chen, J., Wu, H., et al. A landscape shape index-based sampling approach for land cover accuracy assessment [J]. Science China: Earth Sciences, 2016, 59(12): 2263-2274. DOI: 10.1007/s11430-015-5280-5.
[10] Congalton, R. G. A review of assessing the accuracy of classifications of remotely sensed data [J]. Remote Sensing of Environment, 1991, 37(1): 35-46. DOI: 10.1016/0034-4257(91)90048-B.
[11] Olofsson, P., Foody, G. M., Stehman, S. V., et al. Making better use of accuracy data in land change studies: Estimating accuracy and area and quantifying uncertainty using stratified estimation [J]. Remote Sensing of Environment, 2013, 129(2): 122-131. DOI: 10.1016/j.rse.2012.10.031.