Surface Freeze-Thaw Dataset Development of the
Antarctic Ice Sheet Based on Multisource Data (1999-2019)
Liu, Y.1,2
Zhou, C. X.1,2* Zheng, L.1,2 Wang, Z. M.1,2
1. Chinese Antarctic Center of Surveying and Mapping, Wuhan
University, Wuhan 430079, China;
2. Key Laboratory of Polar Surveying and Mapping, Ministry
of Natural Resources, Wuhan 430079, China
Abstract: Surface melting of the Antarctic Ice
Sheet (AIS) is a factor that is sensitive to global climate changes. It
constitutes a considerable contribution to the surface mass and energy balance
of the AIS. In this study, we ranked the snowmelt determined by the
radiometer, scatterometer, and climate model using categorical triple collocation
(CTC), which can identify the most accurate observations with unknown true
values. Then, a CTC fusion product was generated by adopting the best data
source for each pixel during 1999–2019. By combining the advantages of the
different observations, the fusion product reports the daily freeze-thaw status
of the AIS, with a high spatial resolution of 4.45 km. The data used in this
dataset are stored as integers in which 1 represents melting and –1 represents
freezing. The dataset is archived in the .nc format, and the file size is 35.7
MB after compression.
Keywords: Antarctic Ice Sheet; freeze-thaw;
data fusion; CTC; 1999–2019
Dataset Availability Statement:
The dataset supporting this paper was published and is accessible
through the Digital
Journal of Global Change Data Repository at:
https://doi.org/10.3974/geodb.2020.05.01.V1.
1
Introduction
Surface
melting of the Antarctic Ice Sheet (AIS) is a factor that is sensitive to
global climate changes. It constitutes a substantial contribution to the
surface mass and energy balance of the AIS[1-2]. Due
to to global warming, runoff generated by AIS melting has introduced large
uncertainties into the prediction of changes in climate and sea levels. It is
of great significance to explore the development and driving factors of surface
melting in the AIS. However, early studies developed AIS freeze-thaw products
mostly based on radiometer data, resulting in a low spatial resolution (25 km).
In addition, there are several limitations in using a single sensor to detect
snowmelt under various conditions (latitude, altitude, topography, etc.)[2].
We employed categorical triple collocation (CTC)
to estimate the rankings of snowmelt derived by the radiometer, scatterometer
and climate model[3], and a CTC fusion product over the period of
1999-2019
was generated by combining optimal snowmelt estimations[4]. The
fusion product has a spatial resolution of 4.45 km, which is higher than that
of other compared products. Additionally, the fusion product combines the
advantages of different observations by using multisource data.
2 Metadata of the Dataset
The metadata summary
of the “Antarctic Ice Sheet freeze-thaw dataset (1999-2019)”
is listed in Table 1, including the full name, short name, authors,
geographical region, time, dataset files, data publisher, and data sharing
policy of the dataset, etc.
Table 1 Metadata
summary of the “Antarctic Ice Sheet freeze-thaw dataset (1999-2019)”
|
Items
|
Description
|
|
Dataset full name
|
Antarctic
Ice Sheet freeze-thaw dataset (1999-2019)
|
|
Dataset short name
|
DailyMeltingAntarctic_1999-2019
|
|
Authors
|
Liu,
Y. AAU-2576-2020, Chinese Antarctic Center of Surveying and Mapping, Wuhan
University, yonglwhu@whu.edu.cn
Zhou,
C. X. AAU-2909-2020, Chinese Antarctic Center of Surveying and Mapping, Wuhan
University, zhoucx@whu.edu.cn
Zheng,
L. AAU-3788-2020,
Chinese Antarctic Center of Surveying and Mapping, Wuhan University,
zhenglei0611@hotmail.com
Wang,
Z. M. AAU-3422-2020,
Chinese Antarctic Center of Surveying and Mapping, Wuhan University, zmwang@whu.edu.cn
|
|
Geographical region
|
Antarctic
Ice Sheet
|
|
Year
|
1999‒2019 Temporal resolution 1 day
|
|
Spatial resolution
|
4.45
km Data
format .nc
|
|
Data
size
|
14.13
GB (35.7 MB after compression)
|
|
Data files
|
Melt1999_2009
(5.34 GB); Melt2009_2019 (8.79 GB)
|
|
Foundations
|
National
Natural Science Foundation of China (41776200, 41941010)
|
|
Data publisher
|
Global Change Research Data Publishing & Repository,
http://www.geodoi.ac.cn
|
|
Address
|
No. 11
A Datun Road, Chaoyang District, Beijing 100101, China
|
|
Data sharing policy
|
Data from the Global Change
Research Data Publishing &Repository includes metadata, datasets (in the Digital Journal of Global Change Data Repository), and
publications (in the Journal of Global Change Data & Discovery). Data
sharing policy includes: (1) Data are openly available
and can be free downloaded via the Internet; (2) End users are encouraged to
use Data subject to citation; (3) Users, who are by definition
also value-added service providers, are welcome to redistribute Data subject
to written permission from the GCdataPR Editorial Office and the issuance of
a Data redistribution license; and (4) If Data are
used to compile new datasets, the ‘ten per cent principal’ should be followed
such that Data records utilized should not surpass 10% of the
new dataset contents, while sources should be clearly noted in suitable
places in the new dataset[5]
|
|
Communication and
searchable system
|
DOI,
DCI, CSCD, WDS/ISC, GEOSS, China GEOSS, Crossref
|
3 Methods
We first
estimated the relative performances of snowmelt derived by the radiometer, scatterometer
and climate model in the AIS. Then,
the daily freeze-thaw product over the period of 1999-2019
was generated by combining optimal snowmelt estimations.
3.1 Data Sources
Surface melting
in the AIS was detected by radiometer, scatterometer, and model. For the
radiometer, the daily brightness temperature (Tb) in both ascending
and descending orbits spans from 1987 to present with a spatial resolution of
25 km[6-7]; the Special
Sensor Microwave/Imager (SSM/I) and Special Sensor Microwave Imager/Sounder (SSMIS)
Level-3 Southern Hemisphere EASE-Grid Brightness Temperature dataset were from
the National Snow and Ice Data Center (NSIDC)[8]. We utilized both
passes of the SSM/I horizontally polarized 19.35 GHz Tb to determine
surface melting characteristics.
For the scatterometer, we used the Quick Scatterometer (QSCAT), which
was a quick recovery mission to replace the NASA Scatterometer. Since the QSCAT
ceased operation in 2009, the Advanced
Scatterometer (ASCAT) has been used to extend the QSCAT
backscatter record for studies on snow and ice melting. ASCAT is a C-band (5.3
GHz) scatterometer with three vertically polarized antennas for the
Exploitation of Meteorological Satellites (EUMETSAT) MetOp-A and MetOp-B. To
improve the utility of the data, the Scatterometer Image Reconstruction (SIR)
product was developed by the NASA Scatterometer Climate Record Pathfinder (SCP)
project[9]. The radar scatterometer-based time series achieved a
balance between high resolution and coverage in the polar region and are publicly
available (http://www.scp.byu.edu/). We utilized the daily SIR product to
detect surface melting with a nominal pixel spacing of 4.45 km for both QSCAT
and ASCAT.
Forced by the ERA-Interim reanalysis, the
Regional Atmospheric Circulation Model (RACMO2) combines the atmospheric
dynamics description from the High Resolution Limited Area Model (HIRLAM) with
the physical processes output by the ECMWF global model. RACMO2 has been widely
used in studies on surface mass balance in the Antarctic Ice Sheet, such as
melt flux, snowdrift, precipitation and sublimation[3]. Here, we
utilized the RACMO2 liquid water content (LWC) to detect surface melting.
3.2 Categorical Triple
Collocation (CTC)
Triple
collocation (TC) is a general solution used to validate measurements with unknown
true values by assuming that the measurements (M) are related to the true values (T) as follows[10]:
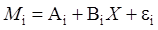 (1)
(1)
where i
represents the different measurement systems, A and B are calibration parameters
and ε indicates the random error. TC is now widely used in estimating the
errors of various measurements, such as soil moisture, precipitation, snow
depth, surface temperature, wind speed and leaf area index. It is assumed that
errors of the measurement systems are not correlated with each other and with
the true value. For binary wet/dry snow retrievals with only two values (1 and -1),
Eqution (1) can be rewritten as:
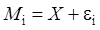 (2)
(2)
ε only has three possible values: 0 indicates
that the observation is correct, 2 indicates that dry snow has been mistaken
for wet snow, and -2 indicates that wet snow has been mistaken for
dry snow. ε is correlated with T for binary retrievals, which violates the key
assumption of classical TC.
Instead, the balanced accuracy (α) of the
measurement systems was introduced to measure the relative performances of the
binary classifications and correlate the errors and truth[11]:
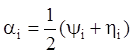 (3)
(3)
where ψ and η
are the sensitivity (the probability of the measurement being true when it is
wet snow) and specificity (the probability of the measurement being true when
it is dry snow), respectively.
The sample covariance matrix (Q) corresponds to the balanced accuracy
α for the stationary variables[12]:
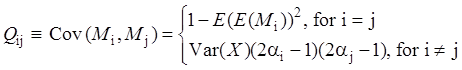 (4)
(4)
For the non-stationary variables that show significant seasonal variations
(e.g., wet/dry snow retrievals), Eq. (4) can be generalized as:
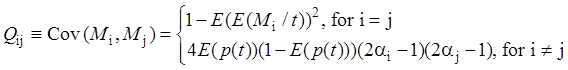 (5)
(5)
where p(t) ≡ pM (M = 1| t) and t is time. The random errors ε
for the different measurement systems are supposed to be conditionally
independent of each other when applying CTC (i.e., Pr(εi, εj|T)
= Pr(εi|T) Pr(εj|T), i ≠ j). There are three equations for the three measurement
systems when i ≠ j. If we define Wi
as follows:
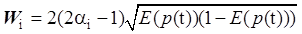 (6)
(6)
Then we have:
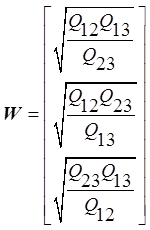 (7)
(7)
Since Wi is a monotonically increasing function of αi, the sorting of W in descending
order represents the rankings of the performances for the corresponding
measurement systems[3,11].
3.3 Methods
The
flowchart outlining how the freeze-thaw dataset was developed is shown in
Figure 1. We first obtained the time-series data of the different measurement
systems. Then, the radiometer grids and RACMO2 grids were reprojected and resampled
to the same spatial resolution as the scatterometer (4.45 km). The freeze-thaw
dataset was generated by adopting the best source of CTC rankings.
In this study, surface melting detected by the radiometer and
scatterometer was based on thresholding the Tb
values and backscatter values σ0
time series. Wet snow was identified when the daily observations exceeded (or
dropped below) a certain value. The general methods can be described as follows:
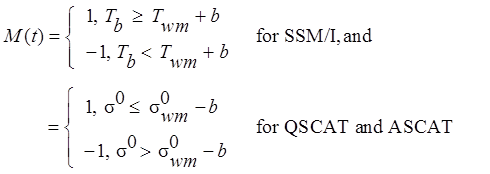 (8)
(8)
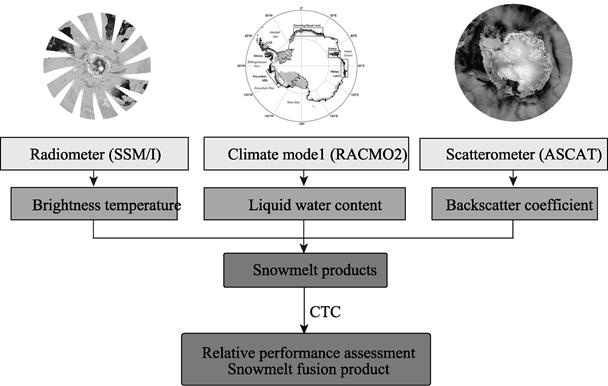
Figure 1 Flowchart of outlining the
development of the freeze-thaw dataset
where t is time and M (t) represents the
wet/dry state, where M = 1 indicating
wet snow and M = ‒1 indicating dry
snow. For the radiometer, we utilized the horizontally polarized
19 GHz Tb to recognize surface melting, and Twm
was the winter (from May to July) mean Tb. Surface
melting detected by this method agreed well with the positive air temperature
(Tair) when b was set to 30 K. For QSCAT, b = 2 dB was empirically
determined by comparison with Tair[6,9,13]. The threshold for ASCAT was set to 2.7 dB. Surface melting derived from
RACMO2 was identified when the LWC exceeded 0.4 mm (i.e., 0.4 kg·m‒2).
Assuming conditional independence between the
three different measurement systems, the 3 × 3 covariance matrix can be
decomposed to estimate the rankings of the OLW products with respect to their
balanced accuracies. The ranking of the OLW products based on the CTC algorithm
can be summarized as follows: (i) calculate the covariance matrix Q from the
scatterometer, radiometer and RACMO2 OLW estimations; (ii) estimate W from Q
based on Eqution (7); and (iii) obtain the rankings by sorting W in descending
order. A CTC fusion OLW product was generated by adopting the best source for
each pixel.
4 Data Results and Validation
4.1 Data Files
The freeze-thaw dataset was named
“DailyMeltingAntarctic_1999-2019”, and it is composed of 2 subsets named
“Melt1999_2009.nc” and “Melt2010_2019.nc”. The naming convention of the dataset
was “subject+study area+time”, and the subsets were named in the form of
“subject+time”. The two subsets stored the freeze-thaw data of the AIS during
1999‒2009 and 2010‒2019.
4.2 Data Results
The dataset covers from 1 July 1999 to 30
June 2019. To capture continuous melt seasons, we defined a melt year as
starting on 1 July and ending on 30 June in the following year. The dataset has
a spatial resolution of 4.45 km, and its temporal resolution is 1 day. The data
type of this dataset is integer in which 1 represents melting and –1 represents
freezing. The dataset is archived in the .nc format, and the file size is 35.7
MB after compression.
The evolution of surface melting of the AIS in
the summer of 2012/13 is shown in Figure 2. In austral summer, surface melting
first occurred in the northern part of the Antarctic Peninsula (AP) and the
coastal areas of the AIS and then gradually expanded towards higher latitudes.
In mid-December, large-scale surface melting occurred in the Larsen and Wilkins
ice shelves. The melting area reached its peak in early January. By this time,
most of the ice shelves had experienced melting, and the groundling ice sheet
had also experienced sporadic melting. After the melting peak, the melting area
shrank rapidly. In February, only the AP and a small number of ice shelves were
still melting and then gradually froze.

Figure 2 Evolutions of surface
melting of the AIS in the summer of 2012 and 2013
4.3 Data Validation
Suffering
from a lack of in situ measurements
of snow liquid water, melting products derived
from satellites or models are usually evaluated when the recorded air temperature
(Tair) from automatic weather stations (AWSs) exceeds 0 ºC. We utilized the Zhongshan Station Tair
data from July 2016 to June 2018 to validate the accuracy of the data product.
Melt signals derived from our product and the maximum Tair showed a
high overall accuracy of 0.922.
5 Discussion and Conclusion
Surface
melting derived from the scatterometer, radiometer, and RACMO2 data showed a
complementary nature[2]. The scatterometer showed a higher sensitivity to liquid
water than the radiometer[7]. The radiometers showed the best
performance in places with long melt seasons[3]. The RACMO2 model was the most applicable in
mountainous areas with rock outcrops where it is difficult for satellites to
work[2].
Therefore, our product is more accurate than using a single data source product
because it combines the advantages of various observations.
By merging the
freeze-thaw products derived from scatterometer, radiometer and climate model,
we developed a surface freeze-thaw dataset with a high temporal and spatial
resolution for the AIS based on multisource data. The data validation was conducted
using the AWS Tair data, and the validation results demonstrated the
high accuracy of the product.
Author Contribution
Zhou, C. X., Liu, Y., and Wang, Z. M. developed the total
design of the experiment and final dataset. Liu, Y. contributed to the data
collection and processing. Zheng, L. and Liu, Y. designed the algorithms of the
dataset. Liu, Y. conducted the data validation. Zhou, C. X. and Liu, Y. wrote
the data paper.
References
[1]
Wang, X. D.
Antarctic Ice Sheet freeze-thaw detection based on Active and Passive Microwave
Remote Sensing [D]. Changsha: Central South University, 2013.
[2]
Zheng, L., Zhou,
C., Liang, Q. Pan-Antarctic snowmelt detected by microwave remote sensing and
the multi-scale driving forces [D]. Wuhan: Wuhan University, 2019.
[3]
Zheng, L.,
Zhou, C., Liang, Q. Variations in Antarctic Peninsula snow liquid water during
1999–2017 revealed by merging radiometer, scatterometer and model estimations
[J]. Remote Sensing of Environment, 2019,
232: 111219.
[4]
Liu, Y.,
Zhou, C. X., Zheng, L., et al.
Antarctic Ice Sheet Freeze-thaw Dataset (1999–2019) [J/DB/OL]. Digital Journal of Global Change Data
Repository, 2020. https://doi.org/10.3974/geodb.2020.05.01.V1.
[5]
GCdataPR Editorial Office. GCdataPR data sharing policy
[OL]. https://doi.org/10.3974/dp.policy.2014.05 (Updated 2017).
[6]
Steffen, K.,
Abdalati, W., Stroeve, J. Climate sensitivity studies of the Greenland ice
sheet using satellite AVHRR, SMMR, SSM/I and in situ data [J]. Meteorology
and Atmospheric Physics, 1993, 51(3/4): 239‒258.
[7]
Tedesco, M.
Assessment and development of snowmelt retrieval algorithms over Antarctica
from K-band spaceborne brightness temperature (1979‒2008) [J]. Remote Sensing of Environment, 2009,
113(5): 979‒997.
[8]
SSM/I
Level-3 EASE-Grid Data Product. US National Snow and Ice Data Center-NSIDC.
https://nsidc.org/data.
[9]
Long, D. G.,
Hardin, P. J., Whiting, P. T. Resolution enhancement of spaceborne
scatterometer data [J]. IEEE Transactions
on Geoence & Remote Sensing,
1993, 31(3): 700‒715.
[10]
Stoffelen,
A. Toward the true near-surface wind speed: error modeling and calibration
using triple collocation [J]. Journal of
geophysical research: oceans,
1998, 103(C4): 7755‒7766.
[11]
McColl, K.
A., Roy, A., Derksen, C., et al.
Triple collocation for binary and categorical variables: application to validating
landscape freeze/thaw retrievals [J].
Remote Sensing of Environment, 2016, 176: 31‒42.
[12]
Parisi, F.,
Strino, F., Nadler, B., et al.
Ranking and combining multiple predictors without labeled data [J]. Proceedings of the National Academy of Sciences,
2014, 111(4): 1253‒1258.
[13]
Jay, Z. H.,
Fiegles, S. Extent and duration of Antarctic surface melting [J]. Journal of Glaciology, 1994, 40(136): 463‒475.