VIIRS/DNB Monthly and Yearly Nighttime Light
Dataset in Beijing-Tianjin-Hebei Region
Chen, M. L.1,2 Cai, H. Y.1*
1. State Key Laboratory of Resources and
Environmental Information System, Institute of Geographic Sciences and Natural
Resources Research, CAS,
Beijing 100101, China;
2. University of Chinese Academy of Sciences, Beijing
100049, China
Abstract: The
new generation nighttime light data, which sensed by the Visible Infrared
Imaging Radiometer Suite Day/Night Band (VIIRS/DNB) are severely subject to
stray light, resulting in the appearance of a large number of missing pixels in
mid and high latitudes, especially in the summer. Therefore, to obtain the
consecutive spatial-temporal nighttime light data and
promote the application of nighttime light data, this study applied the cubic
Hermite interpolation algorithm to interpolate the missing values from May to
August in Beijing-Tianjin-Hebei Region. This dataset includes monthly and yearly average subsets. The time span is
2013-2018, the spatial resolution is 15², and the total data volume is 234 MB.
Moreover, since ephemeral light was filtered out, this dataset is more applicable
for stable socio-economic research, rather than ephemeral light research.
Keywords: VIIRS/DNB nighttime
light; cubic Hermite interpolation; missing pixels; monthly average composite; Beijing-Tianjin-Hebei Region
1 Introduction
The new generation nighttime light (NTL) data, which sensed by the Visible Infrared Imaging Radiometer Suite Day/Night
Band (VIIRS/DNB) are severely vulnerable to stray light, resulting in the appearance of massive distorting
pixels in mid and high latitudes, especially in the summer (May to August)[1].
To address this problem, NOAA provided two
versions of the NTL, denoted by the VCM (VIIRS Cloud Mask) and VCMSL (VIIRS
Cloud Mask with Stray Light), respectively. Pixels that
contaminated by the stray light were eliminated in the VCM version, and
therefore numerous missing pixels exist in this version. The VCMSL
version covers more data toward the poles after corrected the distorting
pixels by a stray light correction procedure that provided by Mills[2]. However, two significant imperfections
exist in the VCMSL version. One is the absent of 2012 and 2013 in this version,
the other one is the quality still need to be improved[2-3]. For example, radiation suddenly becoming
low in some areas were found in the VCMSL version[4]. Thereby, interpolating missing values is
importance for obtaining consecutive spatial-temporal NTL data and promoting
its application.
Given the fact that the missing pixels tend to
exist over a large area, interpolation based on temporal
interpolation method is more suitable than spatial interpolation method. The
cubic Hermite interpolation is one of the most prevalent temporal interpolation
algorithms. This algorithm
has the advantages of high accurate and no overshoot[5-6]. Thus this algorithm was used to
interpolate the missing pixels of the VIIRS/DNB NTL data in the summer (May to
August). Furthermore, the Beijing-Tianjin-Hebei Region
is a representative economic and population agglomeration area in China,
located in the middle latitude region and contaminated by the stray light in
the summer. As a result, this study mainly focus on interpolating missing
pixels in this region, producing a monthly average dataset without missing
pixels (here after called the interpolated NTL data), and synthesizing annual
average dataset on this basis.
2 Metadata of Dataset
The
metadata of the VIIRS/DNB NTL data without missing pixels in Beijing-Tianjin-Hebei
Region dataset[7] is summarized in Table 1. It includes the dataset full
name, short name, authors, year of the dataset, temporal resolution, spatial
resolution, data format, data size, data files, data publisher, and data
sharing policy, etc.
3 Methods
3.1 Data
The original data of this study were the
monthly VCM composites from 2012 to 2019. When
interpolating the missing pixels in May to August based on the cubic Hermite
interpolation method, the eight months before May and the eight months after
August of the VCM data served as the original data. Taking 2015 as an example,
monthly VCM data from September 2014 to April 2015, and September 2015 to April
2016 are the original data for interpolation.
Table 1 Metadata summary of the VIIRS/DNB NTL data without
missing pixels in Beijing-Tianjin-Hebei Region
|
Items
|
Description
|
|
Dataset full name
|
the VIIRS/DNB nighttime light data without missing pixels
in Beijing-Tianjin-Hebei Region
|
|
Dataset short name
|
VIIRS_DNB_Hermite_JJJ
|
|
Authors
|
Chen, M. L. Y-3945-2019, State Key Laboratory of Resources
and Environmental Information System, Institute of Geographic Sciences and
Natural Resources Research, CAS, chenml.19b@igsnrr.ac.cn
Cai, H. Y. Y-8555-2019, State Key Laboratory of Resources
and Environmental Information System, Institute of Geographic Sciences and
Natural Resources Research, CAS, caihy@igsnrr.ac.cn
|
|
Geographical region
|
The Beijing-Tianjin-Hebei Region
|
|
Year
|
2013?C-2018 Temporal
resolution monthly
and yearly
|
|
Spatial resolution
|
15² Data format .tif Data
size 234 MB
|
|
Data files
|
The dataset consist of two subsets: one subset is yearly
average product, time span is from 2013 to 2018, the other subset is monthly
average product, including monthly data of May to August of 2013 to 2018. The
unit is nWcm-2sr-1.
|
|
Foundations
|
Ministry of Science and Technology of P. R. China (2017YFC0503803);
Chinese Academy of Science (XDA20010203, ZDRW-ZS-2017-4)
|
(To be continued on the next page)
(Continued)
|
Items
|
Description
|
|
Data publisher
|
Global Change Research Data
Publishing & Repository, http://www.geodoi.ac.cn
|
|
Data Computing Environment
|
MATLAB,
campus
license of Institute of Geographical Sciences and Natural Resources Research,
Chinese Academy
of Sciences
ArcGIS campus license of Institute of Geographical Sciences and
Natural Resources Research, Chinese Academy of Sciences
|
|
Address
|
No. 11A, Datun Road, Chaoyang District, Beijing 100101,
China
|
|
Data sharing
policy
|
Data from
the Global Change Research Data Publishing & Repository includes
metadata, datasets (data products), and publications (in this case, in the Journal of Global Change Data & Discovery). Data sharing policy includes: (1) Data
are openly available and can be free downloaded via the Internet; (2) End
users are encouraged to use Data subject to citation; (3)
Users, who are by definition also value-added service providers, are welcome
to redistribute Data subject to written permission from the GCdataPR
Editorial Office and the issuance of a Data redistribution license; and (4)
If Data
are used to compile new datasets, the ??ten per cent principal?? should be
followed such that Data records utilized should not
surpass 10% of the new dataset contents, while sources should be clearly
noted in suitable places in the new dataset[8]
|
|
Communication and searchable
system
|
DOI, DCI, CSCD, WDS/ISC,
GEOSS, China GEOSS
|
|
3.2 Algorithm Principle
Background noise and ephemeral light does not
remove from the current VIIRS/DNB NTL data. Consequently, some pixels with
negative values and abnormally high-valued exist in the original NTL data. The
threshold method was used to eliminate the outliers. Pixels with negative
values were reassigned to zero[9]. The
biggest median value of the whole study period in the study area, which was 285
nWcm-2sr-1, was served as the up threshold. Pixels
with a value that larger than 285 nWcm-2sr-1 were reassigned to that value.
The core idea of
the cubic Hermite interpolation is to construct a
polynomial that no higher than cubic degree between each two adjacent nodes. Time nodes of a pixel are assumed to be
 . Correspondingly, its radiations are assumed to be
 . After calculated at pixel level,
the interpolation curve f (x) will: (1)
. After calculated at pixel level,
the interpolation curve f (x) will: (1)  ; (2) the polynomial between any two adjacent
nodes is no higher than cubic degree; (3) satisfy the first derivative, but not necessarily the second derivative.
That is to say the curve stay shape preserving[10], and the results
would not exceed the maximum value of the original data.
Calculation were accomplish by MATLAB.
; (2) the polynomial between any two adjacent
nodes is no higher than cubic degree; (3) satisfy the first derivative, but not necessarily the second derivative.
That is to say the curve stay shape preserving[10], and the results
would not exceed the maximum value of the original data.
Calculation were accomplish by MATLAB.
3.3 Data Processing
The flow of producing the monthly and yearly interpolated NTL data is shown in the Figure 1. Taking 2015 as an
example, the monthly VCM NTL data from September 2014
to April 2016 (except May to August 2015) in Beijing-Tianjin-Hebei Region were
collected as the original data. After the outliers remove and the cubic Hermite
interpolation calculation, the monthly interpolated NTL data from May to August
2015 were produced. On this basis, combining with monthly VCM NTL data in other
months of 2015, the annual average NTL data of 2015 was synthesized.
4 Results and
Validation
4.1 Data Composition
The dataset consists of two subsets: One subset is
the yearly average composite. Its time span is from 2013 to 2018, the other
subset is the monthly average product, including monthly data of May to August
of 2013 to 2018. The unit is nWcm-2sr-1.
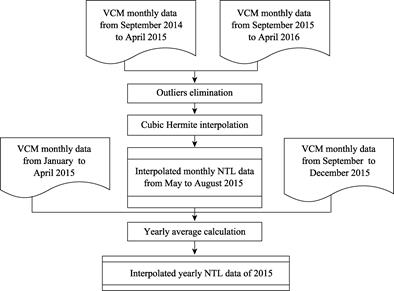
Figure 1 Flow chart for producing the interpolated monthly and
yearly nighttime light data
4.2 Data Products
An
example of interpolated NTL data is shown in Figure 2: Both monthly (Figure
2(a)) and yearly (Figure 2(b)) data can significantly
describe the outlines of Beijing, Tianjin, Shijiazhuang and other middle and
small cities. They also reflect the radiation differences within the cities. In
a certain city, in general, the largest radiations are
commonly located in the airport, such as the Beijing Capital International
Airport, the Tianjin Binhai InternationalAirport and
the Tianjin Tanggu Airport (Figure 2(b)). The radiations of these places
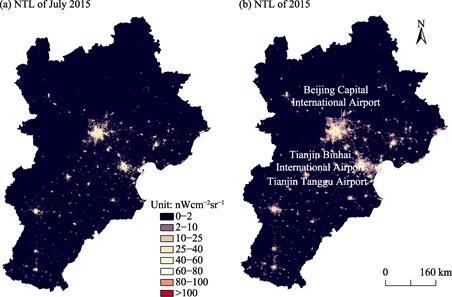
Figure
2 The
interpolated nighttime light data
can ar-rive more than 200 nWcm-2sr-1. The smallest
radiations usually sprawl in the urban fringe. Their radiations tend to be less
than 10 nWcm-2sr-1. The radiations
in other region within the city are about 10?C100 nWcm-2sr-1, in the developed commercial areas are generally
between 50?C100 nWcm-2sr-1.
4.3 Data Validation
|
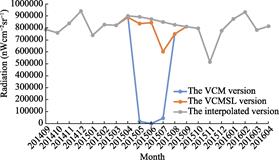
Figure 3 The radiation time series comparison
of the three versions nighttime light data
|
The NTL data are mainly composed by stable artificial
light. If the cities did not suffer any disaster or war, their radiation time series should fluctuate slightly[11,12].
Therefore, radiation time series of three version of NTL data (the VCM version,
the VCMSL version and the interpolated version) in the study area during September
2014 to April 2016 were compared. As shown in Figure 3, in the non-summer
months, there is little variation between the three versions. In the summer
months (May to August), however, obvious differences are easy to distinguish.
In the VCM version, due to remove the contaminated
pixels, its radiation drops sharply during the summer
months, even drops to zero in June. On the contrary, the radiation time series
of the VCMSL version and the interpolated version tend to be more stable resulting
from stray light correction. However, further comparison reveals that the radiation
of the VCMSL version in July is much small than other months. Spatially, its
nighttime light contrast is weakened and the urban texture is not clearly
depicted (Figure 4(b)). In contrast, the interpolated version was most stable,
and its spatial distribution was reflective of the texture of the city (Figure
4(a)).
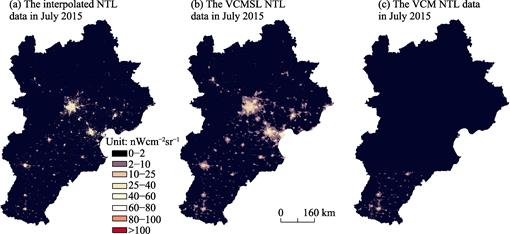
Figure 4 The comparison of three nighttime
light data (taking July 2015 as an example)
5 Discussion and Conclusion
As one of the commonly used interpolation algorithms, the
cubic Hermite interpolation has obvious advantages. It does not require the
original data to conform to the statistical distribution. Its
calculation only require a short time to accomplishment and
does not require subjective intervention. Most importantly, its results are
stable[10]. Therefore, this algorithm is suitable for VIIRS/DNB NTL
interpolation that with a large number of pixels and a short time series. In
addition, the calculation of this algorithm is based on the average state of
the original data, to some extent ensures that the interpolated results to be of stable, consequently avoiding the situation that
the radiation become too small in certain months in the VCMSL version. Thus the
interpolated version is more consistent with the fact that most nighttime light
show slow changes. At the same time, the algorithm can effectively filter out
fire and abnormally
high-valued outliers, so that it is
more effectively applied to the study of social and economic activities
research.
Nevertheless, the cubic Hermite interpolation has its
limitations. Firstly, the algorithm has a high requirement on the length of the
original data. Secondly, the algorithm is easily subject to outliers. Third,
since the interpolation calculation is mainly based on stable light, the
results do not reflect ephemeral light. So the interpolated
dataset is mainly applicable to the study of stable light that reflecting
social and economic activities, rather than the ephemeral light research.
Author Contributions
Chen, M. L. designed the algorithms of the dataset
and wrote the data paper. Cai, H. Y. contributed to the arrangement and
revision of the paper.
References
[1]
Mills, S. D., Straka, W.,
Mills, S, P., et al. Illuminati the
capabilities of the suomi national polar-orbiting partnership (NPP) visible
infrared imaging radiometer suite (VIIRS) day/night band [J]. Remote Sensing, 2013, 5(12): 6717?C6766.
[2]
Mills, S., Weiss, S., Liang, C.
VIIRS day/night band (DNB) stray light characterization and correction [C].
Earth Observing Systems XVIII. International Society for Optics and Photonics,
2013, 8866(11): 350?C354.
[3]
Bennett, M. M., Smith, L. C.
Advances in using multitemporal night-time lights satellite imagery to detect,
estimate, and monitor socioeconomic dynamics [J]. Remote sensing of environment, 2017, 192: 176?C197.
[4]
Chen, M. L., Cai, H. Y.
Interpolation methods comparison of VIIRS/DNB nighttime light monthly composites:
A case study of Beijing [J]. Progress in Geography, 2019, 38(1), 126?C138.
[5]
Geng, A. C. The application of
matlab in teaching of cubic spline interpolation function [J]. Value Engineering,
2016, 35(18): 181?C182.
[6]
Fritsch, F. N., Carlson, R. E.
Monotone piecewise cubic interpolation [J]. SIAM
Journal on Numerical Analysis, 1980, 17(2): 238?C246.
[7]
Chen, M. L., Cai, H. Y. The
monthly and yearly VIIRS/DNB nighttime light dataset with the cubic Hermit interpolation
correction in Beijing-Tianjin-Hebei Region [DB/OL]. Global Change Research Data
Publishing & Repository, 2015. DOI: 10.3974/geodb.2015.01.17.V1.
[8]
GCdataPR
Editorial Office. GCdataPR data sharing policy [OL]. DOI:
10.3974/dp.policy.2014.05 (Updated 2017).
[9]
Shi, K., Yu, B., Huang, Y., et al. Evaluating the ability of
NPP-VIIRS nighttime light data to estimate the gross domestic product and the
electric power consumption of China at multiple scales: A comparison with
DMSP-OLS data [J]. Remote Sensing,
2014, 6(2): 1705?C1724.
[10] Manni, C. On shape
preserving C2 Hermite interpolation [J]. BIT
Numerical Mathematics, 2001, 41(1): 127?C148.
[11]
Li,
X., Zhang, R., Huang, C., et al. Detecting 2014 Northern Iraq Insurgency
using night-time light imagery [J]. International
Journal of Remote Sensing, 2015, 36(13): 3446?C3458.
[12]
Li, X., Li, D., Xu, H., et
al. Intercalibration between DMSP/OLS and VIIRS night-time light images to
evaluate city light dynamics of Syria??s major human settlement during Syrian
Civil War [J]. International Journal of Remote Sensing, 2017. 38(21):
5934?C5951.