Dataset of Microwave Emissions from Snow Melt-refreeze Cycles in Huailai Remote Sensing Comprehensive Experimental Station
Jiang, L. M.1* Cheng, J. Q.1 Zhao, S. J.2 Yang, J. W.1
1. State Key Laboratory of Remote Sensing Science, Jointly Sponsored by Beijing Normal University and
Institute of Remote Sensing and Digital Earth of Chinese Academy of Sciences, Faculty of Geographical Science, Beijing Normal University, Beijing 100875, China;
2. Faculty of Geographical Science, Beijing Normal University, Beijing 100875, China
Abstract: The monitoring of snow melt-refreeze cycles is important for studies of land surface hydrological processes and snow disasters. Field measurements of snow melt-refreeze cycles were conducted using a truck-mounted microwave radiometer (Truck-mounted multi-frequency radiometer, TMMR) from November 7 to November 27, 2012 at the Huailai Remote Sensing Comprehensive Experimental Station, Zhangjiakou, Hebei province, China. The resulting dataset included brightness temperatures at multiple-frequencies (6.925, 10.65, 18.7, and 36.5 GHz) and multi-angle snow parameters, such as snow depth, snow temperature, and wetness.
Keywords: snow Cover; melt-refreeze cycles; microwave emission; brightness temperature, Huailai Remote Sensing Station
1 Introduction
Snow cover is a critical component of the cryosphere and is a crucial parameter in meteorological and hydrological studies. Melt-refreeze cycles of snow cover play an important role in climate change, water resource management, and snow disaster prevention[1]. Passive microwave sensors have proven to be suitable for monitoring terrestrial snow cover, especially in the open prairie environment, due to their rapid scene revisit capabilities, all-weather imaging, and the ability to derive quantitative estimates of snow water equivalent (SWE).
The frequencies used to monitor snow properties include 6.925, 10.65, 18.7, 36.5 and 89 GHz. Low frequencies, such as 6.925, 10.65, and 18.7 GHz, are sensitive to soil (dielectric properties and roughness) and dry snow cover because of the long wavelength. However, the higher frequencies are easily affected by snow parameters, such as snow depth, density, and snow grain size, with errors caused by scattering effects[2]. Microwave brightness temperature (Tb) is also related to snow density, temperature, wetness, and soil properties. Snow parameters, and soil and atmospheric properties will vary with snow melt-refreeze cycles, and therefore the confounding effect of snow melt-refreeze on microwave radiation must be considered. After the onset of melt-refreeze cycles, where snow is typically wet during the daytime and refreezes overnight, there can be rapid grain growth and a corresponding low Tb[3]. To display snow melt-refreeze cycles, dry snow is referred to as frozen snow and wet snow is called melt snow in this work. The measurement dataset of snow melt-refreeze cycles in Huailai Remote Sensing Comprehensive Experimental Station can be used to understand changes in snow and soil parameters[4]. Its use is critical to improve snow radiation models and retrieve snow parameters accurately with spaceborne remote sensing.
2 Metadata of Dataset
Table 1 shows the dataset name and its authors, geographical location, time period covered, temporal resolution, spatial resolution, components, publisher, sharing services platform, and policies.
Table 1 Metadata summary of snow melt-refreeze cycles dataset at the Huailai Remote Sensing Comprehensive Experimental Station
|
Items
|
Description
|
|
Dataset name
|
|
|
Short name
|
MicrowaveSnowValidationDataHuailai2012
|
|
Authors
|
Jiang, L. M. L-6099-2016, Beijing Normal University, jiang@bnu.edu.cn
Cheng, J. Q. L-5763-2016, Beijing Normal University, 462692369@qq.com
Zhao, S. J D-8048-2013, Beijing Normal University, shaojie.zhao@bnu.edu.cn
Yang, J. W E-8426-2018, Beijing Normal University, stu_yangjianwei@163.com
|
|
Location
|
Huailai Remote Sensing Comprehensive Experimental Station, Zhangjiakou, Hebei province (40°20'N, 115°47'E)
|
|
Time period covered
|
November 7 to November 27, 2012
|
|
Data format
|
.xls, .jpg
|
|
Data size
|
4.1 MB
|
|
Components
|
Brightness temperature at 6.925, 10.65, 18.7, and 36.5GHz, snow parameters.
|
|
Foundation
|
National Natural Science Foundation of China??41171260, 41671334??
|
|
Services Platform
|
Global Change Research Data Publishing & Repository http://www.geodoi.ac.cn
|
|
Address
|
No. 11 A Datun Road, Chaoyang District, Beijing 100101, China
|
|
Sharing policies
|
Data from the Global Change Research Data Publishing & Repository includes metadata, datasets (data products), and publications (in this case, in the Journal of Global Change Data & Discovery). Data sharing policy includes: (1) Data are openly available and can be free downloaded via the Internet; (2) End users are encouraged to use Data subject to citation; (3) Users, who are by definition also value-added service providers, are welcome to redistribute Data subject to written permission from the GCdataPR Editorial Office and the issuance of a Data redistribution license, and; (4) If Data are used to compile new datasets, the ‘ten per cent principal’ should be followed such that Data records utilized should not surpass 10% of the new dataset contents, while sources should be clearly noted in suitable places in the new dataset[5]
|
3 Data Acquisition and Processing
3.1 Field Measurements
Field measurements of snow melt-refreeze cycles were conducted with a truck-mounted microwave radiometer (Truck-mounted multi-frequency radiometer, TMMR) from November 7 to November 27, 2012. Measurements were made at Huailai Remote Sensing Comprehensive Experimental Station, Zhangjiakou, Hebei province (40°20'N, 115°47'E). The station is part of the special environment network of the Chinese Academy of Sciences. This area has the characteristics of the eco-environment from the North China Plain to the Inner Mongolian Plateau. Land cover includes farmland, water, grassland, mountains, wetland, and mudflats that extend for around 10 km. The field site was covered with snow underlying farmland, which has an east-west ridge structure.
3.2 Instruments
3.2.1 Microwave Radiometer Observation System
The TMMR was manufactured by RPG-Radiometer Physics GmbH (GmbH, Germany) and was capable of measuring multi-frequency, dual-polarized, and multi-angle microwave emissions. The system consists of four components: microwave radiometer, hydraulic lifting platform, a vehicle, and a power supply system. The radiometer measured in the four frequencies of 6.925, 10.65, 18.7, and 36.5 GHz. The bandwidth was 400 MHz. The half-power beamwidths of the four frequencies were 6.85°, 6.11°, 10.25°, and 10.25°, respectively. After calibration, the absolute accuracy was within 1 K[6]??The radiometer was fixed on a platform which connects with the hydraulic lifting platform. It is controlled by a computer and has a full rotation, azimuth angle from 0 to 360°, and incidence angle from -90° to 90°.
Table 2 Key parameters of the microwave radiometer
|
Frequency
(GHz)
|
Polarization
|
Beamwidth
|
Bandwidth
|
Absolute
accuracy
|
Incidence
angle
|
Azimuth
angle
|
|
6.925
|
V, H
|
6.85º
|
400 MHz
|
1 K
|
-90º–90º
|
0º–360º
|
|
10.65
|
V, H
|
6.11º
|
|
18.7
|
V, H
|
10.25º
|
|
36.5
|
V, H
|
10.25º
|
3.2.2 Snow Fork
A snow fork can measure resonance frequency, attenuation, and the 3-dB bandwidth through an electromagnetic method. The snow dielectric constant can then be calculated. Eventually, snow density and snow wetness are obtained with empirical formulas. The measuring range of the resonance frequency is from 500 to 900 MHz, dielectric constant from 1 to 2.9, dielectric loss from 0 to 0.15, snow density from 0 to 0.6 g/cm3 and snow wetness from 0 to 10%.
3.2.3 Automated Data Logger
The data logger had four channels, three for temperature and one for soil moisture. It
recorded temperature and moisture based on a selected time interval and the accuracy was reliable.
3.3 Data Acquisition
The dataset acquired contained the brightness temperature and snow parameters.
(1) Snow brightness temperature of the melt-refreeze cycles
The height of the radiometer was 4.7 m and the incidence angle was 50° (Figure 1). Measurements were made with a vehicular microwave radiometer from November 7 to November 27, 2012. During measurements the sky radiation was observed regularly. The aim was to obtain the downwelling sky brightness temperature.
(2) Snow parameters acquisition
Brightness temperature and concurrent snow parameters were measured. The snow/soil
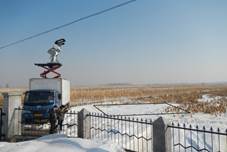
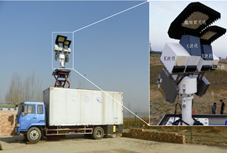
Figure 1 Microwave radiometer observation system
parameters measured included snow depth, snow grain size, snow wetness, and soil moisture and temperature. The snow stratigraphy and land cover were also recorded. Air temperature and snow temperature were measured with a platinum resistance thermometer JM624u (0.1 °C). Snow depth was measured with a ruler. Snow grain size was obtained with a handheld microscope. Snow density and wetness were acquired using a snow fork. Several automated data recorders were used to collect soil moisture and temperature.
Table 3 List of snow parameters and measurement methods
|
Parameters
|
Method
|
Precision
|
|
Snow depth
|
Ruler
|
1 mm
|
|
Temperature
|
JM624u platinum resistance thermometer
|
0.1 °C
|
|
Automated data recorder
|
|
Snow grain size
|
Handheld microscope
|
0.1 mm
|
|
Snow density
|
Snow fork
|
0.01 g/cm3
|
|
Snow wetness
|
0.01%
|
3.4 Data Processing
The brightness temperature data was filtered to remove extremely large radiation values (over 300 K and under 150 K). Then, Tb values were obtained from the time series values, which were smoothed with a five-minute moving average to remove high frequency variability due to atmospheric effects. There were gaps in the data because of unfavorable weather conditions, such as heavy precipitation and strong wind. Tb dataset was stored in the form of an Excel file. Snow depths were collected and then averaged daily before being entered into the Excel file. Concurrent snow density and wetness, snow temperature, air temperature, soil temperature, and moisture were also averaged and saved in the excel file.
3.5 The Dataset Development Process Flowchart
Figure 2 shows the dataset process flowchart for the recording of microwave emissions of snowmelt-refreeze cycles: (1) observation data quality control was conducted under several criteria; (2) a cross validation was made with the HUT model; and (3) the dataset was generated and stored.
4 Data Results and Validation
4.1 Dataset Components
The resulting dataset consisted of spreadsheet files (.xls) and images (.jpg). Spreadsheet files consisted of time series Tbs, snow depth, snow grain size, temperature, and wetness. Images consisted of test scenes and pictures of the instrument used.
|
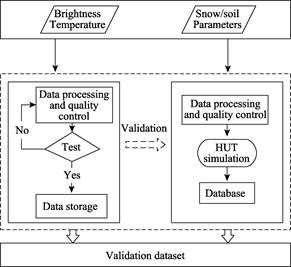
Figure 2 The dataset process flowchart
|
4.2 Results and Discussion
4.2.1 Time Series of Brightness Temperature
A melt-refreeze cycle is the period of time between the maximal and minimal Tb in a snow season. Figure 3 shows the vertical polarization of Tb values at 6.925, 10.65, 18.7, and 36.5 GHz. The time series of Tb values shows strong cycles, which correlated well with snow accumulation, ablation, and temperature. Generally, the higher the frequency and the thicker the snow depth, the smaller the Tb value was.
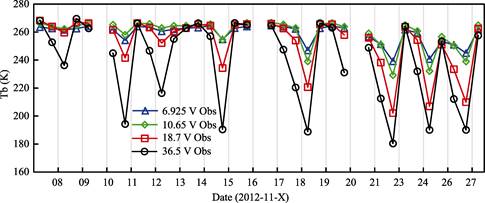
Figure 3 The time series of measured brightness temperature at 6.925, 10.65, 18.7, and 36.5GHz from November 7 to November 27, 2012
4.2.2 Relationship between Tb Values and Snow Parameters
Figure 4 shows a time series of average snow temperatures and air temperatures. The trend of both snow and air temperatures is the same. There were smooth variations in the snow record. When the snow temperature was close to 0 °C, snow began to melt. Snow began to refreeze when the temperature was below 0 °C, and the average temperature could drop to -10.9 °C.
Figure 5 shows the time series of snow depth, which decreases with repeating melt-refreeze cycles. The 36.5 GHz frequency was more sensitive to snow wetness than the 18.7 GHz frequency. When snow melts, the Tb value was largest at 36.5 GHz. The Tb value was smallest when snow refreezes. The change at 36.5 and 18.7 GHz was 80 and 60 K, respectively. The relationship between Tb values and snow temperature or snow depth was considered reasonable.
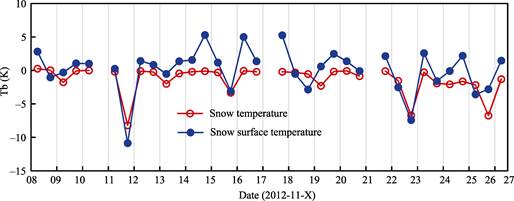
Figure 4 The time series of averaged snow temperature and air temperature from November 7 to
November 27, 2012
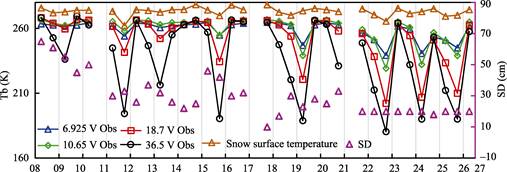
Figure 5 The time series of measured Tb values, snow temperature, and snow depth from November 7 to November 27, 2012
Figure 6 shows the time series of snow wetness measured by a snow fork. The wetness in the morning was low because of the low temperature. In contrast, in the afternoon, snow wetness was greater than 6%, which was caused by the high temperature. There was a clear stratigraphic effect, with snow cover consisting of refreezing snow in the upper layer and melting snow underneath. However, a scattering effect caused the Tb value to decrease at 36.5 GHz, e.g., at 5 pm and 7 pm on November 20 and 6 pm on November 21.
4.3 Cross Validation with the HUT Model
The time series of observed and simulated Tb values[7–8] is shown at 36.5 GHz (Figure 7(a)) and 18.7 GHz (Figure 7(b)). Table 3 shows the correlation coefficient (R) and root mean square error (RMSE) between measurements and simulations. It also shows that the performance for a vertical polarization was better than that for a horizontal polarization. To simulate Tb values more precisely, single-layer and multi-layer models were compared. The result indicates that a multi-layer HUT model is superior to a single-layer model. The correlation coefficients at 18.7 and 36.5 V GHz were 0.97 and the RMSEs were 7 and 12.4 K, respectively (Table 4). The multi-layer HUT model performed better in the simulation of Tb values for melt-refreeze cycles, although both models were able to reflect the trend of changes in Tb.
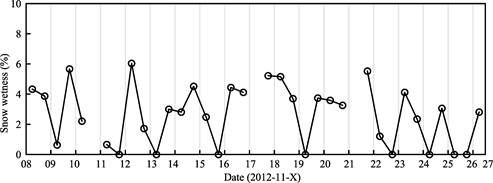
Figure 6 Time series of average snow wetness from November 7 to November 27, 2012
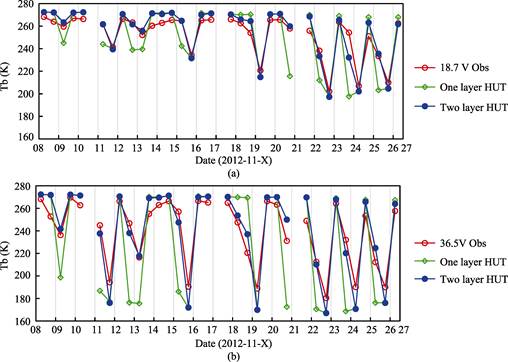
Figure 7 Time series of Tb values for melt-refreeze cycles at 36.5 GHz (a) and 18.7 GHz (b).
Table 4 Comparison of the HUT model and observations
|
HUT
|
Evaluating factors
|
18.7 V
|
18.7 H
|
36.5 V
|
36.5 H
|
|
One-layer
|
R
|
0.8
|
0.74
|
0.81
|
0.81
|
|
RMSE (K)
|
16.7
|
19.6
|
28.1
|
26.7
|
|
Two-layer
|
R
|
0.97
|
0.88
|
0.97
|
0.91
|
|
RMSE (K)
|
7
|
11.3
|
12.4
|
15
|
5 Conclusion
Field measurements of snow melt-refreeze cycles were conducted with microwave radiometer (TMMR) from November 7 to November 27, 2012 at Huailai Remote Sensing Comprehensive Experimental Station. A time series of Tb values, snow depth, snow density, snow wetness, and temperature were acquired. The resulting snow microwave emission dataset included: (1) multi-frequency brightness temperature at 6.925, 10.65, 18.7, and 36.5 GHz; (2) snow parameters, such as snow depth, snow density, snow wetness, and snow temperature; (3) soil parameters, such as soil moisture and temperature; and (4) scenes and pictures of the instruments used. The microwave radiometer observation system was considered reliable and was based on standard measurement procedures.
Author Contributions
Jiang, L. M. is responsible for overall design of dataset development. Cheng, J. Q. and Zhao, S. J. are responsible for data collection and processing. Jiang, L. M. and Yang, J. W. are responsible for writing paper.
Acknowledgements
The authors are grateful to the Huailai Remote Sensing Comprehensive Experimental Station for supporting this work.
References
[1] Macelloni, G., Paloscia, S., Pampaloni. P., et al. Monitoring of melting refreezing cycles of snow with microwave radiometers: the microwave alpine snow melting eExperiment (MASMEx 2002-2003) [J]. IEEE Transactions on Geoscience and Remote Sensing, 2005, 43(11): 2431-2442.
[2] Hofer, R., Mätzler, C. Investigations on snow parameters by radiometry in the 3?\to 60?\mm wavelength region [J]. Journal of Geophysical Research, 1980, 85(C1): 453-460.
[3] Foster, J. L., Sun, C., Walker, J. P., et al. Quantifying the uncertainty in passive microwave snow water equivalent observations [J]. Remote Sensing of Environment, 2005, 94(2): 187-203.
[4] Jiang, L. M., Cheng, J. Q., Zhao, S. J. Microwave emission validation dataset of snow melting/refreezing process in Huailai county, China 2012 [DB/OL]. Global Change Research Data Publishing & Repository, 2016. DOI: 10.3974/geodb.2016.02.11.V1.
[5] GCdataPR Editorial Office. GCdataPR Data Sharing Policy [OL]. DOI:10.3974/dp.policy. 2014.05 (Updated 2017).
[6] Rose, T., Czekala, H. Operational manual of RPG-8CH-DP 4 frequency, dual polarized radiometer, Version 5.5 [Z]. 2006.
[7] Lemmetyinen, J., Pulliainen, J., Rees, A., et al. Multiple-layer adaptation of HUT snow emission model: comparison With experimental data [J]. IEEE Transactions on Geoscience and Remote Sensing, 2010, 48 (7): 2781-2794.
[8] Pulliainen, J., Tigerstedt, K., Wang, H. N., et al. Retrieval of geophysical parameters with integrated modeling of land surfaces and atmosphere (models/inversion algorithms) [R]. Final Report, ESA/ESTEC, Noordwijk, Netherlands, Contract No. 11706/95/NL/NB(SC)), 1998.