Dataset of Farmland Conversion in 456 Counties in the North China Plain (2010)
Jin, G.1,2 Deng, X. Z.1 Chen, D. D.2 Dong, Y.2 Chen, K.2*
1. Institute of Geographic Sciences and Natural Resources Research, Beijing 100101, China;
2. Faculty of Resources and Environmental Science, Hubei University, Wuhan 430062, China
Abstract: Based on the small sample data of households surveyed in the North China Plain (including farmland conversion data, time for the highest level of education of the household, proportion of households out of employed population, and proportion of total agricultural income to household income, etc.), and combining geographic information data, agricultural disaster data, farmland productivity data, etc., we introduced ELL model to calculate the farmland conversion on the county scale in the North China Plain. The results showed that the inflow of farmland in the North China Plain was 440.79-1,379.86 hm2 and the outflow of farmland was 908.61-2,745.29 hm2 in 2010. The average county-level farmland conversion was more dynamic in Jiangsu, Anhui, and Shandong province.
Keywords: North China Plain; farmland conversion; spatial distribution; ELL model
1 Introduction
Farmland conversion is one of the most important factors affecting agricultural sustainable development. Its spatial pattern analysis is the important basis of agricultural transformation. Maintaining the stability of farmland resources, supervising the scale and direction of farmland conversion in major grain-producing areas, and ensuring agricultural development and food security have received great attention in various studies[1–4]. The North China Plain (located at 32°08′N-40°16′N, 112°10′E-122°40′E) includes some counties in Hebei province, Henan province, Shandong province, Jiangsu province, and Anhui province, and municipalities of Beijing and Tianjin. With a total area of about 428,000 km2, the North China Plain is an important agricultural economic zone and a major grain-producing area in China. It is one of the key areas to provide sustainable food supply for China. Historically, the North China Plain has been a relatively poor and malnourished region affected by drought, flooding, and soil salinization. After more than 40 years of effort since the founding of the People’s Republic of China, the Plain has been changed from a food-deficient area to an important grain, cotton, and edible oil production base.
2 Metadata of Dataset
Information from the dataset of farmland conversion in 456 counties in the North China Plain (2010) [5], such as full name, short name, author, geographical region, year, data files, foundation(s), data sharing policy, etc., are listed in Table 1.
Table 1 Metadata summary of the dataset of farmland conversion in 456 Counties in the North China Plain
|
Items
|
Description
|
|
Dataset full name
|
Dataset of farmland conversion in 456 counties in the North China Plain (2010)
|
|
Dataset short name
|
FarmlandConversionNorthChina2010
|
|
Authors
|
Jin, G. M-5431-2018, Institute of Geographic Sciences and Natural Resources Research, jing_simlab@163.com
Deng, X. Z. N-1335-2018, Institute of Geographic Sciences and Natural Resources Research, dengxz@igsnrr.ac.cn
|
|
|
Chen, D. D. M-5442-2018, Faculty of Resources and Environmental Science, Hubei University, chendongdong@igsnrr.ac.cn
Dong, Y. M-5427-2018, Faculty of Resources and Environmental Science, Hubei University, dongy_simlab@163.com
Chen, K. M-5423-2018, Faculty of Resources and Environmental Science, Hubei University, ck_gis@163.com
|
|
Geographical region
|
The North China Plain including some counties and cities in Hebei province, Henan province, Shandong province, Jiangsu province, Anhui province, Beijing, and Tianjin
|
|
Year
|
2010
|
|
Data format
|
. xlsx
|
Data size 46 KB
|
|
|
Data files
|
1
|
|
Foundation(s)
|
National Natural Science Foundation of China (41171434, 41501593, 71225005)
|
|
Data publisher
|
Global Change Research Data Publishing & Repository, http://www.geodoi.ac.cn
|
|
Address
|
No. 11A, Datun Road, Chaoyang District, Beijing 100101, China
|
|
Data sharing policy
|
Data from the Global Change Research Data Publishing & Repository includes metadata, datasets (data products), and publications (in this case, in the Journal of Global Change Data & Discovery). Data sharing policy includes: (1) Data are openly available and can be free downloaded via the Internet; (2) End users are encouraged to use Data subject to citation; (3) Users, who are by definition also value-added service providers, are welcome to redistribute Data subject to written permission from the GCdataPR Editorial Office and the issuance of a Data redistribution license, and; (4) If Data are used to compile new datasets, the ‘ten percent principal’ should be followed such that Data records utilized should not surpass 10% of the new dataset contents, while sources should be clearly noted in suitable places in the new dataset[6]
|
3 Methods
3.1 Primary Data
(1) Farmer household survey data package of the North China Plain in 2010. Ten villages were randomly selected from each county (city) in the North China Plain, then ten farm households were randomly selected from each village, and information on 45,600 peasant households in a total of 4,560 villages was used. In the household survey, the actual coverage area included farm household conversion data of 770 villages in 77 counties (cities) in the region. Supplementary survey data included the time of the highest-level education of the family, the proportion of the population working outside the home, and the proportion of the agricultural income to the total household income.
(2) Basic geographic information data of the North China Plain. This included remote-sensing interpretation data, basic vector data, and raster data. Precipitation, landform type, slope, farmland productivity, etc., were extracted from relevant information on land resources and climate in the North China Plain and unified into raster data with a spatial resolution of 1×1 km2.
In the basic geographic information data, the meteorological data were based on observation records from the meteorological stations of the China Meteorological Administration and sourced from the China Meteorological Science Data Network (http://data.cma.cn). The digital elevation model data were obtained from the National Earth System Science Data Sharing Platform (http://www.geodata.cn/). The soil data, location conditions (vector data of highway traffic trunks, roads, etc.), and land-use data were all derived from the Resource and Environment Data Cloud Platform (http://www.resdc.cn). The data on agricultural disasters originated from the Agricultural Environment Data Center (http://data.ieda.org.cn). The farmland productivity data were derived from evaluation results of relevant studies[7].
3.2 Data Processing
|

Figure 1 Technology route of data processing
|
The technical route of the computational dataset of counties’ farmland conversion in the North China Plain is shown in Figure 1. The processing steps are as follows:
(1) According to 2010 agricultural survey data in the North China Plain, a dataset of rural households containing information on farmland conversion, household education level, percentage of employed population, and family income was prepared. Table 2 shows an information sheet for farmers.
(2) We obtained spatial distribution maps of annual precipitation, slope, per capita arable land, soil organic matter content, plough layer thickness, road distance, multiple cropping index, and distribution of disasters by spatial analysis in the North China Plain. Farmland productivity was calculated from the Estimation System for Agricultural Production.
(3) We calculated means of the basic geographic information data and agricultural data such as family education level, proportion of employed population, and average household income in the county, and then merged the above two types of data to obtain cross-sectional data at the county scale.
(4) We introduced the core algorithms and ideas of the ELL model[8–9] to calculate the scale of farmland conversion in the North China Plain using the following steps:
(i) Determine the study object S = S1∪S2. Sampling group S1 refers to small sample data, and non-sampling group S2 refers to large sample data.
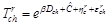
(ii) Conduct regression analysis on sample S1 using:
 (1)
(1)
Where Tch is the farmland conversion scale; c is the county where the land is located; h is the farmer in county c; Dch is the farmer level variable; β is the regression parameter; and uch is the regression residual, uch=ηc+εch (ηc is the residual item caused by inter-county heterogeneity and εch is the residual item caused by the heterogeneity between farm households).
Table 2 Questionnaire for farmers
|
Information classification
|
Attribute
|
|
Coded message
|
County code
|
|
County name
|
|
Record number
|
|
Basic family information
|
Types of business (agriculture, non-agricultural...)
|
|
Household resident population
|
|
Number of employees working outside
|
|
Number of able-bodied worker and semi-able-bodied worker
|
|
Total household income
|
|
Farmland income
|
|
Age distribution
|
|
Education level
|
|
Land management status
information
|
Initial cultivated area
|
|
Increased farmland area during the year
|
|
Decreased farmland area during the year
|
|
Farmland area at the end of the period
National infrastructure land occupation
Rural collective land occupation
Farmers building land occupation
|
|
Village Information
|
Landform type
|
|
Distance from the nearest county
|
|
Distance from the nearest township government
|
|
Distance from the nearest station
|
(iii) Perform r experiments (r>1) using the Monte Carlo algorithm to calculate the scale of farmland conversion in the non-sampling group S2 of the rth trial:
 (2)
(2)
Further perform a multiple regression analysis on the characteristics of the farm households of the sample object S using:
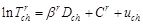 (3)
(3)
After the rth test, the mean (harmonic mean) μ of the characterization index can be found from:
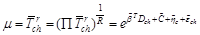 (4)
(4)
4 Results
Based on farmland conversion spatial datasets, we used the ELL model to construct multiple linear regression equations, which passed a precision test that included 12 factors such as farmland inflow scale and outflow scale, to extrapolate the trend of peasant household sample data. Finally, we calculated the scale and direction of the North China Plain farmland conversion (these two characterization indicators are shown in Figure 2).

Figure 2 Inflow scale and outflow scale of farmland conversion in the North China Plain
There were large differences in the scale of farmland conversion inflow in the North China Plain. It was mainly located in the northern part of Jiangsu, the northern part of Shandong, the border between Shandong province and Hebei province, and the border of Henan province, Shandong province, and Hebei province. The conversion trend of the inflow scale showed that it was reduced from the southeast region to the northwest region. The areas with outflow of farmland were mainly in Jiangsu province and Anhui province. The inflow and outflow trends in the northern part of Shandong province were both obvious. In general, the farmland conversion outflow scale decreased from the south to the north.
Author Contributions
Deng, X. Z. designed the algorithms of dataset; Chen, D. D contributed to the data processing and analysis; Jin, G. designed the algorithms and model; Dong, Y. and Chen, K. wrote the data paper.
References
[1] Jin, G., Deng, X. Z., Chen, D. D., et al. Trends and spatial patterns of land conversions in the North China Plain [J]. Resources Science, 2016, 38(8): 1515-1524.
[2] Jia, H. S., Zhang, J. F. The analysis of the gray land market in the land allocation system [J]. China Soft Science, 2006(3): 42-49.
[3] Hu, C. Z. Meditation and policy recommendation on the amelioration of the land banking system [J]. China Land Science, 2010, 24(3): 4-7.
[4] Wu, W. B., Tang, H. J., Yang, P., et al. Model-based assessment of food security at a global scale [J]. Acta Geographica Sinica, 2010, 65(8): 907-918.
[5] Jin, G., Deng, X. Z., Chen, D. D., et al. Dataset of farmland conversion in 456 counties in the North China Plain (2010) [DB/OL]. Global Change Research Data Publishing & Repository, 2018. DOI: 10.3974/geodb. 2018.03.05.V1.
[6] GCdataPR Editorial Office. GCdataPR Data sharing policy [OL]. DOI: 10.3974/dp.policy.2014.05 (Updated 2017).
[7] Jin, G., Li, Z., Wang, Z., et al. Impact of land-use induced changes on agricultural productivity in the Huang-Huai-Hai River basin [J]. Physics and Chemistry of the Earth, 2015(79-82): 86-92
[8] Elbers, C., Lanjouw, J., Lanjouw, P. Micro level estimation of poverty and inequality [J]. Econometrica, 2003, 71(1): 355-364.
[9] Emwanu, T., Hoogeveen, J. G., Okwi, P. O. Updating poverty maps with panel data [J]. World Development, 2006, 34(12): 2076-2088.