Dataset Development on Moisture Sources of
Increased Precipitation in the Qinghai-Xizang Plateau (1979?C2013)
Zhang, C.
Key Laboratory of Land
Surface Pattern and Simulation, Institute of Geographic Sciences and Natural
Resources Research,
Chinese Academy of Sciences, Beijing 100101, China
Abstract: Climate change in the
Qinghai-Xizang Plateau has been a focus of international scientific research.
From 1979 to 2013, the plateau??s precipitation showed a gradually increasing
trend, especially in the central and western parts of the plateau. Although
precipitation station data is scarce in this region, simulated data, satellite
data, and indirect observational data (such as lake area and forest greening)
all indicate that the increasing in precipitation is truly happened. So where
does the plateau??s increasing precipitation come from? The authors identified the
areas with significant precipitation increase (covering about 84.7??104
km2) through precipitation trend analysis, then tracked the moisture
sources for precipitation in this area using a numerical model. The model used
ERA-Interim reanalysis data, the precipitation product by CMA (China
Meteorological Administration),
and GLDAS (Global Land Data Assimilation Systems) evaporation as data drivers,
and set up comparative experiments for validation, ultimately generating annual
and rainy season monthly moisture source data for the increased precipitation on
the plateau. This dataset includes: (1) geographical extent of the study area;
(2) annual and rainy season monthly moisture source data with a spatial
resolution of 1.5????1.5??; (3) precipitation data and rainy season monthly precipitation
data from 1979 to 2013. The dataset is archived in .shp, .nc, and .xlsx
formats, consisting of 13 data files with a total data size of 46.5 MB
(compressed into 1 file, 16.9 MB).
Keywords: Qinghai-Xizang Plateau;
climate change; precipitation; moisture source
DOI: https://doi.org/10.3974/geodp.2024.04.07
CSTR: https://cstr.escience.org.cn/CSTR:20146.14.2024.04.07
Dataset Availability Statement:
The dataset supporting this paper was published and is accessible through
the Digital Journal of Global Change Data Repository at: https://doi.org/10.3974/geodb.2024.08.02.V1 or
https://cstr.escience.org.cn/CSTR:20146.11.2024.08.02.V1.
1 Introduction
The
Qinghai-Xizang Plateau, known as the world??s ??Third Pole??, exerts great
influence on the climate of East Asia and the Northern Hemisphere.
Environmental changes in the Qinghai-Xizang Plateau have also garnered
attention from numerous scientists worldwide[1?C3]. Existing research
indicates that over the past few decades, the Qinghai-Xizang Plateau has
experienced rapid warming and overall moistening[3]. Although
precipitation changes in the Qinghai-Xizang Plateau exhibit considerable
spatial and temporal variability, various sources of surface observational data
(station precipitation, lake expansion, forest greening, etc.) and satellite
data all support an overall increasing trend in plateau precipitation[1,4,5].
Generally,
precipitation requires three essential conditions: moisture source (surface
evaporation), transport pathway, and atmospheric uplift[6]. Among
these, the most perplexing is the source of water vapor that produces
precipitation[7]. The increasing in precipitation in the
Qinghai-Xizang Plateau indicates that more evaporated water vapor is
participating in precipitation formation, leading to increased precipitation
amounts. This water vapor may originate from within the Qinghai-Xizang Plateau
(e.g., glacier melting, enhanced evaporation leading to intensified internal
hydrological circulation)[8], from outside the plateau (e.g.,
strengthened South Asian monsoon transporting moist Indian Ocean air to the
plateau)[9], or a combination of both. Analyzing
plateau precipitation changes from the perspective of precipitation sources can
further reveal the influence mechanisms of the plateau??s internal hydrological
circulation and large-scale circulation system changes. Based on this, this
study uses the Eulerian moisture tracking numerical model WAM2Layers to trace
the sources of precipitation with marked increase on the Qinghai-Xizang Plateau
from 1979 to 2013, generating annual and rainy season monthly moisture source
data for precipitation on the plateau, providing a data foundation for studying
the mechanisms of plateau precipitation changes.
2 Metadata of the Dataset
The metadata of moisture source simulating dataset on
increased precipitation area in the Tibetan Plateau (1979?C2013) is summarized
in Table 1. It includes the dataset full name, short name, authors, year of the
dataset, temporal resolution, spatial resolution, data format, data size, data
files, data publisher, and data sharing policy, etc.
3 Methods
3.1 Model and Algorithm
This
study uses the WAM (Water Accounting Model)[12,13] to trace the
moisture sources of precipitation on
the plateau. WAM is a numerical moisture tracking model based on the
Eulerian
framework. It can not only forward-track the destination of water vapor but
also backward-track its source. The basic equation of WAM is the atmospheric
water balance equation:
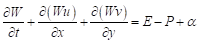 (1)
(1)
where W represents the precipitable water in the vertical air column; u
and v represent the zonal (x) and meridional (y) wind
speeds weighted by water vapor mass, respectively; E is the evaporation; P
is the precipitation; ?? is the
residual term, because when using assimilated data or multi-source data, the
water balance equation usually cannot be completely closed, and this term is
needed to balance the equation. Similarly, water vapor from a
Table 1 Metadata summary of Moisture Source_IPTP
|
Items
|
Description
|
|
Dataset full
name
|
Moisture source
simulating dataset on increased precipitation area in the Tibetan Plateau
(1979?C2013)
|
|
Dataset short
name
|
MoistureSource_IPTP
|
|
Authors
|
Zhang, C.,
Institute of Geographic Sciences and Natural Resources Research, Chinese
Academy of Sciences, zhangchi@igsnrr.ac.cn
Tang, Q. H., Institute of Geographic
Sciences and Natural Resources Research, Chinese Academy of Sciences,
tangqh@igsnrr.ac.cn
Huang, J. C., Institute of Geographic
Sciences and Natural Resources Research, Chinese Academy of Sciences,
huangjc@igsnrr.ac.cn
Xu, X. M.,
Institute of Geographic Sciences and Natural Resources Research, Chinese
Academy of Sciences, xuxm@igsnrr.ac.cn
Gaffney, P. P. J.,
Institute of Geographic Sciences and Natural Resources Research, Chinese
Academy of Sciences, gafppj@igsnrr.ac.cn
Zhou, Y. Y.,
Institute of Geographic Sciences and Natural Resources Research, Chinese
Academy of Sciences, zhouyy@igsnrr.ac.cn
|
|
Geographical
region
|
Central-western
Qinghai-Xizang Plateau
|
|
Year
|
1979?C2016
|
|
Temporal
resolution
|
Annual, monthly
|
|
Spatial
resolution
|
1.5????1.5??
|
|
Data format
|
.nc, .xlsx, .shp
|
|
|
|
Data size
|
16.9 MB??after
compression??
|
|
|
|
Data files
|
the study area,
annual precipitation and monthly precipitation during the rainy season in the
study area, moisture sources for precipitation in the study area
|
|
Foundations
|
National Natural
Science Foundation of China (U2243226); China
Scholarship Council (202310490002)
|
|
Data publisher
|
Global Change Research Data Publishing & Repository,
http://www.geodoi.ac.cn
|
|
Address
|
No. 11A, Datun
Road, Chaoyang District, Beijing 100101, China
|
|
Data sharing
policy
|
(1) Data are openly available and can be free
downloaded via the Internet; (2) End users are encouraged to use Data subject to citation; (3) Users,
who are by definition also value-added service providers, are welcome to
redistribute Data subject to
written permission from the GCdataPR Editorial Office and the issuance of a Data redistribution license; and (4)
If Data are used to compile new
datasets, the ??ten per cent principal?? should be followed such that Data records utilized should not
surpass 10% of the new dataset contents, while sources should be clearly
noted in suitable places in the new dataset[7]
|
|
Communication
and searchable system
|
DOI, CSTR, Crossref, DCI, CSCD, CNKI,
SciEngine, WDS, GEOSS, PubScholar, CKRSC
|
specific
source region ?? satisfies the same atmospheric water balance equation:
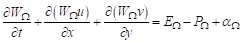 (2)
(2)
From the
equation, it can be seen that WAM is a single-layer two-dimensional model. Its
moisture tracking algorithm is as follows: consider the inverse process of
precipitation, that is, the precipitation P0
in the target area (central-western plateau) during a specific time period
returned to the atmosphere as ??tagged water??, and then flows back along the
time axis and water vapor transport direction to the initial surface
evaporation source. When P0 enters the atmosphere, it follows
the full mixing assumption, meaning that the tagged water is fully mixed with
the total water vapor in the air column at that time. Then the tagged water continuously
enters the surrounding grid points through horizontal moisture transport and is
again fully mixed with the water vapor in the air column where it is located.
At a specific time point, if there is an evaporation e at grid point A,
and the proportion of tagged water to total water vapor in that air column is r,
this means that e??r of the
evaporated water entering the atmosphere from point A will eventually form
precipitation in the target area. This part of the water vapor is identified as
the direct precipitation contribution of grid point A to the target area and is
successfully traced back to its source. The tagged water in the air column at
point A needs to be reduced by this amount and continue its ??recycling?? process
until almost all tagged water is traced back to its source.
3.2 Driving Data
The model driving data is divided into two major
categories: atmospheric data and surface flux data. The atmospheric data uses
the ERA-Interim reanalysis data from the European Centre for Medium-Range
Weather Forecasts[14], with a spatial resolution of 1.5????1.5??. It
includes global zonal and meridional wind speeds and atmospheric humidity at 23
pressure levels from 200 to 1,000 hPa every 6 hours, as well as surface
atmospheric pressure. The atmospheric precipitable water W and horizontal water vapor flux Q data are calculated using the following equations:
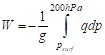 (3)
(3)
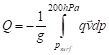 (4)
(4)
where g is the gravitational acceleration, q
is the specific humidity,  is the
horizontal wind vector, p is the surface atmospheric pressure.
is the
horizontal wind vector, p is the surface atmospheric pressure.
Surface data includes surface evapotranspiration and
precipitation. Land evapotranspiration uses output data from the GLDAS land
surface model CLM (Community Land Model).
This data has a temporal resolution of 3 hours and a spatial resolution of
1????1??, and has undergone rigorous evaluation on the plateau[15].
Ocean evaporation uses ERA-Interim model data, with a temporal and spatial
resolution of 3 hours and 1.5????1.5??, respectively.
For precipitation on the plateau, authors use the
precipitation product from the National Meteorological Information Center of the
China Meteorological Administration (CMA)?? the China Surface Daily
Precipitation Dataset at a 0.5????0.5?? Grid (V2.0)[16]. This dataset
originates from daily precipitation records of 2,472 national ground
meteorological stations in China since 1961, which have undergone quality
control. It uses the thin-plate smoothing spline method for grid interpolation,
considers the influence of elevation, and is widely used in China. The study
uses the CMA precipitation data as a benchmark, first upscaling it spatially to the ERA-Interim 1.5????1.5??
grid, then comparing it with ERA-Interim precipitation on a monthly scale to
obtain correction parameters, which are then used to scale the ERA-Interim
3-hour precipitation data. All driving data needs to be unified to a temporal
and spatial resolution of half-hour and 1.5????1.5?? through methods such as time
averaging and spatiotemporal linear interpolation.
3.3 Simulation Experiment Description
The study traced the moisture sources of annual
precipitation and rainy season monthly precipitation in areas of significant
precipitation increasing in the Qinghai-Xizang Plateau from 1979 to 2013. The
annual-scale moisture tracing experiment starts from the last day of each year,
from December 31, and traces back to January 1 at the beginning of the year, repeating
this process for 35 years. The rainy season is defined as May to September each
year, with tracing done on a monthly basis. Because monthly precipitation may
originate from surface evaporation in the previous month, the experiment traces
back an additional month to ensure that the vast majority of precipitation
moisture can be tracked. The annual precipitation moisture tracing also faces
the issue of January precipitation originating from surface evaporation in December of the previous
year. However, because the amount of precipitation in January is small and has
a weak impact on annual-scale precipitation, no additional tracing is performed[9].
4 Data Results and Validation
4.1 Data Composition
The dataset consists of 13 data files, including: (1) geographical
extent of the study area (in .shp format); (2) precipitation data for the study
area from 1979 to 2013 and rainy season monthly precipitation data (in .xlsx
format); (3) simulated moisture source data on annual and rainy season monthly
scales from 1979 to 2013, with a spatial resolution of 1.5????1.5?? (in .nc
format).
4.2 Data Results
Zhang et al.
(2017) identified the central-western regions of the plateau as having the most
significant increase in precipitation during the period 1979?C2013 through
linear trend analysis of the CMA precipitation data (Figure 1)[9].
Tracing the precipitation source of the extreme regions with increased
precipitation on the plateau can effectively represent the overall moisture
source status of the plateau, and then analyze and attribute the trend of
plateau moisture change from the perspective of moisture source changes. The
rainy season precipitation in the central-western plateau accounts for about
90.6% of the annual precipitation, essentially representing the annual
precipitation. The climatological average distribution of moisture sources for
annual and rainy season precipitation is shown in Figure 1. The spatial
patterns of both are similar: the northwestern moisture mainly comes from the
Eurasian continent, the western moisture mainly from the Mediterranean-Black
Sea-Caspian Sea and the two gulf regions, while the southern moisture is mainly
from the direction of the Indian Ocean, transported to the plateau through the
Indian monsoon. It can also be observed that the central-western plateau and
its adjacent areas in the west and south are moisture sources with high
contribution intensity, representing an important source area for precipitation.
|
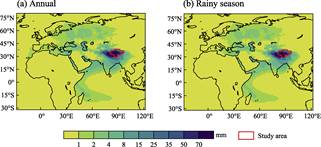
Figure 1 Distribution maps of
annual average and rainy season average moisture source contributions
|
The
moisture sources for the precipitation in the driest and wettest years selected
from 1979?C2013 (1984 with 219 mm and 2008 with 420 mm respectively) are
displayed in Figure 2. Comparison shows that the difference in moisture
contribution between the wettest and driest years in the Eurasian continent is
mainly reflected in the spatial pattern. There is no significant difference in
intensity in this area. The intensity difference is mainly reflected in the
plateau and the region south of it to the western Indian Ocean. The significant
differences
in moisture contribution from these two regions caused significant differences
in precipitation in the target study area. Similarly, analyzing the differences in the distribution of moisture sources during the rainy season between
the driest and wettest years (Figure 2), the intensity of moisture contribution
from source regions in the wet year is stronger than in the dry year, except in the Eurasian continent. This
difference is particularly significant in the local study area, its
southwestern adjacent areas, and the western Indian Ocean.
|
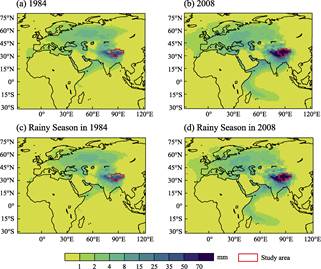
Figure
2 Distribution maps of moisture source
contributions for annual precipitation and rainy season precipitation in the
driest year (1984) and the wettest year (2008)
|
4.3 Data Validation
The annual-scale moisture tracking experiment shows that
the average tracking rate over 35 years was 97.6%, meaning 97.6% of the
precipitation water was tracked. In the monthly-scale experiment, the average tracking rate was
about 97% which indicates
that the experiment successfully traced the vast majority of precipitation in the study
area to its surface evaporation sources. To verify the reliability of the
results, Zhang et al. (2017)
conducted a comparative experiment[9]. They used another set of atmospheric
reanalysis data, namely the NCEP2 (National Centers for Environmental Prediction?CDepartment
of Energy Reanalysis-II) dataset developed jointly by the National Centers for
Environmental Prediction (NCEP) and the Department of Energy (DOE). NCEP2 has a
spatial resolution of 2.5????2.5??, which is lower than ERA-Interim; it also has
only 10 vertical atmospheric layers in the troposphere, far fewer than
ERA-Interim. The auxiliary experiment presented consistent conclusions with the
main experiment, including[9]: (1) climatologically, the westerlies
and the Indian summer monsoon are the main sources of moisture to precipitation
on the plateau; (2) the continuous increasing in precipitation in the
Qinghai-Xizang Plateau is mainly attributed to two factors, the enhancement of
local moisture recycling on the plateau and the increase in moisture transport
from the Indian monsoon. These two key conclusions are not affected by the
uncertainty of input data, further confirming the robustness of the research results.
5 Discussion and Conclusion
There is a consensus that the precipitation in the
Qinghai-Xizang Plateau has shown an overall increasing trend in recent decades[1,3].
This study used the CMA precipitation and the numerical model WAM to track the
moisture sources in areas of significant precipitation increase in the
Qinghai-Xizang Plateau. The research ultimately constructed a simulated dataset
of moisture sources for the increased precipitation in the Qinghai-Xizang
Plateau, demonstrating the contribution of surface evaporation sources from
various global regions to precipitation on the plateau, as well as their
spatial and temporal patterns. The dataset simulation used multi-source data as
model inputs, integrating ERA-Interim reanalysis data, the CMA precipitation,
and GLDAS model evaporation. The tracking model, based on strict physical
processes and water balance equations, performed calculations at a temporal resolution
of 0.5 hours and a spatial resolution of 1.5????1.5??. The final precipitation
tracking rates were 97.6% for annual precipitation and 97.0% for monthly
precipitation on average. This indicates that the model successfully traced the
vast majority of precipitation back to surface evaporation sources, thereby
ensuring the usability of the data. Furthermore, the accuracy of the data was
strongly guaranteed through verification by setting up comparative experiments.
This dataset fills a critical gap in the study of
precipitation in the Qinghai-Xizang Plateau, laying a solid foundation for a deeper
understanding of the complex water cycle processes in the region and their
mechanisms of change. It holds multifaceted research value, such as precisely
quantifying the proportion of oceanic and terrestrial contributions to plateau precipitation, systematically
studying changes in local hydrological cycles, and revealing patterns of
monthly, interannual, and trend changes in moisture transport and contribution.
Through in-depth analysis of precipitation characteristics in dry and wet
years, this dataset helps predict and respond to extreme climate events. These
applications have significant scientific and practical implications for
advancing climate and hydrological research in the Qinghai-Xizang Plateau and
promoting sustainable regional development.
Conflicts of Interest
The author declares no conflicts of interest.
References
[1]
Chen, D. L., Xu, B. Q., Yao, T.
D., et al. Assessment of past,
present and future environmental changes on the Tibetan Plateau [J]. Chinese Science Bulletin, 2015, 60(32):
3025?C3035.
[2]
Yao, T., Thompson, L., Yang,
W., et al. Different glacier status
with atmospheric circulations in Tibetan Plateau and surroundings [J]. Nature Climate Change, 2012, 2(9):
663?C667.
[3]
Yang, K., Ye, B., Zhou, D., et al. Response of hydrological cycle to
recent climate changes in the Tibetan Plateau [J]. Climatic Change, 2011, 109: 517?C534.
[4]
Lei, Y., Yang, K. The cause of
rapid lake expansion in the Tibetan Plateau: climate wetting or warming? [J]. Wiley Interdisciplinary Reviews:
Water, 2017, 4(6): e1236.
[5]
Zhang, G., Zhang, Y., Dong, J.,
et al. Green-up dates in the Tibetan
Plateau have continuously advanced from 1982 to 2011 [J]. Proceedings of the National Academy of Sciences, 2013, 110(11):
4309?C4314.
[6]
Gustafsson, M., Rayner, D.,
Chen, D. Extreme rainfall events in southern Sweden: where does the moisture
come from? [J]. Tellus A:
Dynamic Meteorology and Oceanography, 2010, 62(5): 605?C616.
[7]
Stohl, A., James, P. A
Lagrangian analysis of the atmospheric branch of the global water cycle. part
I: method description, validation, and demonstration for the August 2002
flooding in central Europe [J]. Journal
of Hydrometeorology, 2004, 5(4): 656?C678.
[8]
An, W. L., Hou, S. G., Zhang,
Q., et al. Enhanced recent local
moisture recycling on the northwestern Tibetan Plateau deduced from ice core
deuterium excess records [J]. Journal of
Geophysical Research: Atmospheres, 2017, 122(23):
12541?C12556.
[9]
Zhang, C., Tang, Q. H., Chen,
D. L. Recent changes in the moisture source of precipitation over the Tibetan
Plateau [J]. Journal of Climate,
2017, 30: 1807?C1819.
[10]
Zhang, C., Tang, Q. H., Huang,
J. C., et al. Moisture source simulating
dataset on increased preci-pitation area in the Tibetan Plateau (1979?C2013)
[J/DB/OL]. Digital Journal of Global Change DataRepository, 2024. https://doi.org/10.3974/geodb.2024.08.02.V1. https://cstr.escience.org.cn/CSTR:20146.11.2024.08.02.V1.
[11] GCdataPR Editorial Office. GCdataPR data sharing policy [OL].
https://doi.org/10.3974/dp.policy.2014.05 (Updated 2017).
[12] van der Ent, R. J., Savenije, H. H. G. Length and time scales of
atmospheric moisture recycling [J]. Atmospheric
Chemistry and Physics, 2011, 11(5): 1853?C1863.
[13] van der Ent, R. J., Savenije, H. H. G., Schaefli, B., et al. Origin and fate of atmospheric
moisture over continents [J]. Water
Resources Research, 2010, 46(9): W09525.
[14] Dee, D. P., Uppala, S. M., Simmons, A. J., et al. The ERA-Interim reanalysis: configuration and performance of
the data assimilation system [J]. Quarterly
Journal of the Royal Meteorological Society, 2011, 137: 553?C597.
[15]
Gao, Y. H., Leung, L. R., Zhang, Y. Changes in moisture flux over the Tibetan Plateau during
1979?C2011 and possible mechanisms [J]. Journal
of Climate, 2015, 28(10): 4185?C4197.
[16] Zhao, Y. F., Zhu, J., Xu, Y. Establishment and assessment of the
grid precipitation datasets in China for recent 50 years [J]. Journal of the Meteorological Sciences,
2014, 34(4): 414?C420.