Variation of Soil Temperature and Its Relationship
with the Environment in Nagqu, Tibet
Yang, H. B.1 Yu, X. D.1 Fu, H. M.2 Li, H. T.1 Zhao, J. L.1* Xu, W.1
1. Elion Ecological Restoration Co. LTD, Beijing 100022,
China;
2. Beijing Center for Physical and Chemical Analysis,
Beijing 100089, China
Abstract: Based on soil temperature data of 0?C60
cm at 10 cm interval monitored by the IST (IST. Hrgc-16s), the vertical
variation characteristics of soil temperature were analyzed. and Then meteorological
factors, including air temperature, humidity, atmosphere pressure, wind speed,
rainfall, cumulative solar radiation and other indicators obtained by the
Tianqi weather station (WS00G10A) from June 2017 to November 2019, were used to
explore its relationship between soil temperature using the correlation method.
The results showed that: (1) the soil temperature fluctuated between -15 ??C and 17.5 ??C in Nagqu region, Tibet, and the soil surface
temperature changed significantly compared with the deep layer. (2) The diurnal
variation of soil temperature in 0-30
cm was obvious, and had a distinct period of oscillation. However, the soil
temperature in the 30-60 cm layer had little change, peak and valley value lagged behind
by about 1 h with each 10-cm soil depth increased. The fluctuation of day and
night temperature showed the greatest difference in special months,
and the largest difference was in winter. (3) The annual average value of soil
temperature and accumulated soil temperature showed an increasing trend firstly,
then decreased with the increase of soil depth, and reached the maximum value
of 4.27 ??C and 1,557 ??C at the soil depth of 30 cm. (4) Soil temperature (0 cm)
had a significant response to the changes of air temperature, humidity,
atmospheric pressure, rainfall and cumulative solar radiation intensity, with
correlation coefficient of 98%, 91%, 84%, 75%, 72%, respectively. The
experimental results revealed the law of soil temperature variation in Nagqu
region, which laying a foundation for discussing plant growth and the
relationship between soil and environment in the northern Tibetan plateau.
Keywords: soil temperature;
meteorological factors; correlation analysis;
Nagqu region
Dataset Available
Statement:
1
Introduction
Tibetan Plateau, the highest plateau in the world, has
different climatic conditions from other regions. The climate in this region is
strong solar radiation, and long sunshine hours, low air temperature and large
temperature difference between day and night, cold and dry in winter, cool and
rainy in summer[1]. Tibet??s
unique and stable ??micro?? environment has also been altered as global climate
keeps on changing, climate change is more severe[2-3], The average annual temperature of the Tibetan
Plateau increases 0.026 ??C per year in recent years[4], and it
is far higher than the global air temperature growth rate. Soil temperature is
one of the key variables affecting many important physical, chemical and
biochemical processes in the soil[5-6], which determines soil quality and affects the
nutrient utilization rate and plant growth[7]. Plant roots are sensitive
to extreme changes in soil temperature due to its narrow comfort zone[8],
The heat transfer in the atmosphere and on the ground and the increase of soil
temperature in different degrees can change the balance of soil carbon bank
reserves and nutrients (NPK, etc.), and affect soil fertility[9-10]. Therefore, research on soil temperature is the
basic premise to ensure the heat balance and the normal growth of plant.
As
an ecological fragile region in China, Tibet has always attracted much
attention. It is necessary to study soil temperature change and its response to
environment on different time scales under the trend of climate change in
warmth and humidity. It??s reported that plant roots growth and soil biological
activity mainly depend on soil temperature[7,11-12]. The phenomenon in the Nagqu region such as
rain and hail in summer, dry and wind in winter or spring, strong ultraviolet
rays uneven exposure lead to great differences in climate and soil properties
in different regions or even in the same region. In addition, many variables
such as the vast territory and different landform and physiognomy lead to
different soil temperature variation patterns. This paper focuses on the
central and eastern region of Nagqu, where a weather station and a temperature
monitoring station were established. Based on previous studies, the vertical
and instantaneous changes of soil temperature in recent years in Nagqu were
analyzed on other levels, and to find out the time nodes of soil temperature
affected by environmental factors. Therefore, soil temperature and
meteorological data in the past two years were usually used to clarify the characteristics
of soil temperature variation and determine the correlation of meteorological
factors.
2 Metadata of the Dataset
3 Methods
3.1
Study Area
The experiment site was located in the northwest of Nagqu county in Nagqu
region (central coordinates: 31??33¢49²N, 116??00¢37²E). It is about 30 km away from Nagqu county and
close to the Beijing-Tibet highway, with convenient transportation.
Nagqu belongs to the
plateau subfrigid zone monsoon sub-humid climate zone and has cold, low oxygen
and dry climate. There are about 100 windy days in one year, and it has an
average annual temperature of -2.2 ??C, the coldest
temperature can reach -40 ??C??the annual sunshine
hours are more than 2,886 hours, It receives 400 mm of
annual precipitation, and has warm climate from May to September. From October
to May of next year is the period of snow and soil freezing. The annual growing
season is about 100 days.
Table 1 Metadata summary of the dataset
|
Items
|
Description
|
|
Dataset full name
|
|
|
Dataset short name
|
SoilTem_MeteoFac_Nagqu_2017-2019
|
|
Authors
|
Yang, H. B., Elion Ecological
restoration Co. LTD, 502952735@qq.com
Yu, X. D., Elion Ecological
restoration Co. LTD, yuxiaodan2018@163.com
Fu, H. M. 0000-0002-0245-1134,
Beijing center for physical and chemical analysis, dena1988@sina.com
Li, H. T., Elion Ecological
restoration Co. LTD, lihuiting@elion. com.cn
Zhao, J. L., Elion Ecological
restoration Co. LTD, zhaojinling@elion. com.cn
Xu, W., Elion Ecological
restoration Co. LTD, xuweicuc@gmail. com
|
|
Geographical region
|
Nagqu, Tibet Year From June
2017 to September 2019
|
|
Data format
|
.xlsx Data size 2.67 MB (after compression)
|
|
Data files
|
(1) Hourly, daily, and monthly
soil temperature data for different soil depths (Tab.1-Tab.3);
(2) Soil temperature
characteristics at different soil depths (Tab.4)
(3) Soil temperature
characteristics data of different soil depths hourly, daily and monthly meteorological
data (Tab.5-Tab.7)
(4) Correlation coefficient
data of soil temperature and meteorological elements at different soil depths
(Tab.8)
|
|
Foundations
|
Ministry of Science and
Technology of P. R. China (2017YFC0506800, 2016YFC0500708); National Natural
Science Foundation of China (41807105)
|
|
Data publisher
|
Global Change Research Data
Publishing & Repository, http://www.geodoi.ac.cn
|
|
Address
|
No. 11A Datun Road, Chaoyang
District, Beijing 100101, China
|
|
Data sharing policy
|
Data from
the Global Change Research Data Publishing & Repository includes metadata, datasets (in the Digital Journal of Global Change Data Repository), and
publications (in the Journal of Global Change Data & Discovery). Data sharing policy includes: (1) Data
are openly available and can be free downloaded via the Internet; (2) End
users are encouraged to use Data subject to citation; (3)
Users, who are by definition also value-added service providers, are welcome
to redistribute Data subject to written permission from the GCdataPR
Editorial Office and the issuance of a Data redistribution license; and (4)
If Data
are used to compile new datasets, the ??ten per cent principal?? should be
followed such that Data records utilized should not
surpass 10% of the new dataset contents, while sources should be clearly
noted in suitable places in the new dataset[14]
|
|
Communication and
searchable system
|
DOI, DCI, CSCD, WDS/ISC, GEOSS,
China GEOSS, Crossref
|
3.2 Data Collection and Processing
Data
observation period: From June 2017 to September 2019.
Soil
environment monitoring method: IST. HRGC-16s. Temperature
and humidity probes were installed every 10 cm depth. From the surface, and the
probes were installed laterally. Monitoring frequency was once per hour.
Monitoring depth of soil temperature was 0-60 cm at 10
cm interval.
Atmospheric
environment monitoring method: Tianqi meteorological station (WS00G10A) was set
at the height of 2 m in the center of the test area on the open space without
any obstruction, and monitored once per hour. Monitoring indicators include air
temperature, relative humidity, atmospheric pressure, wind speed, wind direction,
rainfall, and solar radiation.
Data were
analyzed by SAS 8.0 and SPSS 19.0 software system.
4 Results and
Analysis
4.1 Characteristics of
Annual Variation of Soil Temperature in Different Depth
4.1.1 Vertical Variation of Soil Temperature
Table 2 showed the temperature difference, annual
cumulative temperature, average, maximum and minimum values of soil temperature
in each layer from June 2017 to September 2019. The temperature difference
decreased with the increase of soil depth, which showed significant differences
from 0 to 40 cm (P<0.05), and tended to be stable under 40 cm. The
mean value increased firstly and decreased with the increase of soil depth,
finally tended to balance. The average temperature of 30 cm soil layer was significantly
higher than that of 0-20 cm soil (P<0.05). There was no
difference from 30 to 60 cm soil layers. With the increase of depth, the
accumulated temperature also increased firstly then decreased, and finally
tended to be stable, reaching the maximum in the 30 cm soil layer. The
fluctuation range of maximum and minimum soil temperature decreased with the
increase of soil depth. The results suggested that 30 cm soil layer was a
temperature turning point and had a high and stable temperature environment.
4.1.2 Temporal Variation
of Soil Temperature
The trend in different layers of soil temperature was
similarly (Figure 1). The total fluctuation of soil temperature was similar to
the periodic change of sine or cosine, it was high in summer, low in winter,
and the amplitude was about 11.3 ??C. The temperature difference in soil
layers changed a little and the volatility was low from April to October.
However, the fluctuation of all soil layers was severe from October to March of
the next year, especially the soil surface, but the fluctuation would decrease
with the increase of soil depth. The soil temperature changed suddenly in
October, dropping rapidly by about 14 ??C, becoming the month with the
greatest variation. From April, the temperature was above 0 ??C and the
soil began to thaw.
Table 2 Analysis of soil temperature differences in
different soil depths
|
Depths
(cm)
|
Temperature
difference (??C)
|
Mean value (??C)
|
Annual
accumulated
temperature (??C)
|
Maximum
(??C)
|
Minimum
(??C)
|
|
0
|
22.36a??0.33
|
1.99d??0.30
|
724.61
|
36.38
|
-24.69
|
|
10
|
8.47b??0.17
|
2.85c??0.27
|
1,040.94
|
29.56
|
-14.44
|
|
20
|
3.52c??0.09
|
3.36bc??0.25
|
1,227.54
|
22.31
|
-11.44
|
|
30
|
1.67d??0.04
|
4.27a??0.24
|
1,557.02
|
19.31
|
-8.94
|
|
40
|
0.89e??0.02
|
3.68ab??0.24
|
1,343.79
|
16.81
|
-8.44
|
|
50
|
0.44e??0.01
|
3.60ab??0.23
|
1,312.32
|
15.31
|
-7.63
|
|
60
|
0.27e??0.01
|
3.66ab??0.21
|
1,336.59
|
14.13
|
-6.69
|
Note: The
temperature difference is the difference between the maximum and minimum daily
temperatures. The mean value is the average soil temperature during the
monitoring period. The maximum and minimum values are the maximum and minimum
daily mean values since the monitoring. Different letters (a, b, c, d, e)
following the data indicate significant differences (P<0.05) in the same column. The results are expressed as mean ??
standard error.
4.2
Diurnal Variation Characteristics of Soil Temperature in Different Depth
January, April, July, October
from 2017 to 2019, taking the months average in different years, were selected to
study the diurnal variation of soil temperature. In order to eliminate the
sharp variation of soil temperature by different weather, the mean value at the
same time every day for a month was calculated. As shown in Figure 2, diurnal variations of soil temperature decreased with soil
depth, remained almost in equilibrium until 30-60 cm, and changed significantly and had the same trend in other
soil layers. Temperature of the soil surface reached the peak first, the second
was that of 10 cm, also showed hysteresis. In special months, the peak value of soil surface appeared at 16:00, the peaks of 10 cm appeared at 17:00, and the peaks of 20 cm all appeared at 19:00. The peak value in soil
surface were 2.9, 15.1, 6.3, 12.4 ºC, the peak value in
10 cm layer were 19.2, 8.8, ?C4.8, 4.3 ºC, and the peak value
in 20 cm layer were 15.5, 5.0, ?C6.0,
1.9 ºC, respectively, in the four selected months.
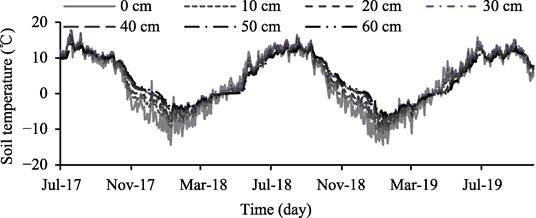
Figure 1 Variation trend of soil temperature with time in each layer
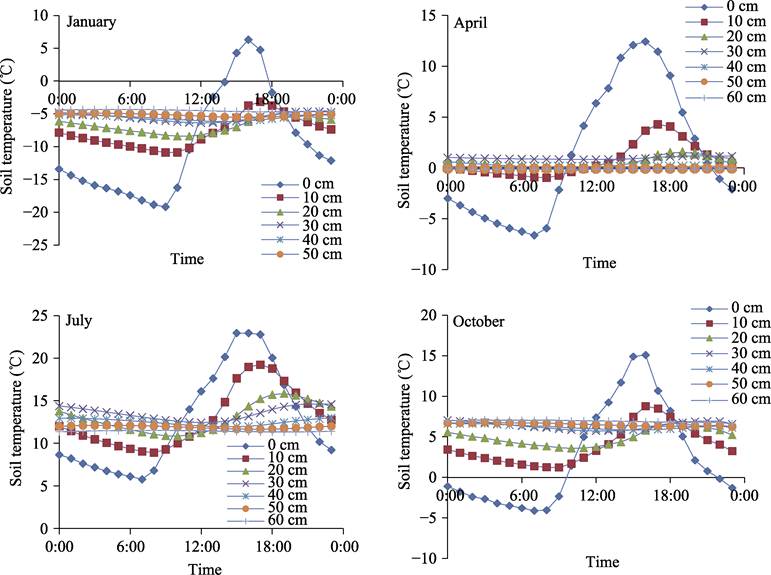
Figure 2 Diurnal variation of soil temperature at different depths
The soil surface temperature also reached the valley value
first, which was the same as the peak value rule. In special months, the valley
values of 0 cm layer appeared at 7:00 in April, July and October, but the
valley value appeared at 9:00 in January. Compared with 0 cm layer, the occurrence time of peaks in 10 cm
layer was delayed by one hour, and the valley value in 20 cm layer was delayed
by two hours. In special months, the valley value in 0 cm layer were 6.1, ?C5.4 , ?C18.7, ?C6.9 ºC, the valley value in
10 cm layer were 9.1, 0.4, ?C11.6, ?C1.1 ºC, and the valley
value in 20 cm layer were 10.8, 2.6,
?C9.4, 0.1 ºC, respectively.
4.3 Relationship Between Soil Temperature and Meteorological Factors
4.3.1 Soil Surface
Temperature and Air Temperature
Surface temperature is an important parameter for the interaction
between atmosphere and soil, and can characterize the surface heat source. As
shown in Figure 3, the fluctuation of
|
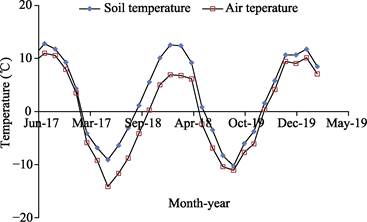
Figure 3 Dynamics of soil surface temperature and air temperature
|
|
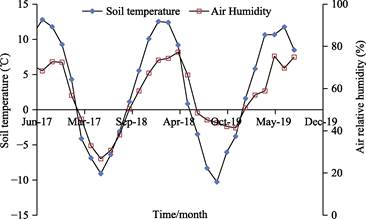
Figure 4 Dynamics of soil surface temperature and air humidity
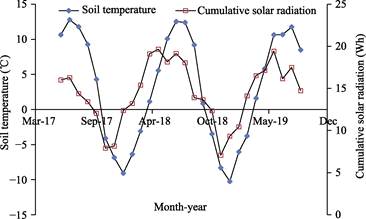
Figure 5 Dynamics of soil surface temperature and cumulative solar radiation
|
the soil and air
temperature was consistent with time, showing a similar trend of sine and cosine.
Soil temperature was slightly higher than air temperature, and the temperature
difference was 1.0-5.5 ºC. From December 2017 to September
2018, the difference between soil and air temperature was large, in the range
of 2.5-5.5 ºC, and the difference in other
months was within 2.5 ºC. By fitting the soil
temperature and air temperature variation curves, the air and soil temperature
amplitude were 12.5 ºC and 10.8 ºC, respectively. Air temperature changes more significantly than soil
temperature. The reason may be
that the dense grass on the surface increases the heat capacity of the soil, or
the surface and deep soil temperature transfer each other, so that led to the
result.
4.3.2 Soil Surface Temperature and Air Humidity
According to Figure
4, air humidity corresponded to soil
temperature. The air humidity was the highest in the summer, which could reach
more than 80%, and the lowest in the winter, about 20%. However, the air
humidity in the winter of 2018 was higher than that the same period in other
years, which may be due to the measures of regular spray. The purpose of this
measure was to investigate the winter survival of the plant.
4.3.3
Soil Surface Temperature and Cumulative Solar Radiation
Figure 5
showed the variations of solar radiation and daily soil temperature over time.
It can be seen that solar radiation and soil temperature showed periodic fluctuation,
the variation range of total radiation is large. Compared with the soil
temperature, the total radiation had some advance, which indicated the change of
soil temperature caused by a certain amount of solar radiation.
4.3.4 Soil Surface Temperature and
Precipitation
It can be
seen from Figure 6 that the rainfall mainly occurred from May to October.
During that period, the fluctuation of monthly rainfall and soil temperature
was consistent
and tended
to be synchronous. From November to April of the following year, the local
rainfall was approximately 0 mm, so it was more accurate to consider the
relationship between rainfall and soil temperature in the growing period
without considering the relationship between rainfall and soil temperature in
this period.
|
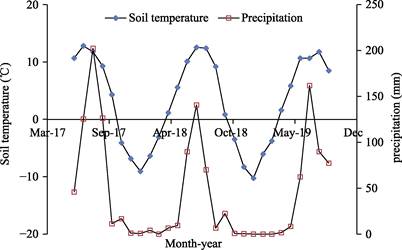
Figure 6 Dynamics of soil surface temperature and precipitation
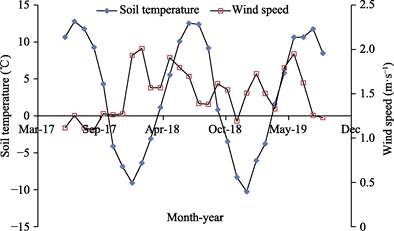
Figure 7 Dynamics of soil surface temperature and wind speed
Figure
8 Dynamics of wind speed and soil surface temperature
in one day
|
4.3.5 Soil Surface Temperature and Wind Speed
Wind speed is a very uncertain factor and varies from
season to season. As shown in Figure 7, wind
speed and soil temperature fluctuated with time, and the wind speed changed
more randomly. However, it can be seen that the soil temperature was high and
the wind speed was low in summer, while the soil temperature was low and the
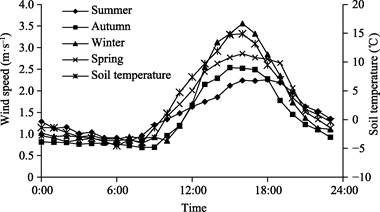
wind speed was high in winter. Figure 8 showed the variation of wind speed at
different moments in four seasons. The wind speed from 0:00 to 11:00 had no
change basically, and maintained at 0.6-1.4
m??s?C1. From 12:00 to 24:00, the wind speed gradually increased and
reached the maximum at 16:00, then gradually decreased with time. The peak wind
speed in winter and spring was about 1 m??s?C1 higher than that in
summer and autumn. Overall, the changes in soil temperature and wind speed in
each season are consistent and synchronous. Therefore, it is reasonable to
consider the daily wind speed and soil temperature, to eliminate the rule covering
caused by the random variation of daily wind speed.
4.3.6 Soil Surface Temperature and Atmosphere
The daily average maximum pressure in Nagqu region was 594
hPa on October 30, 2018, and the minimum was 571 hPa on January 26, 2018 (Figure
9). The local atmospheric pressure was between 571?C594 hPa, and the average
pressure value was 585 hPa, which was 58.5% of the standard atmospheric
pressure. The air pressure was lower in winter and higher in summer, which was
the opposite of inland areas. The change in atmospheric pressure was consistent
with the change of soil temperature.
4.4 The Analysis and Test
of Correlation Between Meteorological Factors and Soil
Temperature
According to correlation analysis (Table 3), air temperature,
humidity, cumulative solar ra-
diation, rainfall and
atmospheric pressure were significantly correlated with soil tempera-
ture, with correlation
coefficients of 98%, 91%,72%, 75% and 84%, respectively. Partial
|
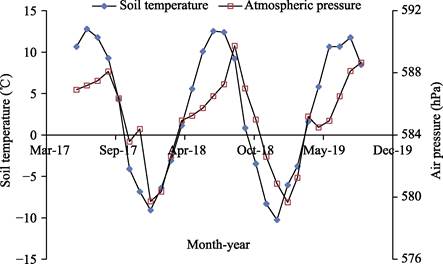
Figure 9 Dynamics of soil surface temperature and atmosphere
Table 3 Correlation coefficients of meteorological factors and soil temperature
|
|
Meteorological
factors
|
Correlation
coefficients
|
Partial correlation coefficients
|
|
Air temperature
|
0.98**
|
0.88**
|
|
Air humidity
|
0.91**
|
-0.01
|
|
Cumulative solar radiation
|
0.72**
|
0.71**
|
|
rainfall
|
0.75**
|
0.47**
|
|
Wind speed
|
-0.21
|
0.30
|
|
Atmosphere
|
0.84**
|
0.42*
|
|
Note: Df=33; *
represents a significant bilateral correlation at the 0.05 level, **
represents a significant bilateral correlation at the 0.01 level.
|
correlation analysis reflects
the linear correlation between two variables separately. It showed that air temperature,
cumulative solar radiation, rainfall and atmospheric pressure were
significantly correlated with soil temperature, with partial correlation
coefficients of 88%, 71%, 47% and 42% respectively, while wind speed and air
humidity were not correlated with soil temperature.
5 Discussion
5.1 The Variation Trend of Soil
Temperature
The results
showed that soil temperature in alpine and high-altitude areas had a similar periodic
trend of sine and cosine, with a maximum amplitude of 15.7 ºC, which is consistent
with the results on soil temperature variation trends in other regions of China[15-18], but
slightly different in oscillation period and amplitude. Qi et al.[19]
monitored 22 stations on the Changtang Plateau, and compared with this paper,
the difference in diurnal and monthly changes was 1.2-1.6 ºC. The
differences may be caused by different time scales of data monitoring,
differences in latitude and longitude or surface vegetation[20].
In January, April, July and October, the soil temperature showed a law of large
difference in winter and small difference in summer, the
main reason is that the sunshine duration is longer in summer than in winter in
Nagqu region, and the energy received by the soil is different. In addition,
the soil type is alpine meadow, with more gravel under the soil, and the
specific heat capacity of the soil is small, leading to a large change in the
day-night temperature. On the spatial scale, the mean temperature of each layer
in soil showed a tendency of increasing first and then decreasing with
increasing soil depth. In four special months, the temperature amplitude of
different soil layers decreased with the increase of depth, and the lag time of
peak-valley variation become longer with the increase of depth, the lag time increased
by about 1 h for every 10 cm increase of depth.
5.2 The Relationship Between Meteorological Factors and Soil Temperature
The correlation coefficient between soil temperature and
air temperature was 98% in Naqu region, In comparison, the correlation
coefficient between air temperature and soil surface temperature in China was
93%[21]. In terms of the
relationship between air and soil temperature, the response of air temperature
was stronger than soil temperature, and the fluctuation was larger, which was
consistent with the results on Alxa[22].
However, Yang et al.[23]
found that the ground temperature change in western China was more intense
than the air temperature, which may be due to the unique climate and complex
topography in alpine and high-altitude areas, and the different
monitoring scales, but
the correlation of air and soil was independent of these factors. Therefore, to get a good relationship,
more in situ monitoring should be set
up to study further the relationship between soil and air temperature in
different time scales. Many
researchers have pointed out that air
temperature is the main reason for the rise of soil temperature[24?C26]. The air temperature and soil temperature are mutually influenced, and
heat is always transferred spontaneously from
the side with high temperature to the side with low temperature. So it
is untenable to say that air temperature is the most important factor affecting
soil temperature[27]. The soil temperature at different depths
had a good correlation with air temperature, which becomes more closely related
to the increase of soil depth[28].
In general, the more precipitation, the higher the air
humidity. In this study, the
correlation coefficients of precipitation, air humidity and soil temperature
were 75% and 91% respectively, showing a significant positive correlation. This
result is supported by some studies, such as Zhao et al.[29], who
concluded that soil temperature and precipitation were significantly positively
correlated at the level of 0.01 in the study of hilly red soil region. It
showed that precipitation was one of the important factors affecting soil
temperature, but the influence level varies in different regions. However, Luo et al.[30]
found that precipitation was not correlated with a ground temperature of
5 cm in the study of Ulan Buh Desert. It may be that the desert has a large
temperature difference between day and night, with intense light and little
precipitation, thus masking the correlation between precipitation and soil
temperature. The results of Meng et al.[31] showed that the influence of
precipitation in Yunnan on soil temperature was mainly manifested in summer,
showing a significant negative correlation. Except for summer, precipitation in
other seasons had little correlation with soil temperature. Zhang et al.[32]
continuously measured the soil temperature in different microhabitats of the
dominant sand-fixing shrub Caragana
community in arid regions, and the results showed that the soil temperature was
mainly affected by precipitation, which significantly reduced the soil
temperature. Because precipitation is an unstable factor, and this paper was
studied on the scale of the whole year, avoiding the result deviation caused by
a short period of research, and need continue to study.
Solar
radiation is the primary source of soil heat[26],
which directly affects soil temperature. The correlation between soil
temperature and solar radiation intensity in Nagqu was 72% (P<0.01). An et al.[33] studied
the mechanism of water and heat transfer and its relationship with
meteorological factors at the soil-gas interface in xi??an arid region, and the
positive correlation was confirmed by the analysis model. Wei et al.[34]
conducted a solar radiation simulation experiment in Fujian province, and
also obtained a significant relationship between solar radiation and soil
temperature, with a correlation coefficient of 62.2%. Therefore, solar
radiation has an essential influence on soil temperature in Tibet.
There
are few studies on the relationship between atmospheric pressure and soil temperature,
especially in the environment of low pressure and high wind in Nagqu. In this
study, the correlation coefficient between atmospheric pressure and soil
temperature was 84%, showing a positive correlation. The main reason was the
height of the underlying surface in Tibet (about 4,500 m). The atmosphere was
the same as the upper air in the inland region, The thin air made the higher
the pressure, the higher the temperature will be[35].
The partial correlation coefficient of the two was 42%, indicating that atmospheric
pressure and soil temperature in the Nagqu area also reached a significant
level without considering other environmental factors. The temperature
increased, and the pressure increased. The correlation between wind speed and
soil temperature is not significant, contrary to the research results of Zhao[29] in Jiangxi province and Yu et al.[36] in Xilinhot, which may be caused by the special environment of
Tibet.
6 Conclusion
Based on the analysis of monitoring data from June 2017 to
September 2019, the conclusions are drawn as follows:
In
terms of time distribution, the soil temperature presented periodic changes in
the form of sine and cosine between -15 ºC and 17.5 ºC, and it changed
abruptly in October, with a rapid decrease of 13.9 ºC. The change of
day-night temperature of soil also showed the change of sine and cosine.
Different soil layers had different peak-valley values at different times. With
every 10 cm increase in soil depth, the lag time increased by about 1 h.
January was the month with the greatest variation in temperature between day
and night. In terms of spatial distribution, the annual mean temperature and
cumulative temperature of soil first increased then decreased with the increase
of depth, and the turning depth was 30 cm. The variation coefficient of
temperature in different soil layers decreased with the increase of depth.
The
order of the influence of meteorological index on soil temperature was air temperature
> air humidity > atmospheric pressure > cumulative solar radiation
> rainfall > wind speed. Among them, air temperature, rainfall, air
humidity, solar radiation and atmospheric pressure were significantly
positively correlated. The correlation coefficients of air temperature, air
humidity, cumulative solar radiation, rainfall and atmospheric pressure were
98%, 91%, 72%, 75% and 84%, respectively.
Author Contributions
Yang, H. B. and Yu, X. D. collated and
analyzed soil and meteorological data. Yang, H. B. wrote the data paper. Li, H.
T. and Zhao, J. L. provided guidance on data analysis verification and article
writing. Fu, H. M., Yu, X. D. and Xu, W. revised and reviewed the draft.
References
[1]
Lin,
Z. Y., Wu, X. D. Climatic regionalization of the Tibetan Plateau [J]. Acta geographica sinica, 1981, 36(1): 22-32.
[2] Du, J., Jian, J., Hong, J. C., et
al. Response of seasonal frozen soil to climate change on Tibet region from
1961 to 2010 [J]. Journal of Glaciology
and Geocryology, 2012, (3): 512-521.
[3] Zhu, B. W., Hu, D. K., Guo, X. N., et al. Ground temperature variation and its forecast in the
daylight greenhouse in Datong of Qinghai [J]. Journal of Arid Meteorology, 2014, 32(5): 765-772.
[4] Chi, Q. A brief analysis of climate change characteristics in
Tibet in the past 45 years [J]. Tibet Science and Technology, 2017, 286(1): 54-59.
[5] Seifert, J. Effect of soil-temperature on nitrification rate [J]. Rostlinna Vyroba, 1978, 24(1): 1-8.
[6] Sierra, J. Nitrogen mineralization and nitrification in a tropical
soil: effects of fluctuating temperature conditions [J]. Soil Biology and Biochemistry, 2002, 34(9): 1219-1226.
[7] Kang, S., Kim, S., Oh, S., et
al. Predicting spatial and temporal patterns of soil temperature based on topography,
surface cover and air temperature [J]. Forest
Ecology and Management, 2000, 136(1/3): 173-184.
[8] Araghi, A, Mousavi-baygi, M., Adamowski, J. Detecting soil temperature
trends in Northeast Iran from 1993 to 2016 [J]. Soil and Tillage Research, 2017, 174: 177-192.
[9] Milcu, A., Lukac, M., Subke, J. A., et al. Biotic carbon feedbacks in a
materially closed soil-vegetation-atmosphere system [J]. Nature Climate Change, 2012, 2(4): 281-284.
[10]
Coucheney, E., Stromgren, M., Lerch, T. Z., et al. Long-term fertilization of a
boreal Norway spruce forest increases the temperature sensitivity of soil
organic carbon mineralization [J]. Ecology
and Evolution, 2013, 3(16): 5177-5188.
[11] Xu, C. S., Xiong, D. C., Deng, F., et
al. The ecophysiological responses of fine-roots Chinese fir (Cunningghhmia
lanceolata) seedling and the associated plants to soil warming [J]. Acta Ecological Sinica, 2017, 37(4):
1232-1243.
[12] Zheng, H. F. Effects of simulated warming on soil enzyme activity and
microbial community structure in an alpine treeline [D]. Chengdu: SiChuan
Agricultural University, 2018.
[13] Yang, H. B., Yu, X. D., Fu, H. M., et
al. Dataset on soil temperature, meteorological factors and their correlation
coefficients in Nagqu, Tibet, China (2017?C2019) [J/DB/OL]. Digital Journal of Global Change Data Repository, 2020. DOI:
10.3974/geodb.2020.03.03.V1.
[14]
GCdataPR Editorial Office. GCdataPR data sharing policy
[OL]. DOI: 10.3974/dp.policy.2014.05 (Updated 2017).
[15] Yang, M. X., Yao, T. D., Ding, Y. J., et al. The diurnal variation of the soil temperature in the
northern part of Tibetan Plateau [J]. Environmental
Science, 1999, 20(3): 5-8.
[16]
Zhao,
Y. Z., Ma, Y. M., Ma, W. Q., et al.
Analysis on the characteristics of soil temperature and moisture variation in
north Tibetan Plateau [J]. Journal
of Glaciology and Geocryology,
2007, 29(4): 578-583.
[17]
Zhao,
W. J., Liu, X. D., Jin, M., et al. Spatio-temporal change
characteristics of soil temperatures and moistures in forest and grass complex
basin in Qilian mountains [J]. Soils, 2018, 50(4): 795?C802.
[18]
Li,
X. R., Zhang, X. L., Liang, B. L., et al.
Diurnal variation of soil temperature and its vertical profiles in summer in
Shenzhen city [J]. Science technology and
engineering, 2008, 8(22): 5996-6000.
[19]
Qi, W., Zhang, Y. L.,
Liu, L. S., et al. Characteristics of soil temperature
variation in core region of Northern Tibetan Plateau in China during 2013-2014 [J]. Geographical Research, 2017, 36(11):
2075-2087.
[20]
Wang,
Q. X., Lv, S. H., Bao, Y., et al.
Characteristics of vegetation change and its relationship with climate factors
in different time-scales on Qinghai-Xizang Plateau [J]. Plateau Meteorology, 2014, 33(2): 301-312.
[21]
Wang,
J. L., Pan, Z. H., Han, G. L., et al.
Variation in ground temperature at a depth of 0 cm and the relationship with
air temperature in China from 1961 to 2010 [J]. Resources Science, 2016, 38(9): 1733-1741.
[22]
Chen,
C., Zhou, G. C. Characteristics of air temperature and ground temperature in
Alxa Left Banner from 1961 to 2010 [J]. Journal
of Natural Resources, 2014, 29(1): 91-103.
[23] Yang, M., Li, W. L., Liu, H. Characteristics
of the climate change in west China in recent 50 years [J]. Journal of Applied meteorological Science,
2010, 21(2): 198-205.
[24] Huang, F. F., Ma, W. Q., Li, M. S., et al. Analysis on response of land
surface temperature on the northern Tibetan Plateau to climate change [J]. Plateau Meteorology, 2016, 35(1): 55-63.
[25] Zhang, H. X. Analysis on variation characteristics
of shallow ground temperature in Weihui in recent 52 years [J]. Journal of Anhui Agricultural Science,
2013, 41(14): 6380-6382.
[26] Du, J., Li, C., Liao, J., et al. Response of climate change on
soil temperature at shallow layers in Lhasa from 1961 to 2005 [J]. Meteorological monthly, 2007, 33(10): 61-67.
[27] Chai, H. M., Liu, Z. J., Gu,
H. M. Discussion on relationship among solar radiation, air temperature and
soil temperature [J]. Journal of North
China Institute of Water Conservancy and Hydroelectric Power, 2003, 24(3):
4-8.
[28] Zhou, B., Chen, P. S., Li, J., et
al. Variation characteristics of surface ground temperature of Liaoning in
spring [J]. Chinese Agricultural Science
Bulletin, 2014, 30(36): 275-280.
[29] Zhao, M. F., Jing, Y., S., Li, J. The characteristics of soil
temperature in peanut &watermelon field and influence of meteorological
factors in hilly red soil areas [J]. Acta
Agriculturae Universitatis Jiangxiensis, 2016, 38(5): 1002-1008.
[30] Luo, F. M., Gao, J.
L., Xin, Z. M., et al.
Characteristics of soil temperature variation and influence factors at
northeastern margin region of Ulan Buh desert, China [J]. Journal of Desert Research, 2019, 39(1): 1-8.
[31] Meng, G. Y., Yu, Y. Responses of soil
temperature in shallow layers to climatic change in Xishuangbanna from 1961 to
2005 [J]. Meteorological Science and
Technology, 2010, 38(3): 316-320.
[32] Zhang, Y. F., Wang, X. P., Hu, R., et al. Effects of shrubs and
precipitation on spatial-temporal variation of soil temperature at the
microhabitats induced by desert shrubs [J].
Journal of Desert Research, 2013, 33(2): 536-542.
[33] An, K. D. Mechanism of heat and water
transfer at the land-atmosphere interface and its effects on the heat and water
flow in vadose zone in an arid region [D]. Xi??an: Chang??an University, 2016.
[34] Wei, S. L., Chen, Z. B., Chen, Z. Q., et al. Simulation of the total solar
radiation over micro-landform and correlation between the solar radiation and
the land surface temperature [J]. Remote
sensing for land and resources, 2017, 29(1): 129-135.
[35]
Liu,
J. Q., Huang, J. T. Relation between temperature dynamic and meteorological
factors in saturated?? unsaturated zone [J]. Ground
water, 2013, 35(2): 21-26.
[36] Yu, L. L., Bai, H. Y., Chen, Y., et al. Relationship between ground
temperature and meteorological factors in Xilinhot [J]. Inner Mongolia science and Technology and economy, 2018, 3: 76-77.