Dataset of National and Provincial
Levels Development Zones in China (2006?C2018)
Nie,
J. X.1,2,3 Liu, H. L.1,2*
1. School of Architecture and Urban Planning, Huazhong
University of Science and Technology, Wuhan 430074, China;
2. Hubei New Urbanization Engineering
Technology Research Center, Wuhan 430074, China;
3. Department of Land Economy, University
of Cambridge, Cambridge, CB3 9EP, UK
Abstract: Development zones
(DZs) are the core spatial tools of China??s economic and industrial layout and
play a key role in supporting long-term economic growth. Based on the catalogue
of China??s development zone in 2006 and 2018 as jointly issued by the National
Development and Reform Commission of the People??s Republic of China and other
government departments, and references from relevant official and online
materials, this paper identifies DZs?? position and scale,
clarifies the change in level and type between 2006
and 2018 (no data was
available for Hong Kong, Macao, and Taiwan), and collects the dataset of
national and provincial levels development zones in China (2006?C2018)
with ArcGIS. This dataset collected the following data: (1) location data
(.shp); (2) attribute data of DZs above the provincial level, including the
name, approved year, approved area, level, type, state, and established year
(.xlsx). The dataset is archived in .xlsx and .shp format and consists of nine
data files with a data size of 10.9 MB (compressed to one file of 444 KB).
Keywords: China; development zones; change; land and space use control; 2006?C2018
DOI: https://doi.org/10.3974/geodp.2022.01.02
CSTR: https://cstr.escience.org.cn/CSTR:20146.14.2022.01.02
Dataset Availability Statement:
The dataset
supporting this paper was published and is accessible through the Digital Journal of
Global Change Data Repository at: https://doi.org/10.3974/geodb.2021.06.03.V1 or
https://cstr.escience.org.cn/CSTR:20146.11.2021.06.03.V1.
1 Introduction
The
establishment of national and provincial development zones to attract foreign
investment and foster high-tech industries is an important spatial tool to
promote economic development in China, and plays a role as a core engine in the
process of economic take-off after the Reform and Opening Up[1].
Therefore, the development zones occupy a crucial position in the government of
territorial space. Over the past few decades, the number of development zones
in China has increased, now covering most of the country. At the same time,
China has changed them from an economic and technological development zone to a
variety of types, and is forming a spatial carrier system to drive diversified industries[2].
Academia has
long paid attention to the setup and development of China??s development zones.
From a spatial perspective, scholars have focused on the spatial and temporal
distribution patterns[3],
location evolution[4], industrial characteristics[5,6],
layout driving factors[7], development efficiency[8], and
other aspects of China??s development zones above the provincial level. Related
studies mostly use kernel density analysis[9],
Ripley??s K-function analysis[10,11], standard elliptic analysis[4],
nearest neighbor distance index[7], and others to explore the
spatial distribution and evolving laws of various development zones in China.
Some scholars have further analysed the driving factors of the distribution of
development zones in different regions using statistical models such as the
geographic detectors[12]. China
promoted the renovation of development zones between 2006 and 2018. The
government department standardised the park catalogue by integrating,
cancelling, merging, and upgrading for older constructions, and creating norms
for new construction. Hence, there have been significant changes in the growth
of the development zones. This shift also reflects a turn in China??s priorities
for land use.
Optimising the
spatial distribution of development zones and rational configuration
development projects is of great significance in the establishment of land and
space use control and territorial space governance systems. This dataset
focuses on the spatial evolution of China??s development zones above the
provincial level. This research can provide strong support for the study of
spatial governance issues, such as the layout trend of development zones,
optimisation of territorial spatial functions, and allocation of natural
resources, and consequently contribute to the formation of a national spatial
governance system, and ease the problems of regional development imbalance and
inadequate spatial efficiency.
2 Metadata of the Dataset
The
metadata of the Dataset of national and provincial
levels development zones in China (2006?C2018)[13] is summarised in Table 1. It includes the full name, short name,
authors, year of the dataset, temporal resolution, data format, data size, data
files, data publisher, and data sharing policy, etc.
3 Methods
3.1 Data Sources
Attribute
data of the development zones above the provincial level in China are derived
from the China Development Zone Audit Announcement Catalogue (2006 edition and
2018 edition)[15,16]. These
catalogues are jointly issued by the National Development and Reform Commission
and several other departments. The data includes the name, approval time,
approved area, and other attribute data of national and provincial development zones[4]. Government documents, news
reports, and other online public data are also used to determine the changing
status of the grade and type of each development zone. It should be noted that
no data was available for Hong Kong, Macao, and Taiwan.
3.2 Data Processing
The geographic coordinates
of development zones can be identified using geographic coding technology[4]. Because the multi-block
development zones are usually located in the same administrative region, they
are set to encompass where the main park lies. Through the
collection of the status change of zones from
official documents, public news, and other online information, the original
grade and type of development zones are classified into different types.
Because of massive mergers and expansion, the scale of the development zone is
constantly changing, so only the final approved scale is provided.
Moreover, scattered public information cannot provide a full list of sources.
The status change of development zones is divided into five types: (1) the
reserved type with the same name and grade, (2) the renamed type with only the
name changed, (3) the upgraded type with the grade rising, (4) the newly
established type, and (5) the revoked type, which is no longer certified or
transformed into other development zones.
Table 1 Metadata summary of the Dataset of
national and provincial levels development zones in China (2006?C2018)
|
Items
|
Description
|
|
Dataset full name
|
Dataset of national and provincial levels development zones in China
(2006?C2018)
|
|
Dataset short
name
|
DevelopmentZonesChina_2006-2018
|
|
Authors
|
Nie, J. X.
AAK-1121-2021, School of Architecture and Urban Planning, Huazhong University
of Science and Technology, njx1991@hust.edu.cn
Liu, H. L.
AAL-5430-2021, School of Architecture and Urban Planning, Huazhong University
of Science and Technology, hl362@hust.edu.cn
|
|
Geographical
region
|
China (There is
no data in Hong Kong, Macao and Taiwan)
|
|
Year
|
2006?C2018
|
|
Temporal
resolution
|
Year
|
|
Data format
|
.xlsx, .shp
|
|
|
|
Data size
|
10.9 MB
(compressed into a file, 444 KB)
|
|
Data files
|
(1) Location data
of the development zones (.shp)
(2) Attribute
data of the development zones (.xlsx)
|
|
Foundation(s)
|
National Natural
Science Foundation of China (D1218006); Ministry of Education of P. R. China
(19GBQY083)
|
|
Data computing environment
|
ArcGIS
|
|
Data publisher
|
Global Change Research Data Publishing & Repository,
http://www.geodoi.ac.cn
|
|
Address
|
No. 11A, Datun
Road, Chaoyang District, Beijing 100101, China
|
|
Data sharing
policy
|
Data from the Global
Change Research Data Publishing & Repository includes metadata, datasets (in the Digital Journal of Global Change Data Repository), and
publications (in the Journal of Global Change Data & Discovery). Data sharing policy includes: (1) Data are openly
available and can be free downloaded via the Internet; (2) End users are
encouraged to use Data subject to citation; (3) Users, who are by definition
also value-added service providers, are welcome to redistribute Data
subject to written permission from the GCdataPR Editorial Office and the
issuance of a Data redistribution license; and (4) If Data are used to
compile new datasets, the ??ten per cent principal?? should be followed such
that Data records utilized should not surpass 10% of the new
dataset contents, while sources should be clearly noted in suitable places in
the new dataset[14]
|
|
Communication and searchable system
|
DOI, CSTR, Crossref, DCI,
CSCD, CNKI, SciEngine, WDS/ISC, GEOSS
|
3.3 Technical Route
To
study the changing distribution pattern of development zones from the
perspective of land and space use control, the development zones above the
provincial level in China in 2006 and 2018 were collected and sorted, and the
spatial coordinates of the development zones were obtained with geo-coding
software, and the location distribution outcome was visualised with the support
of ArcGIS. There are two steps to fully mine the value of dataset to the
dynamics of development zones. First, the spatial and temporal pattern change
of development zones is evaluated according to the number of development zones
and the approved area. Second, the spatial distribution of development zones in
2006 and 2018 was visualised, and the dynamics of the quantitative structure
and spatial location of zones during 2006?C2018 were analysed,
and the law of spatial distribution change was summarised. This technical route
is illustrated in Figure 1.
4 Data Results
|
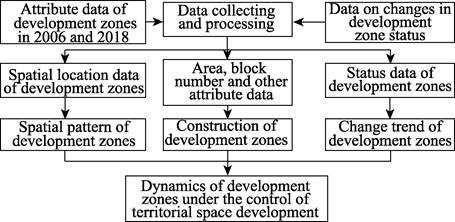
Figure 1 The technology roadmap of dataset development
|
4.1 Data Composition
Dataset
of national and provincial levels development zones in China (2006?C2018)
consists of two parts: (1) the location data of development zones (.shp), (2)
the attribute data of the development zones, including their name, approved
year, approved area, grade, type, status, and establishment year (.xlsx).
4.2 Data Products
The
distribution data of China??s national and provincial development zones show
that 1,576 zones were audited in 2006 and 2,551 zones in 2018. The number of
development zones was dominated by provincial-level zones. After the process of
revoking, merging, integrating, and expanding, the number of each type of
development zone was changed. During that 12-year period, the number of zones
increased by 1,180. As shown in Table 2, the net increase in zones at the
national level was 330, while it was 850 at the provincial level. Among the
five state types, the largest was the newly established type, with 1,031 zones.
This was followed by 850 remaining and 521 revoked zones. Therefore,
development zones above the provincial level in China have a complex dynamic
process, revealing a quantity distribution trend of total increase and internal
optimisation.
Table
2 Status types of
development zones above provincial level in China in 2018
|
Level
|
Development zone type
|
Type
|
Net
increment
|
|
Remained
|
Revoked
|
Renamed
|
Upgraded
|
Newly established
|
|
National
|
High-tech industrial development zone
|
56
|
5
|
4
|
102
|
2
|
103
|
|
Economic and technological development zone
|
53
|
0
|
0
|
155
|
11
|
166
|
|
Export processing zone
|
0
|
34
|
0
|
0
|
0
|
?C34
|
|
Bonded area
|
39
|
4
|
2
|
34
|
60
|
92
|
|
Border economic cooperation zone
|
14
|
0
|
0
|
1
|
4
|
5
|
|
Other national development zone
|
20
|
5
|
0
|
0
|
3
|
?C2
|
|
Provincial
|
Provincial economic development zone
|
415
|
393
|
96
|
148
|
327
|
178
|
|
Provincial characteristic industrial park
|
243
|
25
|
19
|
55
|
531
|
580
|
|
Provincial High-Tech Industrial Park
|
10
|
55
|
51
|
3
|
93
|
92
|
|
Total
|
850
|
850
|
521
|
172
|
498
|
1,031
|
As shown in
Figure 2, the distribution change of development zones in China mainly includes
three approaches, namely; (1) type adjustment, (2) merit-based upgrading, and
(3) extensive establishment, to improve the efficient
operation of the development zone system. Among them, type adjustment of development
zones refers to the overall replacement of another type. Specifically, export
processing zone, a type of national-level development zone, no longer remained
and was converted into bonded zones as a whole. Merit-based upgrading means
that qualified zones are promoted from the provincial level to the
national level, while those that do not meet the assessment requirement will be
eliminated (or merged into others). For example, 292 development zones were
upgraded to national-level development zones during the study period
(2006?C2018), exceeding the number of newly established national development
zones. In this time-period, 48 national-level and 473 provincial-level zones
were revoked or merged because of their poor economic performance. Extensive
establishment, which means under the guidance of policies such as ??one county,
one zone??, multi-level governments established many development zones from 2006
to 2018, to better drive the agglomeration of different regions, and enhance
the impetus of economy. Consequently, 80 development zones were established at
the national level and 951 at the provincial level.
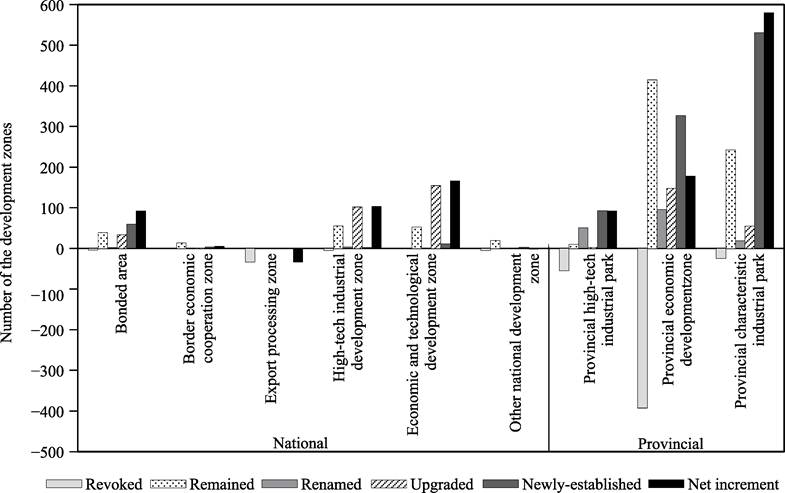
Figure 2 Types of changes in development
zones above provincial level in China in 2018
The spatial
distribution of development zones maintains an unbalanced pattern of ??more east
and less west, more south and less north??, which is essentially consistent with
the comprehensive pattern of China??s economic geography[4,7]
and has broken through Hu??s Line (Figure 3). The areas with a high density of
development zones are located in the eastern coastal areas, most densely
distributed in the periphery of Beijing-Tianjin-Hebei, Yangtze River Delta, and
Pearl River Delta. Meanwhile, there are also numerous development zones in the
core provincial capital cities such as Wuhan, Jinan, and Fuzhou. By 2018, more
development zones were located to the west of Hu??s Line, making Urumqi, Kasha,
and some other western cities gain a higher
agglomeration advantage. The development zones in the central and eastern parts
are generally encrypted, showing a trend of regional integration. In terms of
the spatial distribution change, the central and eastern parts were optimised
and improved, while western and north-eastern China made up for weaknesses.
Among them, the revoked and remaining development zones are mainly located in
the central and the east, the renamed zones are mostly in the central part, and
the upgraded zones are more likely to lie in the north-east. Finally, the newly
established zones have a wide range of distribution, with a particularly
considerable increase in the west and northeast. This indicates that China??s
development zone policy is inclined to the west and north-east parts in an
attempt to ease regional imbalance.
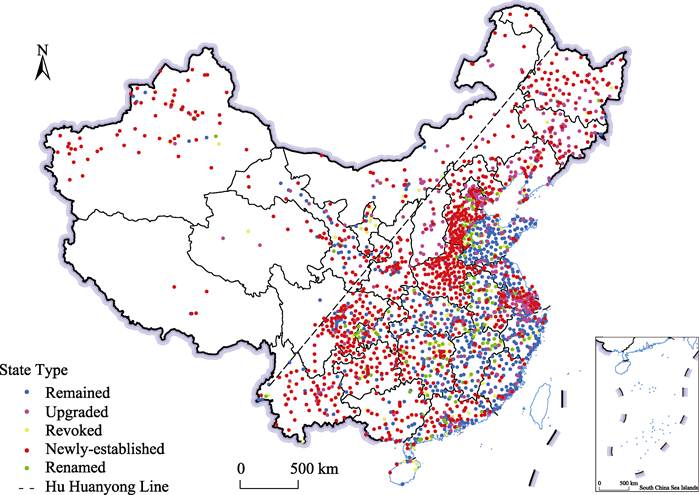
Figure 3 Spatial distribution change of
development zones above the provincial level in China
5 Discussion and Conclusion
After
rapid growth and reform and opening up in recent
years, China now faces serious challenges, including ecological and
environmental problems and industrial transformation, which asks for a more
efficient and orderly development pattern of its territorial space. Industrial
greening and innovation upgrading of development zones are of great
significance in solving these problems. Based on the data of the distribution and
scale of national and provincial level development zones in China, this dataset
aims to analyse their spatial and temporal distribution evolution and provide
new research materials and data support for the macro-level optimisation of
China??s land and space use control. The distribution of development zones is
related to multidimensional and multi-scale factors. This paper only conducts
visual processing on the location and scale of the development zone, an
important territorial spatial unit, and carries out necessary data explanation
and spatial analysis. In-depth data mining and wide-area analysis could be
carried out in combination with related factors, such as policy, economic, and
geographical conditions. Thus, this data provides a one-sided description of
China??s spatial governance in the new era. Therefore, this dataset only
provides a feasible data basis for in-depth research on related issues, but the
relevant factors that drive the layout of development zones need to be further
investigated. Based on this dataset, future explorations should focus on
the influence mechanism behind the distribution changes, the social and
economic effects, the leading mode of China??s land use, and the resulting
social and environmental problems, such as industry-city separation, land
waste, homogeneous competition, and ecological destruction. This will serve as
a reference for the Chinese government to further implement the functional
zoning system and build a sound space governance system.
Author Contributions
Liu, H. L. designed the development of the dataset; Nie, J. X. contributed
to the data processing and analysis, and wrote the paper. Liu H. L. reviewed
the paper.
Conflicts of Interest
The authors declare no conflicts of interest.
References
[1]
Cao, X. Z., Zeng, G. The
progress and prospect of studies on transformation and upgrading of development
zone [J]. World Regional Studies,
2014, 23(3): 83?C91.
[2]
Jiao, B. B., Zhang, Z. H., Xiao,
X. J., et al. A study of the
development phase and spatial-temporal patterns of China??s development zones
[J]. Science Research Management,
2018, 39(10): 50?C60.
[3]
Wang, B. J., Yang, Y. C., Shi, K.
B., et al. Spatio-temporal pattern
and its influential factors of western China??s parks [J]. Areal Research and Development, 2018, 37(5): 6?C12.
[4]
Liu, H. L., Nie, J. X. The
changes of the spatial distribution of China??s national and provincial
development zones from 2006 to 2018 [J]. Journal
of Natural Resources, 2020, 35(9): 2229?C2240.
[5]
Tian, Y., Chen, H., Dong, Y., et al. Type and spatial evolution of the
leading industries in the Yangtze River Economic Belt??a case study of the national and provincial
development zones [J]. Economic Geography, 2020, 40(12): 100?C108.
[6]
Hu, S. L., Zeng, G., Teng, T. W.,
et al. Industrial agglomeration and
evolution in the Yangtze River Economic Belt: From the perspective of
development zone [J]. Geographical Research, 2020, 39(3): 611?C626.
[7]
Hu, S. L., Zhou, L., Teng, T. W.,
et al. Spatial pattern and
influencing factors of national and provincial development zones in China [J]. Economic
Geography, 2019, 39(1): 21?C28.
[8]
Cai, S. Z., Lu, L. Efficiency measurement and spatio-temporal
differentiation of Economic and Technological Development Zones in China [J]. Scientia
Geographica Sinica, 2014, 34(7): 794?C802.
[9]
He, Z., Yang, Y., Liu, Y., et al. Recognition of the spatial
characteristics and influencing factors of leading industries in China??s
national level ETDZs [J]. Geographical Research, 2020, 39(2): 337?C353.
[10]
Tang, C. L., Chen, W. Y., Wu, J.
M., et al. Spatial distribution and
industrial agglomeration characteristics of development zones in the Yangtze
River Economic Belt [J]. Scientia Geographica Sinica, 2020, 40(4):
657?C664.
[11]
Gao, C., Jin, F. J. Spatial pattern and industrial characteristics of
economic technological development areas in eastern coastal China [J]. Acta
Geographica Sinica, 2015, 70(2): 202?C213.
[12]
Ding, Y., Cai,
J. M., Ren, Z. P., et al. Spatial
disparities of economic growth rate of China??s National-level ETDZs and their
determinants based on geographical detector analysis [J]. Progress in
Geography, 2014, 33(5): 657?C666.
[13]
Nie, J. X., Liu, H. L. Dataset
of national and provincial levels development zones in China (2006?C2018) [J/DB/OL].
Digital Journal of Global Change Data
Repository, 2021. https://doi.org/10.3974/ geodb.2021.06.03.V1.
https://cstr.escience.org.cn/CSTR:20146.11.2021.06.03.V1.
[14]
GCdataPR Editorial Office.
GCdataPR data sharing policy [OL]. https://doi.org/10.3974/dp.policy.2014.05
(Updated 2017).
[15]
The National Development and
Reform Commission of the People??s Republic of China. China Development Zone
Audit Announcement Catalogue (2006 edition) [EB/OL].
http://images.mofcom.gov.cn/ www/accessory/200705/1179130829990.pdf.
[16]
The National Development and
Reform Commission of the People??s Republic of China. China Development Zone
Audit Announcement Catalogue (2018 edition) [EB/OL].
https://www.ndrc.gov.cn/fggz/ lywzjw/zcfg/201803/W020190909440839353401.pdf.