Dataset Development on Commuting Efficiency by Travel Mode
in Shanghai (2015)
Yue, L. Y.1 Zhu, Y.1* Li,
K. M.2,3
1. Asian Demographic Research
Institute, Shanghai University, Shanghai 200444, China;
2. Department of Architecture,
Shanghai Academy of Fine Arts, Shanghai University, Shanghai 200444, China;
3. Technology Innovation Center for Land Spatial
Eco-restoration in Metropolitan Area, Ministry of Natural Resources of China,
Shanghai 200003, China
Abstract: This study conducts a
comparative analysis of commuting efficiency across different travel modes
within the excess commuting framework. It contributes to a deeper understanding
of interactions between urban commuting patterns, land use, and transportation
systems. This kind of study holds significant practical values for promoting
green, low-carbon cities and advancing urban sustainable development. Using data by sub-district from the 1%
Population Sampling Survey in Shanghai, this paper explores commuting
efficiency for three travel modes (non-motorized, public transport, and cars)
across educational worker subgroups. It results in a dataset of commuting efficiency
by travel mode in Shanghai (2015). The dataset includes the following data of
Shanghai in 2015: (1) the number of commuting flows in sub-districts; (2)
descriptive statistics of travel modes for different educational worker
subgroups; (3) results of commuting efficiency metrics for different travel
modes; (4) observed commuting flows matrix for each education-mode subgroup.
The dataset is archived in .xlsx data format, and consists of one file with
data size of 15.5 MB.
Keywords: commuting
efficiency; excess
commuting; jobs-housing balance; mode; Shanghai
DOI: https://doi.org/10.3974/geodp.2024.04.08
CSTR: https://cstr.escience.org.cn/CSTR:20146.14.2024.04.08
Dataset Availability Statement:
The
dataset supporting this paper was published and is accessible through the Digital Journal of Global Change Data Repository
at: https://doi.org/10.3974/geodb.2024.09.05.V1 or
https://cstr.escience.org.cn/CSTR:20146.11.2024.09.05.V1.
1 Introduction
Commuting
is an important part of urban life, and its intensity can be seen as a sign of
urban vitality[1,2]. However,
excessive commuting volumes can lead to significant urban management
challenges, including traffic congestion, resource depletion, and environmental
pollution, all of which can severely hinder urban sustainable development[3,4]. Urban land use
fundamentally shapes residents?? commuting behaviors, and optimizing residential
and employment spatial layout
is widely regarded as a key solution to addressing urban commuting issues[5,6].
In 2014, the National Plan on New Urbanization (2014?C2020), officially issued
by the State Council of China, identified ??city-industry integration?? as a
crucial strategy for resolving urban development problems, such as sleepers??
towns and ??ghost?? towns, during the rapid urbanization phase. In recent years,
megacities such as Shanghai and Beijing have increasingly embraced the concept
of jobs-housing balance in their urban development plans, aiming to enhance urban
efficiency and livability.
Excess commuting serves as a critical paradigm for
evaluating urban commuting efficiency[7]. However, existing
studies mainly focus on the single perspective of travel cost, paying limited
attention to the perspective of commuting spatial organization. Moreover, few empirical studies have explored these two
perspectives within the same framework. It is limiting to assess urban
commuting efficiency solely based on travel costs, as this overlooks the
intricate dynamics between urban land use and commuting behavior. Additionally,
previous studies have largely overlooked the interaction between travel modes
and individual socioeconomic attributes within the framework of excess
commuting.
Using data from
the 2015 Shanghai 1% Population Sampling Survey Data, this study examines urban modal commuting efficiency
across educational worker subgroups within the excess commuting framework. It
quantifies the nonlinear relationship between commuting costs and spatial
organization, ultimately develops the dataset of Commuting Efficiency by Travel
Mode Dataset in Shanghai (2015).
2 Metadata of the Dataset
The metadata of the Commuting efficiency by travel mode
dataset in Shanghai (2015)[8] is summarized in Table 1. It includes the
dataset full name, short name, authors, year of the dataset, data format, data
size, data files, data publisher, and data sharing policy, etc.
3 Methods
3.1 Data Source
This paper uses 2015 Shanghai 1% Population Sampling Survey
Data, sourced from the Municipal Bureau of Statistics in Shanghai[10],
to construct urban commuting flow matrix. The raw data
used in this study consists of samples with unequal proportions. All data are
adjusted and weighted to account for the sampling proportions. Regarding
residents?? socioeconomic attributes, educational levels are categorized into
three simplified groups: low (elementary school or below), middle (junior or
senior high school), and high (college or above). Travel modes are classified
into three categories: non-motorized transport (walking and biking), public
transport (buses and subways), and private cars. Following the existing
research method[11], commuting
cost matrices are constructed using road network distances derived through
ArcGIS network analysis.
Shanghai comprises 17 districts, including
Huangpu, Xuhui, Changning, Jing??an, Putuo, Zhabei, Hongkou, Yangpu, Minhang,
Baoshan, Jiading, Pudong, Jinshan, Songjiang, Qingpu, Fengxian, and Chongming,
covering a total area of approximately 6,340 km2. Since Chongming is
an isolated island, this study focuses on the main urban area of Shanghai, excluding
Chongming, and adopts the sub-district as the geographical spatial analysis
unit. The dataset includes various commuting-related data, such as the number
of residents and workplaces by
Table 1 Metadata summary of the Commuting efficiency
by travel mode dataset in Shanghai (2015)
|
Items
|
Description
|
|
Dataset
full name
|
Commuting
efficiency by travel mode dataset in Shanghai (2015)
|
|
Dataset
short name
|
CommutingEfficiencyShanghai2015
|
|
Authors
|
Yue, L. Y., Asian Demographic Research
Institute, Shanghai University, liying128@shu.
edu.cn
Zhu,
Y., Asian Demographic Research Institute, Shanghai University,
zhu300@shu.edu.cn
Li,
K. M., Department of Architecture, Shanghai Academy of Fine Arts, Shanghai
University, kaiming1239@shu.edu.cn
|
|
Geographical
region
|
Shanghai
main urban areas (excluding Chongming)
|
|
Year
|
2015
|
|
Data
format
|
.xlsx
|
|
|
|
Data
size
|
15.5
MB
|
|
|
|
Data
files
|
The
number of commuting flows in sub-districts, the descriptive statistics and
commuting efficiency metrics of different travel modes, and the commuting
flows matrix for different educational worker subgroups
|
|
Foundation
|
Ministry
of Education of P. R. China (23YJCZH287)
|
|
Data
publisher
|
Global Change Research Data Publishing &
Repository, http://www.geodoi.ac.cn
|
|
Address
|
No.
11A, Datun Road, Chaoyang District, Beijing 100101, China
|
|
Data
sharing policy
|
(1) Data are openly available and can be
free downloaded via the Internet; (2) End users are encouraged to use Data subject to citation; (3) Users,
who are by definition also value-added service providers, are welcome to
redistribute Data subject to
written permission from the GCdataPR Editorial Office and the issuance of a Data redistribution license; and (4)
If Data are used to compile new
datasets, the ??ten per cent principal?? should be followed such that Data records utilized should not
surpass 10% of the new dataset contents, while sources should be clearly
noted in suitable places in the new dataset[9]
|
|
Communication and
searchable system
|
DOI, CSTR, Crossref, DCI, CSCD, CNKI, SciEngine, WDS, GEOSS, PubScholar, CKRSC
|
sub-district, mode
splits for three educational worker subgroups, and the commuting flow matrix in
Shanghai.
3.2 Algorithm
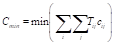
Within
a given urban jobs-housing spatial structure, the disparity between actual
commuting ( ) and theoretical minimum commuting (
 ) is referred to as excess commuting[12], which
originates from the concept of wasteful commuting proposed by Hamilton in 1982[13].
Based on commuting spectrum theory, this paper adopts theoretical minimum
commuting as the lower benchmark and random commuting as the upper benchmark[14]. A lower theoretical
minimum commuting indicates a greater degree of jobs-housing intermixing,
whereas a higher value suggests greater spatial segregation. It is highly
sensitive to the spatial allocation of housing and employment and is often used
as a planning tool to assess jobs-housing balance at the local level[15]. Random commuting, by
contrast, represents a commuting pattern in which residents are
indifferent to travel costs (i.e., the friction coefficient equals zero),
thereby reflecting regional jobs-housing imbalance.
) is referred to as excess commuting[12], which
originates from the concept of wasteful commuting proposed by Hamilton in 1982[13].
Based on commuting spectrum theory, this paper adopts theoretical minimum
commuting as the lower benchmark and random commuting as the upper benchmark[14]. A lower theoretical
minimum commuting indicates a greater degree of jobs-housing intermixing,
whereas a higher value suggests greater spatial segregation. It is highly
sensitive to the spatial allocation of housing and employment and is often used
as a planning tool to assess jobs-housing balance at the local level[15]. Random commuting, by
contrast, represents a commuting pattern in which residents are
indifferent to travel costs (i.e., the friction coefficient equals zero),
thereby reflecting regional jobs-housing imbalance.
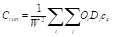
To calculate
commuting benchmarks, this study employs the Transportation Problem in Linear
Programming to estimate the theoretical minimum commuting () and its corres-
ponding
commuting flow matrix. Additionally, the doubly constrained spatial interaction
model is applied to compute the theoretical minimum commuting entropy ( ) using the Newton-Raphson iterative algorithm.
Based on the observed jobs-housing distribution by sub-district and
observed commuting flow matrix, the observed average commuting distance () and entropy ( ) are calculated. Finally, random
commuting distance (
) are calculated. Finally, random
commuting distance ( ) and random entropy (
 ) are derived by setting the decay
coefficient (??) to zero. We evaluate and compare modal
commuting efficiency across
educational worker subgroups using commuting benchmarks and excess commuting
indicators, as summarized in Table 2.
) are derived by setting the decay
coefficient (??) to zero. We evaluate and compare modal
commuting efficiency across
educational worker subgroups using commuting benchmarks and excess commuting
indicators, as summarized in Table 2.
Table 2 The
indicators of commuting benchmarks and excess commuting
|
Algorithm metrics
|
Indicator
|
Equation
|
|
Commuting benchmark
|
Observed commuting ( ) )
|

|
|
|
Minimum commuting ( ) )
|
|
|
|
Random commuting ( ) )
|
|
|
|
Observed entropy ( ) )
|

|
|
|
Minimum entropy ( ) )
|

|
|
|
Random entropy ( ) )
|

|
|
Excess commuting indicator
|
Excess commuting (EC)
|

|
|
|
Normalized excess commuting (NEC)
|

|
|
|
Normalized excess entropy (NEH)
|

|
Note: denotes the number of commuters living in zone i and
working at zone j;
denotes the number of commuters living in zone i and
working at zone j; and
and denote the total numbers of workers at zone i and jobs
at zone j, respectively; C denotes the average commuting
distance;
denote the total numbers of workers at zone i and jobs
at zone j, respectively; C denotes the average commuting
distance; denotes the commuting distance between zone i and zone
j;
denotes the commuting distance between zone i and zone
j; and
and denotehe associated unknown Lagrangean multiplier;
 and
and denote the balancing factors[16].
4 Data Results
4.1 Data Composition
This dataset includes following data of Shanghai in 2015: (1)
the number of commuting flows by sub-district; (2) descriptive statistics of
travel modes for different educational worker subgroups; (3) results of
commuting efficiency metrics for different travel modes; (4) observed commuting
flows matrix for each education-mode subgroup.
4.2 Data Results
Based
on calculations and statistical analysis, Shanghai??s total permanent employed
population is 12.47 million, with 12.04 million living and working within the
main urban areas (excluding Chongming). Among them, 50.22% do not reside in the
same street as their workplace, while 49.78% of them live and work within the
same sub-district. Inter-zonal commuting flows are predominantly concentrated
in five new towns and the central urban area. Figure 1 illustrates the spatial
distribution of the employed population and employment opportunities (i.e.,
commuting volumes at origins and destinations). The employed population
exhibits a decentralized spatial pattern, whereas employment opportunities
display a combination of concentration and dispersion.
From
the perspective of commuting modes, non-motorized travel, car travel, and
public transport account for 55.73%, 19.08% and 25.19% of total trips,
respectively. This indicates that, compared to Western countries, urban
commuting in China remains dominated by public transport and non-motorized
travel, with car usage constituting a relatively small proportion. Examining
modal differences across educational worker subgroups (Figure 2), the majority
of lowly educated workers (92.34%) rely on non-motorized travel. In contrast,
the proportion of non-motorized travel among highly educated workers is
significantly lower, at only 22.85%. Instead, car travel and public transport
make up 30.46% and 46.69% of their commutes, respectively. For workers with a
middle level of education, car travel and public transport account for 13.25%
and 13.42% of their commuting trips, respectively.
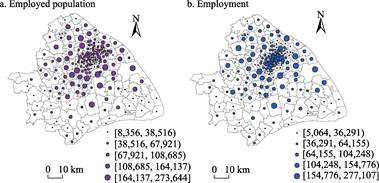
Figure 1 Maps
of workers and employment by sub-district in Shanghai
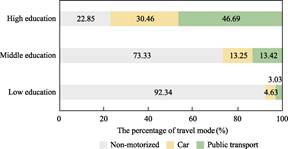
Figure 2
Mode split across different educational subgroups
Table 3 and Figure 3 present commuting efficiency by
travel mode and educational level. For theoretical minimum commuting (), low-educated workers experience the longest commuting
distances (4.17?C6.56 km), whereas high-educated commuters travel the shortest
distances (3.02?C5.06 km), followed by those with a middle level of education
(3.94?C5.26 km). A similar trend is observed for random commuting (), where the commuting distance for low-educated workers is
approximately 10 km longer than for high-educated workers. These findings
indicate that job accessibility and jobs-housing balance are lowest for poorly
educated workers at both local and regional scales. Although Chinese cities do
not exhibit the racial discrimination and residential segregation found in
American cities, the excessive separation of residence and employment imposes
substantial time and economic burdens on disadvantaged groups, such as
low-educated and low-skilled workers. Previous studies have demonstrated that job-housing separation can undermine the
information-seeking and mobility capabilities of vulnerable groups,
restricting their access to opportunities in urban housing and labor markets.
Such disparities may exacerbate broader urban social and spatial issues[17].
Observed commuting
distances () range from 4.35 km to 15.91 km. For car travel, low-educated
workers commute shorter distances (8.70 km) compared to high-educated workers
(12.87 km). Some studies[18] identify two distinct commuting
patterns by car in Shanghai: long-distance and short-distance commuting. This
suggests that the short-distance commuting pattern may be associated with the
habits and preferences of newly affluent individuals in China, for whom driving is
seen as a form of conspicuous consumption[19]. For public transport,
low-educated workers commute longer distances (14.14% farther) than
high-educated workers. This can be attributed to the spatial distribution of
jobs and housing in Shanghai, which forces low-educated commuters to travel, on
average, 22.87% farther than their high-educated counterparts. Another possible
reason is that low-educated commuters are more willing to endure
longer commutes in exchange for lower housing costs. High rents and property
prices make it difficult for low-educated workers to find affordable housing
near their workplaces, forcing them to live in suburban areas far from their employment. Previous studies have
emphasized the significant role housing pressure plays in the jobs-housing
relationship and residents?? subjective well-being in Chinese cities[20].
Entropy is used to reflect the orderliness of commuting spatial
organization, with higher entropy indicating a more organized commuting
pattern. Among the different modes, the observed entropy for non-motorized
travel is the lowest (5.62?C6.98), while public transport exhibits the highest
entropy (8.46?C9.27). As shown in Table 3, there is a clear relationship between observed
entropy and observed commuting distance. For example, low-educated and
high-educated workers using public transport have observed average commuting distances () of 15.91 km and 13.66 km, respectively, with corresponding
entropy values () of 8.46 and 9.23. This suggests that, compared to
high-educated commuters, low-educated commuters using public transport endure
longer commuting distances but experience
more organized commuting patterns. Similarly, for non-motorized commuters,
those with low and high education levels have observed average commuting
distances () of 4.72 km and 4.35 km, respectively, while their entropy
values () are 5.62 and 6.98, respectively. This indicates that,
compared to non-motorized commuters with higher education, those with lower
education levels have longer, yet more organized commuting patterns.
Table 3 Results of commuting efficiency metrics based
on different travel modes
|
Mode
|
Education
|
(km)
|
(km)
|
(km)
|
|
|
|
EC
(%)
|
NEC
(%)
|
NEH
(%)
|
|
Non-motorized
|
Low
|
4.17
|
4.72
|
39.71
|
4.98
|
5.62
|
9.41
|
11.65
|
1.55
|
14.50
|
|
Middle
|
3.94
|
4.91
|
36.78
|
5.23
|
6.25
|
9.84
|
19.87
|
2.90
|
22.10
|
|
High
|
3.02
|
4.35
|
28.22
|
5.43
|
6.98
|
10.06
|
30.49
|
5.26
|
33.34
|
|
Car
|
Low
|
5.33
|
8.70
|
38.95
|
5.01
|
6.63
|
8.98
|
38.71
|
10.01
|
40.95
|
|
Middle
|
4.59
|
10.45
|
37.47
|
5.35
|
7.84
|
9.71
|
56.10
|
17.83
|
57.07
|
|
High
|
4.57
|
12.87
|
29.10
|
5.51
|
8.77
|
9.77
|
64.51
|
33.85
|
76.58
|
|
Public transport
|
Low
|
6.56
|
15.91
|
34.90
|
5.30
|
8.46
|
9.41
|
58.77
|
32.98
|
77.03
|
|
Middle
|
5.26
|
14.20
|
25.53
|
5.61
|
9.27
|
9.89
|
62.98
|
44.11
|
85.44
|
|
High
|
5.06
|
13.66
|
20.04
|
5.48
|
9.23
|
9.57
|
62.94
|
57.42
|
91.78
|
In terms of average
commuting distance, non-motorized commuters with low educational level
experience the least excess commuting (EC=11.65%) and exhibit the
highest commuting efficiency. In contrast, high-educated car commuters face the
greatest excess commuting (EC=64.51%) and the lowest commuting
efficiency. However, when considering the upper benchmark, high-educated public
transport commuters demonstrate the lowest commuting efficiency (NEC=57.42%),
which is attributed to the centralized layout of public transport, particularly
rail transit. From the perspective of spatial organization, except for
low-educated public transport users and high-educated car users, the rankings
of normalized excess entropy (NEH) and normalized excess commuting (NEC)
are nearly identical. Moreover, long commuting patterns are not necessarily
inefficient (e.g., low-educated public transport users), and short commuting
patterns are not always efficient (e.g., high-educated public transport users).
This highlights that commuting efficiency is determined by the relative position of observed commuting
within the commuting spectrum.
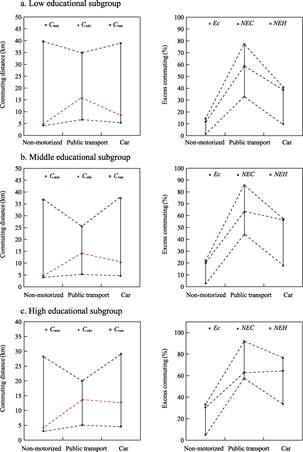
Figure 3 Modal excess commuting indicators across
different educational subgroups
5 Discussion and Conclusion
Based
on data from the 1% Population Sample Survey in Shanghai, this paper computes
commuting benchmarks and excess commuting indicators for different travel
modes, quantifies the nonlinear relationship between average travel distance
and the spatial organization of commuting, and provides insights and references
for studies on commuting efficiency. The key findings are as follows: (1) non-motorized
travel accounts for 55.73%, while travel by car and public transport accounts
for 19.08% and 25.19%, respectively. Compared to Western countries, the
proportion of motorized travel in Chinese cities remains relatively low; (2) significant
differences in commuting efficiency are observed across travel modes. From both
the average commuting distance and spatial organization perspectives, commuting
efficiency is ranked as follows: non-motorized > car > public transport.
This indicates that public transport travel has the lowest commuting efficiency
and the greatest potential for optimizing the jobs-housing relationship. The
current urban land use patterns in Shanghai are not particularly conducive to
public transport use; (3) an interaction exists between travel mode and
residents?? socioeconomic attributes regarding commuting efficiency. In
cross-dimensional analysis, a long commuting pattern (e.g., low-educated
commuters using public transport) is not necessarily inefficient or disordered,
while a short commuting pattern (e.g., high-educated commuters using public
transport) is not inherently efficient or orderly; (4) commuting efficiency
exhibits a curvilinear relationship from both the average commuting distance
and spatial structure perspectives. The organization of commuting reflects the
orderliness and structure of urban commuting patterns and is closely related to
road congestion and traffic demand management. For two cities with the same
average commuting distance, the city with a more
disorganized commuting pattern typically experiences more chaotic and random commuting flows, which are more likely to lead to
serious traffic congestion. Thus, it is essential to study commuting efficiency
from both the average commuting distance and commuting organization
perspectives.
This
dataset captures the jobs-housing relationship and commuting efficiency for
different travel modes in Shanghai. It provides data support for optimizing
urban spatial structure and promoting low-carbon travel. Future research can
use this dataset to analyze the evolving characteristics of commuting efficiency in Shanghai and conduct intercity
comparison studies on commuting
efficiency.
Author Contributions
Zhu, Y. and Yue, L. Y. designed the
algorithms of dataset. Yue, L. Y. and Li, K. M. contributed to the data
processing and analysis. Yue, L. Y., Zhu, Y. and Li, K. M. wrote the data paper.
Conflicts
of Interest
The authors
declare no conflicts of interest.
References
[1]
Niedzielski,
M. A. A spatially disaggregated approach to commuting efficiency [J]. Urban
Studies, 2006, 43(13): 2485‒2502.
[2]
Liu, X. T.,
Chen, X. M., Zhou, J. P. Study on jobs-housing spatial relationship and
commuting efficiency: evaluation potential of excess commuting [J]. Urban Transport of China,
2018, 16(2): 10‒18.
[3]
Horner, M.
W. Extensions to the concept of excess commuting [J]. Environment and Planning A: Economy and Space,
2002, 34(3): 543‒566.
[4]
Liu, W. B.,
Yan, X. P., Fang, Y. P., et al. Related characteristics and mechanisms
for excess commuting in Guangzhou [J]. Acta Geographica Sinica, 2008, 63(10): 1085‒1096.
[5]
Zhu, W., Liang, X. M., Gui, C.,
et al. The inter-generational differences in
the effects of job-housing optimization in Shanghai [J]. Acta Geographica Sinica, 2020, 75(10): 2192‒2205.
[6]
Han, H. R.,
Yang, C. F., Song, J. P. Impact factors and differences in commuting efficiency
between public transit and private automobile travel: a case study on the
Beijing metropolitan area [J].
Geographical Research, 2017, 36(2): 253‒266.
[7]
Yue, L. Y.,
O??Kelly, M. E. Commuting performance in Shanghai: efficiency and orderliness [J]. Travel Behaviour and Society, 2023,
31: 223‒231.
[8]
Yue, L. Y., Zhu, Y., Li, K. M.
Commuting efficiency by travel mode dataset in Shanghai (2015) [J/DB/OL]. Digital
Journal of Global Change Data Repository, 2024. https://doi.org/10.3974/geodb.2024.09.05.V1.
https://cstr.escience.org.cn/CSTR: 20146.11.2024.09.05.V1.
[9] GCdataPR Editorial Office. GCdataPR
data sharing policy [OL]. https://doi.org/10.3974/dp.policy.2014.05 (Updated
2017).
[10] Shanghai Municipal Bureau of Statistics. 2015
Shanghai 1% Population Sampling Survey Data [M]. Beijing: China Statistics
Press, 2017.
[11] Frost, M., Linneker, B., Spence, N. Excess or
wasteful commuting in a selection of British cities [J]. Transportation Research Part A: Policy and
Practice, 1998, 32(7): 529?C538.
[12] Zhang, H., Xu, S., Liu, X., et al. Near
??real-time?? estimation of excess commuting from open-source data: evidence from
China??s megacities [J]. Journal
of Transport Geography, 2021, 91(4): 1‒14.
[13] White, M. J. Urban commuting journeys are not
wasteful [J]. Journal of
Political Economy, 1988, 96(5): 1097‒1110.
[14] Yang, J. W., Ferreira, J. Choices versus choice
sets: a commuting spectrum method for representing job-housing possibilities [J]. Environment and Planning B:
Planning and Design, 2008, 35(2): 364‒378.
[15] Horner, M. W., Murray, A. T. Excess commuting
and the modifiable areal unit problem [J]. Urban Studies, 2002, 39(1): 131‒139.
[16] O??Kelly, M. E., Niedzielski, M. A. Are long
commute distances inefficient and disorderly? [J]. Environment and Planning A: Economy and Space,
2009, 41(11): 2741‒2759.
[17] Liu, Z. L., Wang, M. J. Job
accessibility and its impacts on commuting time of urban residents in Beijing: from
a spatial mismatch perspective [J]. Acta Geographica Sinica, 2011,
66(4): 457‒467.
[18] Sun, B. D., Dan, B. Impact of urban built
environment on residential choice of commuting mode in Shanghai [J]. Acta Geographica Sinica,
2015, 70(10): 1664‒1674.
[19] Li, W., Dan, B., Sun, B. D., et al.
The influence of rail transit accessibility on the shift of travel modal
choice: empirical analysis based on the micro survey of the 1980s generation in
Shanghai [J]. Geographical
Research, 2017, 36(5): 945‒956.
[20]
Zhan,
D. S., Kwan, M. P., Zhang, W. Z., et al. The impact of housing pressure
on subjective well-being in urban China [J]. Habitat International, 2022,
127(3): 1‒10.