Development of Extreme Precipitation
Dataset of Qinghai?CTibet Plateau
(1961?C2017)
Ma, W. D.1 Liu, F. G.1,2* Zhou, Q.1 Chen, Q.1
1. School of Geographic Science, Qinghai Normal University,
Xining, Qinghai 810008, China
2. Academy of Plateau Science and Sustainability, Xining,
Qinghai 810008, China
Abstract: With the worsening of climate warming, more and
more glaciers, snow, and other solid water bodies in Qinghai?CTibet Plateau have
melted. This phenomenon has increased the water volume in the local water
cycle, led more extreme precipitation events. Therefore, it is critical to
understand the spatial distribution and variation in extreme precipitation
events within Qinghai?CTibet Plateau. Based on daily precipitation data from 78
meteorological stations in Qinghai?CTibet Plateau, the threshold value of extreme
precipitation was determined using the percentile threshold method. Four
extreme precipitation indexes (R99D, R99P, R99I, and R99C) were then derived,
and the Extreme precipitation dataset on Qinghai?CTibet Plateau (1961?C2017) was
developed. The dataset includes: (1) site location data; (2) the extreme precipitation
threshold for each station (Table 1); (3) the times and precipitation amounts
of extreme precipitation events at each station (Table 2); (4) the values of
the four extreme precipitation indexes at each station (Table 3); and (5) the
extreme precipitation index values from 1961 to 2017 (Table 4). The dataset is
archived in .shp and .xls data formats with the data size of 459 KB (92.9 KB
compressed into one file).
Keywords: Qinghai?CTibet
Plateau; extreme precipitation; threshold value; 1961?C2017
Dataset Availability Statement:
The dataset supporting this paper was published and is accessible
through the Digital
Journal of Global Change Data Repository at:
https://doi.org/10.3974/geodb.2020.01.10.V1.
1 Introduction
Extreme
precipitation is the leading factor in floods, which are sudden and destructive
events that often have serious effects on society and the natural environment.
Therefore, flooding caused by extreme precipitation events is one of the key
topics of the International Hydrological Program led by UNESCO[1,2].
The results released by China??s second comprehensive scientific investigation
on Qinghai?CTibet Plateau indicate that the cryosphere of Qinghai?CTibet Plateau
has melted rapidly over the past 50 years; moreover, a large amount of solid
water (e.g., glaciers and snow) has been rapidly converted into liquid water, increasing
lake area and surface runoff[3]. The imbalance of Asian water towers
has caused the amount of water entering the water cycle to increase, further
aggravating the already serious risk of flood disasters in Qinghai?CTibet
Plateau[4,5].
Although the
Qinghai?CTibet Plateau is vast in area, hydrological and meteorological observation
stations are sparsely distributed. Moreover, observation equipment with high
time resolution and high spatial resolution has been put into use in a short
year. Thus, it is difficult to obtain data with long time series, high time
resolution, and high spatial resolution. Based on daily precipitation data
obtained from 78 meteorological stations on Qinghai?CTibet Plateau[6,7] from
1961 to 2017, this study (1) determined the extreme precipitation threshold for
each station using the percentile threshold method, (2) used these thresholds
to screen extreme precipitation events at each station, (3) calculated extreme
precipitation indexes, and (4) analyzed the temporal variation and spatial
distribution of extreme precipitation on Qinghai?CTibet Plateau.
2 Metadata of the Dataset
The metadata of the Extreme
precipitation dataset on Qinghai?CTibet Plateau (1961?C 2017)[8] are summarized in Table 1. The
metadata include the dataset name, authors, geographical region, year range,
temporal resolution, spatial resolution, data files, data publisher, and data
sharing policy, etc.
Table
1 Metadata
summary of Extreme precipitation dataset on Qinghai?CTibet Plateau (1961?C2017)
|
Item
|
Description
|
|
Dataset name
|
Extreme
precipitation dataset on Qinghai?CTibet Plateau (1961?C2017)
|
|
Dataset short
name
|
ExtremePrecip_TibetanPlateau
|
|
Authors
|
Ma, W. D.
AAB-3337-2021, School of Geographic Science, Qinghai Normal University,
mwd0910@sina.com
Liu, F. G.
L-8795-2018, School of Geographic Science, Qinghai Normal University,
lfg_918@163.com
Zhou, Q.
AAB-3351-2021, School of Geographic Science, Qinghai Normal University,
zhouqiang729@163.com
Chen, Q.
AAB-3346-2021, School of Geographic Science, Qinghai Normal University, qhchenqiong@163.com
|
|
Geographical
region
|
Qinghai?CTibet Plateau (26??00¢12²N?C39??46¢50²N, 73??18¢52²E?C104??46¢59²E), with a total area of about 2.57??106 km2,
including Qinghai, Tibet and parts of Xinjiang, Gansu, Sichuan, and Yunnan
|
|
Year
|
1961?C2017
|
Temporal
resolution Year
|
|
Data format
|
.shp, .xls
|
Data size 459 KB
|
|
Data files
|
(1) Site location
data; (2) extreme precipitation threshold of each station (Table 1); (3) time
and precipitation for extreme precipitation events at each station (Table 2);
(4) values of four extreme precipitation indexes for each station (Table 3);
and (5) extreme precipitation indexes from 1961 to 2017 (Table 4)
|
|
Foundations
|
Ministry of
Science and Technology of P. R. China (2019YFA0606900, 2019QZKK0906)
|
|
Computing
environment
|
Microsoft Excel
2016; ArcGIS
|
|
Data publisher
|
Global Change
Research Data Publishing & Repository, http://www.geodoi.ac.cn
|
|
Address
|
No. 11A, Datun
Road, Chaoyang District, Beijing 100101, China
|
|
Data sharing policy
|
Data from the Global Change
Research Data Publishing & Repository includes metadata, datasets (in the Digital Journal of Global Change Data Repository), and
publications (in the Journal of Global Change Data & Discovery). Data
sharing policy includes: (1) Data are openly available
and can be free downloaded via the Internet; (2) End users are encouraged to
use Data subject to citation; (3) Users, who are by definition
also value-added service providers, are welcome to redistribute Data subject
to written permission from the GCdataPR Editorial Office and the issuance of
a Data redistribution license; and (4) If Data are
used to compile new datasets, the ??ten per cent principal?? should be followed
such that Data records utilized should not surpass 10% of the
new dataset contents, while sources should be clearly noted in suitable
places in the new dataset[9]
|
|
Communication and
searchable system
|
DOI,
DCI, CSCD,WDS/ISC, GEOSS, China GEOSS, Crossref
|
3 Methods
The daily precipitation data
from 78 meteorological stations in Qinghai?CTibet Plateau lasting more than a
half century (1961?C2017) were taken from the China Meteorological Data Network. First,
according to long-term continuous daily precipitation data from the meteorological
stations, which have not been moved since their establishment, the stations
were screened. The outliers were then removed from the data for each station,
and extremism and consistency tests were carried out.
3.1 Algorithm
Precipitation in China shows
obvious spatial heterogeneity. Precipitation is concentrated in the monsoon
region of central and eastern China, whereas precipitation is relatively scarce
in the alpine region of Qinghai?CTibet and the arid region of northwest China.
Defining extreme precipitation events based on specific thresholds (e.g.,
precipitation associated with heavy rains or rainstorms) in Qinghai?CTibet
Plateau may result in over-containment, omission, or lack of data. Moreover,
the extreme precipitation thresholds in different regions are not comparable.
Therefore, the percentile threshold method was selected to determine the
extreme precipitation threshold for each station in this study0,11.
The daily precipitation data for each station were sorted in ascending order
after eliminating null values. The percentile threshold method was then used to
determine the extreme precipitation threshold of the station. The percentile
threshold method effectively avoids the disadvantages of one-size-fits-all
methods for threshold selection and results in thresholds that are comparable
among different sites.
3.2 Data Development Process
Based
on the daily precipitation data of the station from 1961 to 2017, the following
steps were carried out (Figure 1):
(1) Daily
precipitation data were arranged in ascending order according to the amount of
precipitation, and the cumulative percentage of 99% was used as the threshold
of extreme precipitation for each station according to the percentile threshold
method;
(2)
Extreme precipitation events were identified based on the extreme precipitation
threshold for each station. An extreme
precipitation event was determined to occur on a certain day if the precipitation at a certain station
exceeded the extreme precipitation threshold for that station;
(3) According to the identified extreme
precipitation events, the extreme precipitation indexes
were calculated for each station;
(4) The
temporal variation and spatial distribution of extreme precipitation events in
Qinghai?CTibet Plateau were analyzed.
4 Data Results
and Validation
4.1 Data Products
The resulting dataset
includes the following: (1) site location data; (2) the extreme precipitation
threshold for each station; (3) the times and precipitation amounts of extreme
precipitation events; (4) the values of four extreme precipitation indexes for
each station; and (5) the extreme precipitation index values from 1961 to 2017.
After the 99th percentile was used to determine the extreme
precipitation threshold for each station, the following four indexes were
calculated to analyze the temporal and spatial variations in extreme
precipitation events on Qinghai?CTibet Plateau: extreme precipitation index
(R99P); extreme precipitation frequency index (R99D); extreme precipitation
intensity index (R99I); and extreme precipitation contribution rate index (R99C).
Definition of extreme precipitation indexes is shown in Table 2.
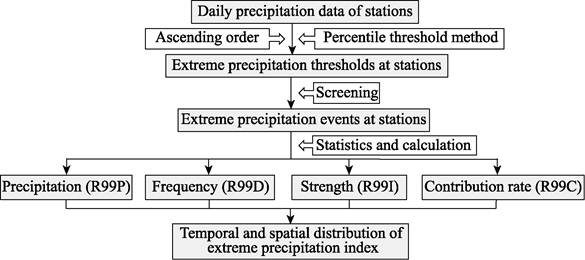
Figure 1 Flowchart of the dataset development
Table 2 Definition of extreme
precipitation index
|
Index
|
Abbreviation
|
Definition
|
Unit
|
|
Extreme
precipitation index
|
R99P
|
The sum of annual daily
precipitation exceeding the 99th-percentile value
|
mm
|
|
Extreme
precipitation frequency index
|
R99D
|
The sum of the frequency of
annual daily precipitation exceeding the 99th-percentile value
|
d
|
|
Extreme
precipitation intensity index
|
R99I
|
The ratio of R99P to R99D
|
mmžd?C1
|
|
Extreme
precipitation contribution rate index
|
R99C
|
R99P as a percentage of total
annual precipitation
|
%
|
4.2 Data Results
4.2.1
Extreme Precipitation Threshold Values for Each
Station
The
distribution of extreme precipitation threshold values for all stations is
shown in Figure 2. The minimum and maximum threshold values were 7.84 mm in
Xiaozaohuo (Qaidam Basin) and 51.90 mm in Gongshan (Hengduan Mountain area),
respectively, and the average value was 23.11 mm. The spatial distribution of
extreme precipitation threshold indicates a decreasing trend in threshold value
moving from southeast to northwest.
4.2.2 Extreme Precipitation Indexes and Their Spatial Distributions
The
extreme precipitation index ranged from 26.32?C53.04 mm with an average of 37.59
mm. The extreme precipitation frequency index ranged from 0.82?C1.55 days with an average of 1.22
days. The extreme precipitation intensity index ranged from 27.33?C33.61 mm??d−1
with an average of 30.79 mm??d−1. The contribution rate of extreme
precipitation index ranged from 5.72%?C10.28% with an average of 7.94%.
The spatial distributions of the four extreme
precipitation indexes are shown in Figure 3. As
shown in Figure 3(a), the annual extreme precipitation index for Qinghai?CTibet
Plateau ranged from 2.11?C139.44 mm. In Gongshan and Bomi, both the precipitation
and extreme precipitation index had high values. However, in Nyalam and Zoige,
although the precipitation was not high, the extreme precipitation index was
high.
|
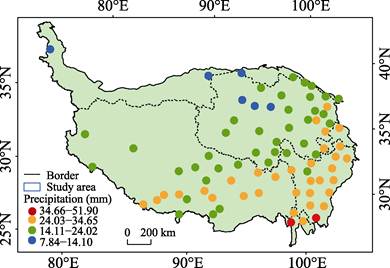
Figure 2 Spatial distribution map of extreme precipitation
threshold in Qinghai?CTibet Plateau[12]
|
The average
annual extreme precipitation frequency at the different stations ranged from
0.14?C2.23 days. From the spatial distribution shown in Figure 3(b), high values
of extreme precipitation frequency were distributed in the Hengduan Mountains,
Zoige Plateau, the southern part of the Qingnan Plateau, and the southern valley
of Tibet. Low levels of extreme precipitation frequency were found in the
Qiangtang Plateau, Kunlun Mountain, and the entire Qaidam Basin.
Extreme
precipitation intensity ranged from 9.81?C62.59 mm??d−1, with large
differences observed among stations. The extreme precipitation intensity was
high in Gongshan, where it reached 62.59 mm??d−1.
The contribution
rate of extreme precipitation index ranged from 7.34%?C14.12%. The stations with
high values were mainly distributed in the southwestern and northern regions of
the plateau (Figure 3(d)). In Qaidam Basin, while the values of the extreme
precipitation and extreme precipitation frequency indexes were not high, the contribution
rate of extreme precipitation index was high. This indicates that while this
area did not have high precipitation, a large proportion of total precipitation
was extreme precipitation.
Figure
3 Spatial
distributions of four extreme precipitation indexes in Qinghai?CTibet Plateau
5 Discussion and Conclusion
Based on meteorological station data, a
dataset describing the temporal and spatial distributions of extreme
precipitation in Qinghai?CTibet Plateau was developed for the time period (1961?C2017).
The percentile threshold method was adopted to determine the threshold of
extreme precipitation at each station, thereby eliminating the effect of spatial
differences in precipitation in the region and allowing the characteristics of
extreme precipitation to be compared among stations. The resulting dataset is a
valuable reference for the study of regional precipitation characteristics. The
dataset provides reference data for the early warning
and forecasting of extreme weather and meteorological disasters and also provides
a basic index for assessing
meteorological disaster risk. This dataset only depicts the temporal and spatial distributions of extreme precipitation of
Qinghai?CTibet Plateau as a whole. To evaluate the characteristics of extreme
precipitation locally or at a certain station, further analyses can be
conducted based on the extreme precipitation events.
The dataset generated in this study reflects
changes in extreme precipitation over time in the study area as a whole or at a
certain station. However, it cannot reflect the changes in extreme
precipitation at high spatial resolution. In the future, spatial interpolation
methods should be considered, and the effects of various influencing factors,
including both natural elements and unnatural elements, should be incorporated
to correct the interpolation results and obtain extreme precipitation data with
higher spatial accuracy.
Author Contributions
Liu, F. G. developed the overall design for the dataset; Zhou, Q. and Ma,
W. D. collected and processed the extreme precipitation data; Chen, Q. designed
the algorithm; and Ma, W. D. wrote the paper.
Conflicts of Interest
The authors
declare no conflicts of interest.
References
[1]
Garca, J., Gallego, M. C., Serrano, A., et
al. Trends in block-seasonal
extreme rainfall over the Iberian Peninsula in the second half of the twentieth
century [J]. Journal of Climate, 2007, 20(1): 113-130.
[2]
UNESCO.
Phase VIII planning of the international hydrological plan (2014-2021) [OL]. 2013.
http://www.unesco.org/new/en/natural-sciences/environment/water/ihp-viii-water-security.
[3]
Zhang, D.
M., Zhang, L. Dialogue with Yao Tangong: approaching the Second Qinghai?CTibet
Plateau Scientific Expedition and Research [J]. Chinese Science Bulletin, 2019, 64(27): 2765-2769.
[4]
Allen, M.
R., Ingram, W. J. Constraints on future changes in climate and the hydrologic
cycle [J]. Nature, 2002, 419(6903): 228-232.
[5]
Gao, M. F.,
Qiu, J. J. Study on characteristics and distribution law of major natural
disasters in Qinghai?CTibet Plateau [J]. Journal of Arid Land Resources and
Environment, 2011, 25(8):
101-106.
[6]
Zhang, Y.
L., Li, B. Y., Zheng, D. Geographic information system data of the scope and
boundary of the Qinghai?CTibet Plateau [J/DB/OL]. Digital Journal of Global Change Data Repository, 2014, https://doi.org/10.3974/geodb.2014.01.12.V1.
[7]
Zhang, Y.
L., Li, B. Y., Zheng, D. The publication of the data of the article ??On the
scope and area of the Qinghai?CTibet Plateau????data from the geographic
information system of the scope and area of the Qinghai?CTibet Plateau [J]. Acta
Geographica Sinica, 2014, 69(Sup.): 65-68.
[8]
Ma, W. D., Liu, F. G., Zhou, Q., et al. Extreme precipitation
dataset on Qinghai?CTibet Plateau (1961?C2017) [J/DB/OL]. Digital
Journal of Global
Change Data Repository, 2021. https://doi.org/
10.3974/geodb.2021.01.10.V1.
[9]
GCdataPR Editorial Office. GCdataPR data sharing
policy [OL]. https://doi.org/10.3974/dp.policy.2014.05
(Updated 2017).
[10]
Zhai, P.
M., Pan, X. H. Extreme events of temperature and precipitation in Northern
China over the past 50 years [J]. Acta Geographica Sinica, 2003, 58(S1):
1-10.
[11] Zhai,
P. M., Wang, C. C., Li, W. Observation of changes in extreme precipitation
events [J]. Climate Change Research,
2007, 3(3): 144-148.
[12]
Ma, W. D., Liu, F. G., Zhou, Q., et al.Characteristics of
extreme precipitation over Qinghai?CTibet Plateau from 1961 to 2017 [J]. Journal
of Natural Resources, 2020, 35(12): 3039-3050.