Artificial Surface Dataset of Urban Changes in 6 Cities in GMS
(1990–2015)
Cao, H.1 Song, W. X.1* He, J.2
1. Key Laboratory of Watershed Geographic Sciences, Nanjing
Institute of Geography and Limnology, Chinese Academy of Sciences, Nanjing
210008, China;
2. School of Economics and Management, Anhui Agricultural
University, Hefei 230036, China
Abstract: Studying the urban
artificial surface dynamics of typical cities in the Greater Mekong Subregion
is of great significance for promoting urbanization and regional sustainable
development. An artificial
surface dataset of urban changes in 6 cities (Xishuangbanna, Yangon, Vientiane,
Phnom Penh, Bangkok and Ho Chi Minh city) in the Greater Mekong Subregion (1990–2015) was developed based on Landsat
TM/ETM+/OLI images and an object-oriented decision classification procedure.
The artificial surface data were validated using in situ data, historical literature, and Google Earth
high-resolution images. The overall accuracy is above 81.73%. The dataset
consists of data covering six time periods from 1990 to 2015 (1990, 1995, 2000,
2005, 2010 and 2015) in 6 cities, including Xishuangbanna, Yangon, Vientiane,
Phnom Penh, Bangkok and Ho Chi Minh city, with a spatial resolution of 30 m. It
is archived in .tif format, with 180 files in total, and the data size is 4.10
MB (compressed to 1 file, 2.49 MB).
Keywords: Greater Mekong Subregion; Landsat; urban artificial
surface; decision classification; 1990–2015
DOI: https://doi.org/10.3974/geodp.2023.01.05
CSTR: https://cstr.escience.org.cn/CSTR:20146.14.2023.01.05
Dataset Availability Statement:
The dataset supporting this paper was
published and is accessible through the Digital Journal of Global Change Data
Repository at: https://doi.org/10.3974/geodb.2023.02.04.V1 or https://cstr.escience.org.cn/CSTR:20146.11.2023.02.04.V1.
1 Introduction
Urban
expansion encompasses the process by which natural landscapes are gradually
eroded, occupied, and transformed by artificial landscapes due to human
activities and the process by which natural and ecological systems transform
into socioecological coupling systems. The main landscape characteristic of
urban expansion is the transformation of non-artificial surfaces to all types
of urban artificial surfaces. The dynamics of urban artificial surfaces, which
serve as important indicators of urban development and urbanization levels, are
popular research topics regarding urban land use.
The Greater
Mekong Subregion (GMS), including China (Yunnan and Guangxi), Myanmar, Laos,
Thailand, Cambodia and Vietnam, is a hotspot of global biodiversity and
ecosystem protection and the key region of the Belt and Road Initiative and
Lancang-Mekong Cooperation strategies[1]. The social
and economic development level of the Greater Mekong Subregion is lower compared
to the rest of Asia and the world. The extreme urban polarization phenomenon
has created situations in which a typical city can affect the overall economy
of a country or region[2, 3]. Urbanization is considered a
necessary process and an effective measure to promote economic growth,
industrialization and modernization in GMS[4]. Therefore,
studying the urban expansion/artificial surface dynamics of typical cities in
the Greater Mekong Subregion is of great significance for understanding
urbanization processes and trends and their possible impacts on the ecological
environment; this information can promote sustainable development through
effective urban planning and management in this region[5].
This study
selected Xishuangbanna Dai autonomous prefecture (Yunnan province, hereinafter
referred to as Xishuangbanna), Yangon (Myanmar), Vientiane (capital of Laos),
Bangkok (capital of Thailand), Phnom Penh (capital of Cambodia), and Ho Chi
Minh city (Vietnam) as typical cities. A decision classification procedure was
applied to Landsat series remote sensing images of these cities from 1990 to
2015 to produce a dataset comprising urban artificial surfaces. High
classification accuracy was guaranteed through field survey verification,
comparison of high-resolution remote sensing images, and visual modification.
This study, to some extent, has filled the data gaps in the long-term series of
urban artificial surface dynamics of typical cities in GMS and can contribute
to urban planning and sustainable development policy formulation in this
region.
2 Metadata of the Dataset
The
metadata of the Artificial surface dataset of urban changes in 6 cities in the
Greater Mekong subregion (1990-2015)[6]
are summarized in Table 1. They include the dataset full name, short name,
authors, year of the dataset, temporal resolution, spatial resolution, data
format, data size, data files, data publisher, and data sharing policy, etc.
3 Methods
3.1 Data Sources
The
administrative boundary of Xishuangbanna was obtained from the National Catalog
Service for Geographic Information,
and the administrative boundaries of other cities were downloaded from the
Database of Global Administrative Areas (GADM).
Approximately 150 remote sensing images acquired from Landsat TM/ETM+/OLI
sensors
were used for urban artificial surface interpretation of the typical cities inGMS.
Considering the availability, quality and land use phenological characteristics
of remote sensing images, the images of Xishuangbanna were acquired mainly in
February and March (with a few in January and April). The images of other
cities were acquired in both the dry season and wet season. Generally, images
in the dry season were acquired from early December to the end of March of the
next year, while images in the wet season were acquired from early September to
the end of November.
Table 1 Metadata summary of the Artificial surface dataset of
urban changes in 6 cities in the Greater Mekong subregion (1990-2015)
|
Items
|
Description
|
|
Dataset full name
|
Artificial
Surface Dataset of Urban Changes in 6 Cities in the Greater Mekong Subregion
(1990-2015)
|
|
Dataset short
name
|
GMS_ArtificialSurface_1990-2015
|
|
Authors
|
Cao, H., Nanjing
Institute of Geography and Limnology, Chinese Academy of Sciences,
hcao@niglas.ac.cn
Song, W. X., Nanjing
Institute of Geography and Limnology, Chinese Academy of Sciences,
wxsong@niglas.ac.cn
|
|
|
He, J., Anhui
Agricultural University, 754147782@qq.com
|
|
Geographical
region
|
Greater Mekong
Subregion
|
|
Year
|
1990, 1995, 2000,
2005, 2010, 2015
|
|
Temporal resolution
|
Five years
|
|
Spatial
resolution
|
30 m
|
|
Data format
|
.tif
|
|
|
|
Data size
|
2.49 MB
(compressed)
|
|
|
|
Data files
|
180 files in
total; data file naming rule is “city+year”
|
|
Foundation
|
National Natural
Science Foundation of China (41561144012)
|
|
Data publisher
|
Global Change Research Data Publishing & Repository,
http://www.geodoi.ac.cn
|
|
Address
|
No. 11A, Datun
Road, Chaoyang District, Beijing 100101, China
|
|
Data sharing
policy
|
Data from the Global Change Research Data
Publishing & Repository includes
metadata, datasets (in the Digital Journal of Global Change Data Repository),
and publications (in the Journal of Global Change Data & Discovery).
Data sharing policy
includes: (1) Data are openly
available and can be free downloaded via the internet; (2) End users are encouraged
to use Data subject to citation;
(3) Users, who are by definition also value-added service providers, are
welcome to redistribute Data
subject to written permission from the GCdataPR Editorial Office and the
issuance of a Data redistribution
license; and (4) If Data are used
to compile new datasets, the ‘ten percent principal’ should be followed such
that Data records utilized should
not surpass 10% of the new dataset contents, while sources should be clearly
noted in suitable places in the new dataset[7]
|
|
Communication and searchable system
|
DOI, CSTR, Crossref, DCI, CSCD, CNKI,
SciEngine, WDS/ISC, GEOSS
|
All downloaded
Landsat images are L1T products with system correction, radiometric correction,
geometric correction and terrain correction and meet the accuracy requirements
of remote sensing interpretation. Few images with complex terrain were
orthorectified using DEM and Google Earth high-resolution images. All of the
above images were processed with band combination and image mosaic, resampled to
30 m, and clipped according to the administrative extents of typical cities.
3.2 Data Processing
This
study applied an object-oriented classification method to extract the urban
artificial surfaces of typical cities, and the classification process was carried
out in eCognition 8.7 software. The images were first segmented into
homogeneous polygons, and then polygon samples of urban artificial surfaces and
non-urban artificial surfaces were selected. The urban artificial surfaces of
typical cities were then identified through a decision classification procedure
(Figure 1) based on sample shape, texture, spatial location, band attribute and
other characteristics. To ensure accuracy, the classification results were
visually modified, in combination with field surveys, historical literature,
and Google Earth high-resolution images.
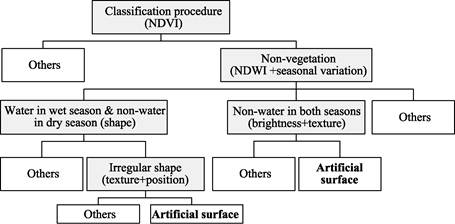
Figure 1 Decision classification procedure of the
dataset development
4 Data Results and Validation
4.1 Data Composition
Artificial
surface dataset of urban changes in 6 cities in the Greater Mekong subregion
(1990-2015) consists of urban artificial
surface data covering six time periods from 1990 to 2015 (1990, 1995, 2000,
2005, 2010 and 2015) in 6 cities, including Xishuangbanna, Yangon, Vientiane,
Phnom Penh, Bangkok and Ho Chi Minh city, with a spatial resolution of 30 m.
The dataset is archived in .tif format, with 180 files in total (Figure 2).
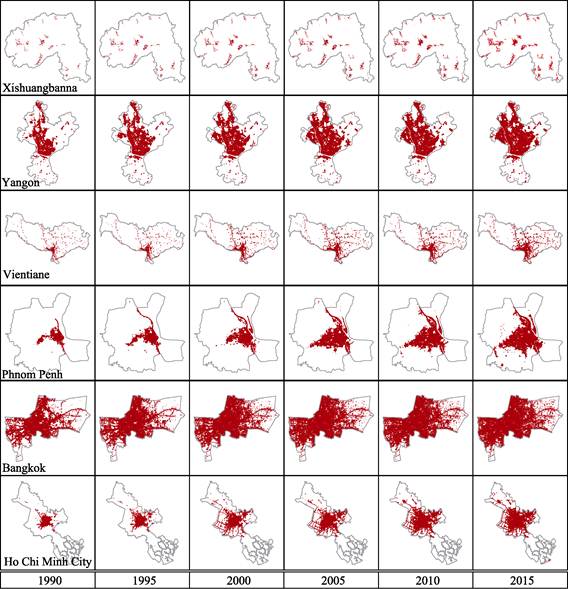
Figure 2 Maps
of urban artificial surface for the typical cities in GMS
4.2 Data Products
Figure
3 and Table 2 show the area and spatial changes in the urban artificial surface
of typical cities in GMS from 1990 to 2015. Bangkok, an international
metropolis, has an urban artificial surface area significantly higher than that
of other cities. In 2015, the urban artificial surface area of Bangkok reached
approximately 720 km2. Ho Chi Minh city is the second largest city
in terms of urban artificial surface area among the typical cities in GMS. In
2015, its urban artificial surface area exceeded 450 km2. Since a
large number of satellite cities have been built around the urban center of
Yangon, the urban artificial surface area of Yangon in 2015 was greater than
360 km2. The urban artificial surface areas of both Xishuangbanna
and Vientiane were approximately 230 km2. Phnom Penh had the smallest
urban artificial surface area among the typical cities, which slightly exceeded
120 km2 in 2015.
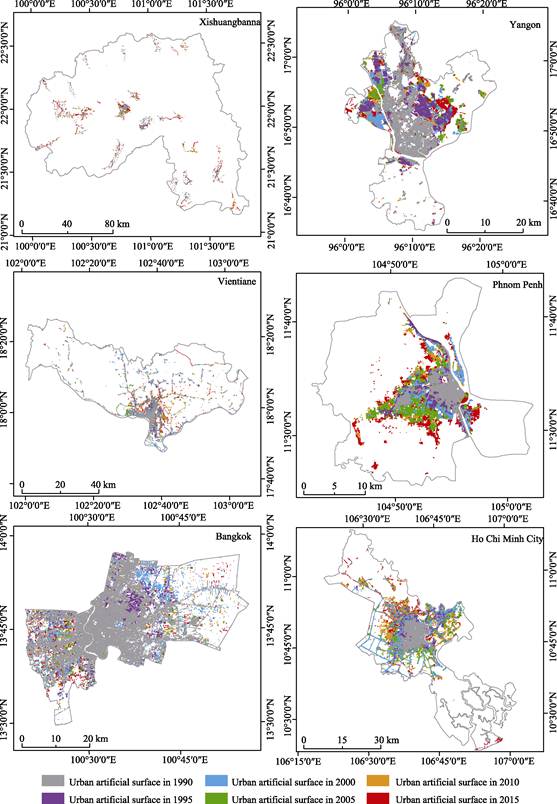
Figure 3 Maps of spatial dynamics of urban artificial surface
for the typical cities in GMS (1990-2015)
The urban
artificial surface of Xishuangbanna expanded the fastest among the typical
cities, increasing from 40.74 km2 in 1990 to 222.38 km2
in 2015, with an annual expansion rate of approximately 18%. From 1990 to 2015,
the area of urban artificial surface in Phnom
Table 2 Variation in urban artificial surface area (unit: km2)
for the typical cities in the Greater Mekong Subregion during 1990-2015
|
Cities
|
1990
|
1995
|
2000
|
2005
|
2010
|
2015
|
|
Xishuangbanna
|
40.74
|
65.82
|
89.94
|
112.53
|
152.61
|
222.38
|
|
Yangon
|
155.42
|
224.99
|
261.72
|
298.67
|
317.21
|
362.6
|
|
Vientiane
|
61.91
|
82.57
|
139.51
|
173.92
|
201.38
|
233.45
|
|
Bangkok
|
513.98
|
570.29
|
639.97
|
665.13
|
691.14
|
719.88
|
|
Phnom Penh
|
30.31
|
44.65
|
59.8
|
89.34
|
98.33
|
123.48
|
|
Ho Chi Minh city
|
109.08
|
151.32
|
257.36
|
334.85
|
409.76
|
451.61
|
Penh
and Ho Chi Minh city increased by 90 km2 and 340 km2,
respectively, with an annual expansion rate of nearly 12.5%. Furthermore, the
annual expansion rate of urban artificial surface in Vientiane also exceeded
11%. The areas of urban artificial surface in both Yangon and Bangkok increased
by more than 200 km2 from 1990 to 2015. However, due to the large
urban artificial surface areas of Yangon and Bangkok in 1990, their annual
expansion rates were lower. In particular, the urban artificial surface area of
Bangkok exceeded 510 km2 in 1990, while its annual expansion rate
was only 1.6%.
In regard to
urban expansion direction, Xishuangbanna mainly expanded toward the northwest
(Jinghong Industrial Park) and southwest (the airport and surrounding regions),
which is basically in line with the spatial layout of urban development
determined in the Jinghong Urban Master Plan (1999-2020). The urban artificial surface of Yangon is distributed
primarily on the north bank of the Yangon River in the urban center-Inya
Lake-airport direction. In 2015, the artificial surface extended to the
vicinity of Hlawga Lake. The most obvious urban expansion in Yangon is the
development of a large number of satellite cities. They have been used to
settle the urban poor living in squatter areas; additionally, many industrial
parks are distributed in these satellite cities as a result of small
enterprises relocation[8]. Vientiane’s urban artificial surface
is mainly distributed along the Mekong River in the shape of a right angle.
From 1990 to 2015, Vientiane’s urban expansion was significantly affected by
traffic conditions. The newly built artificial surface is mainly distributed
along National Highway Line 1, Line 10, Line 13N, Line 13S and the railway to
Thailand[9]. Influenced by natural conditions and administrative boundaries, the
urban artificial surface of Bangkok is distributed on both sides of the Chao
Phraya River and in recent decades has mainly expanded to the eastern and
western peripheral areas[1]. In the past decades, Phnom Penh
expanded mostly along the International Airport and the National Highway Line 4
(connecting Sihanouk Port). A large number of garment factories have moved to
this area for cost and transportation reasons[10]. The
expansion of artificial surface in Ho Chi Minh city is relatively scattered. In
addition, the urban sprawl of Ho Chi Minh city is obvious, supposedly a result
of the concentration of foreign capital investment in real estate projects
outside the urban area[11].
4.3 Data Validation
This
study verified the accuracies of urban artificial surface classification
results of the typical cities in GMS on the basis of field surveys to Laos,
Thailand, Cambodia, Vietnam and Xishuangbanna in January, March and May 2016;
Google Earth’s historical high-resolution images; and papers, reports, books
and other literature with historical land use/planning maps. Table 3 shows the
classification accuracies of urban artificial surfaces for the typical cities
in GMS in different years. Among the cities, Xishuangbanna has relatively rich
historical data such as maps, plans and papers that can assist in visual
modification for which the classification accuracies are relatively high. Prior
to 2000, there were no historical high-resolution images and fewer relevant
studies. Therefore, the classification accuracies of urban artificial surfaces
for most typical cities after 2005 are higher. In general, the dataset of urban
artificial surfaces for the typical cities in GMS is of high accuracy and
quality.
Table 3 Classification accuracies (unit:
%) of urban artificial surfaces for the typical cities in the Greater Mekong subregion
during 1990-2015
|
Cities
|
1990
|
1995
|
2000
|
2005
|
2010
|
2015
|
|
Xishuangbanna
|
92.12
|
92.50
|
93.85
|
94.42
|
91.73
|
94.23
|
|
Yangon
|
81.73
|
86.73
|
83.65
|
92.50
|
91.54
|
96.92
|
|
Vientiane
|
91.36
|
93.18
|
91.82
|
90.23
|
86.14
|
87.27
|
|
Bangkok
|
83.93
|
89.82
|
88.21
|
89.82
|
90.00
|
95.18
|
|
Phnom
Penh
|
89.33
|
94.22
|
91.33
|
94.67
|
91.56
|
89.33
|
|
Ho
Chi Minh city
|
85.94
|
91.62
|
87.50
|
83.53
|
91.91
|
91.41
|
5 Discussion and
Conclusion
The GMS is one of the key regions of the Belt and Road
Initiative and Lancang-Mekong Cooperation strategies. Mapping the urban
artificial surfaces of typical cities in the region is of great significance
for promoting urbanization and regional sustainable development. The artificial
surface dataset of urban changes in 6 cities in GMS (1990-2015) consists of
urban artificial surface data of Xishuangbanna, Yangon, Vientiane, Phnom Penh,
Bangkok and Ho Chi Minh city in 1990, 1995, 2000, 2005, 2010 and 2015,
respectively. Based on the Landsat series images, this dataset applied the object-oriented
decision classification procedure to identify urban artificial surfaces of six
the typical cities. Combined with visual modification, the dataset has achieved
high accuracy. It can directly reflect urban artificial surface dynamics in
terms of area and spatial distribution and support further studies of urban
growth patterns, ecological environment effects and sustainable development
planning policies of the typical cities in GMS.
Author Contributions
Cao, H. and Song, W. X. designed the algorithms of
the dataset. Song, W. X. and He, J. contributed to the data processing and
analysis. Cao, H. wrote the data paper.
Conflicts of Interest
The
authors declare no conflicts of interest.
References
[1]
Cao, H., Liu, J., Chen, J. L., et al. Spatiotemporal patterns of urban
land use change in typical cities in the Greater Mekong subregion (GMS) [J]. Remote Sensing, 2019, 11(7): 801–828.
[2]
Rao, B. Z. The analysis of the
centralized urbanization in Southeast Asia [J]. Urban Problems, 2004(5): 69–71.
[3]
Wang, Y., Zhang, H. O., Huang,
G. Z., et al. Different
characteristics and driving factors of the comprehensive urbanization levels of
countries in Southeast Asia [J]. Tropical
Geography, 2015, 35(5): 680–686.
[4]
Song, W. X., Zhu, X. G.
Characteristics and causes of the urban spatial structure in Greater Mekong
Subregion [J]. Economic Geography,
2010, 30(1): 53–58.
[5]
Cao, H., Chen, J. L., Chen, C.,
et al. Identification of
multi-temporal urban growth patterns with a modified urban growth index: case
study of three fast growing cities in the Greater Mekong Subregion (GMS) [J]. Ecological Indicators, 2022, 142:
109206.
[6]
Cao, H., Song, W. X., He, J.
Artificial surface dataset of urban changes in 6 cities in the Greater Mekong
Subregion (1990-2015) [J/DB/OL]. Digital Journal of Global Change Data Repository, 2023. https://doi.org/10.3974/geodb.2023.02.04.V1.
https://cstr.escience.org.cn/CSTR:20146.11.2023.02.04.V1.
[7]
GCdataPR Editorial Office.
GCdataPR data sharing policy [OL]. https://doi.org/10.3974/dp.policy.2014.05
(Updated 2017).
[8]
Boutry, M., Sone, K. P., Par,
S. C., et al. Land dynamics and
livelihoods in peri-urban Yangon [R]. 2015.
[9]
Dao, K. Analysis of urban
development based on the GIS technology-a case study of Vientiane [D]. Lanzhou:
Lanzhou University, 2014.
[10]
Mialhe, F., Gunnell, Y.,
Navratil, O., et al. Spatial growth
of Phnom Penh, Cambodia (1973–2015): patterns, rates, and socio-ecological
consequences [J]. Land Use Policy,
2019, 87: 104061.
[11]
Kontgis, C., Schneider, A., Fox,
J., et al. Monitoring
peri-urbanization in the greater Ho Chi Minh city metropolitan area [J]. Applied Geography, 2014, 53: 377–388.