Soil Conservation Dataset Covering National Ecological
Barrier Zone at 1-km Resolution (2000?C2015)
Wang, Y.1 Wang,
X. F.2,3* Yin, L. C.4
1. School
of Earth Science and Resources, Chang??an University, Xi??an 710054, China;
2. The
College of Land Engineering, Chang??an University, Xi??an 710064, China;
3. The Key
Laboratory of Shaanxi Land Consolidation Project, Chang??an University, Xi??an
710064, China;
4. Key
Laboratory of Land Surface Pattern and Simulation, Institute of Geographic
Sciences and Natural Resources Research, Chinese Academy of Sciences, Beijing
100101, China
Abstract:
Ecosystem services are the benefits that ecosystem provides
to human beings. As one of the main regulation services provided by the
terrestrial ecosystem, soil conservation is an important guarantee to prevent
regional land degradation and reduce the frequency of flood disasters, which is
often expressed as the value of soil conservation. The national ecological
barrier zone (NEBZ), known as ??two barriers and three belts??, established the
national ecological security pattern. Exploring the spatiotemporal distribution
of soil conservation in the barrier area is of far-reaching significance for
China??s ecological civilization construction and sustainable development. Based
on the revised universal soil loss equation (RUSLE), the soil conservation
dataset (2000-2015)
with a resolution of 1 km in NEBZ was quantitatively evaluated using MOD13A2
NDVI, ASTER GDEM, meteorological station data and soil dataset of China, etc.
The data is archived in .tif format. The spatial resolution of the data is 1 km,
and data size is 168 MB in compress.
Keywords: national
ecological barrier zone; ecosystem service; soil conservation; RUSLE model
Dataset Availability Statement:
The dataset supporting this paper was
published and is accessible through the Digital
Journal of Global Change Data Repository at: https://doi.org/10.3974/geodb.2020.03.19.V1.
1
Introduction
As an
important ??directional flow service??,
soil conservation (SC) is the regulation and control capabilities of the
ecosystem to prevent soil erosion, and the ability to store and maintain
sediment in rivers, lakes, wetlands, and reservoirs[1]. Under the joint
influence of climate change and human activities, the risk of global soil
erosion is aggravating, and the soil conservation capacity is facing severe
challenges[2-3]. As a country with a large population and
agriculture, China is also one of the countries with the most severe soil
erosion in the world[4]. The increasingly serious soil erosion is
the concentrated manifestation of various ecological problems in China, and
poses an acute threat to food security, ecological security, and the
sustainable development of the social economy. Therefore, as an important
material basis for human survival, more and more attention has been paid to the
function of soil conservation that has become a research hotspot in the fields
of geography and ecology[5].
In December 2010??the State Council of China launched
the national ecological security strategic pattern project, in
which the construction framework of ??two
barriers and three belts?? was
mentioned. In response to the call of national policy, Fan et al.[6] proposed national
barrier plan on the basis of national major function oriented zoning. On the
basis of ensuring the integrity of counties, Fu et al.[7] described the scope of NEBZ and carried out
comprehensive assessment of ecosystem services from 2000 to 2010. The
geographical regions of NEBZ include the northern sand belt, the ecological
barrier of the Qinghai Tibet Plateau, Sichuan Yunnan-loess plateau ecological
barrier, the southern hill and mountain belt, and the northeastern forest zone.
Quantitative analysis of soil conservation with long time series in the barrier
area not only helps to reveal the spatiotemporal distribution and evolution of
soil conservation, but also provides theoretical basis for ecological
construction and the sustainable development of China. This dataset was
evaluated under the support of the national key research and development
project. The main purpose of this dataset is to construct the long time series
products of soil conservation in NEBZ, to carry out researches on trade-offs and synergies of
ecosystem services, and to ensure human rights and well-being. The 1-km
spatial resolution_2000-2015_SC product of national barrier zone product is an
important output of ecosystem service science in barrier area, and it is also
an important digital resource for monitoring and evaluating soil conservation
and evolution of ecological environment. In this paper, we aimed to introduce
detailed information of the data, the basic principle of the data algorithm and
the data results, and make a comparative analysis of the data, so as to
evaluate its accuracy.
2
Metadata of the Dataset
The name, short name, authors, geographical
region, data age, data resolution, data format, publisher and sharing policy,
and related information of the ??National ecological barrier zone 1-km
resolution soil conservation dataset (2000?C2015)??[8] are listed in Table
1.
3
Methods
3.1 Study Area
(1) NDVI data applied a 16-day composite product
of MOD13A2 1 km vegetation index from 2000 to 2015[10]. After
format conversion, annual maximum value composite, clipping and projection
conversion, the annual NDVI of the study area was obtained. This dataset was
adopted to calculate the vegetation coverage factor in RUSLE model.
(2) DEM data utilized ASTER global digital
elevation model data (ASTER GDEM)[11]. The spatial resolution is 90m. According to
the data, ArcGIS10.2 software was used to
calculate the slope and slope length.
(3) Monthly climate dataset was downloaded from
China meteorological data sharing network[12]. The rainfall
data was extracted from it, and the software ANUSPLIN [13] was used
for interpolation to obtain the rainfall raster data with a spatial resolution
of 1km and was used to calculate the rainfall erosivity factor in RUSLE model.
Table 1 Metadata summary of the ??Soil conservation grid yearly dataset in the national barrier zone of China
(2000-2015)??
|
Items
|
Description
|
|
Dataset full name
|
Soil conservation
grid yearly dataset in the national barrier zone of China
(2000-2015)
|
|
Dataset short name
|
NBZ_SC_1km_2000-2015
|
|
Authors
|
Wang, Y. AAS-5036-2020,
School of Earth Science and Resources, Chang??an University,
wangyichangan134@163.com
Wang, X. F. AAS-5271-2020,
The College of Land Engineering; the Key Laboratory of Shaanxi Land
Consolidation Project, Chang??an University, wangxf@chd.edu.cn
Yin, L. C. AAS-4914-2020,
Key Laboratory of Land Surface Pattern and Simulation, Institute of Geographic
Sciences and Natural Resources Research, Chinese Academy of Sciences; University
of Chinese Academy of Sciences, yinlichang3064@163.com
|
|
Geographical
region
|
The provinces include
Heilongjiang, Jilin, Qinghai, Gansu, Sichuan, Xinjiang, Inner Mongolia,
Hebei, Liaoning, Tibet, Ningxia, Yunnan, Guangxi, Guangdong, Guizhou, Hunan,
Jiangxi, and Shanxi
The northern sand belt (36??45¢N-45??06¢N,
75??50¢E-124??18¢E)
The ecological barrier of
the Qinghai Tibet Plateau (29??40¢N-38??10¢N, 82??50¢E-105??5¢E)
Sichuan Yunnan-Loess Plateau
ecological barrier (24??10¢N-38??50¢N, 99??05¢E-114??25¢E)
The southern hill and
mountain belt (22??45¢N-27??10¢N,
103??10¢E-119??15¢E)
The northeastern forest zone
(40??52¢N-53??34¢N,
118??48¢E-134??22¢E)
|
|
|
Year
|
2000-2015
|
|
Spatial resolution
|
1 km Data format .tif
|
|
Data size
|
168 MB (After compression) Projection
coordinate system WGS_1984_Albers
|
|
Foundations
|
Ministry of Science and
Technology of P. R. China (2018YFC0507300, 2019QZKK0405); Shaanxi Province (2018JM4016)
|
|
Data
publisher
|
Global Change Research Data
Publishing & Repository, http://www.geodoi.ac.cn
|
|
Address
|
No. 11A, Datun Road,
Chaoyang District, Beijing 100101, China
|
|
Data sharing policy
|
Data from the Global Change
Research Data Publishing &Repository includes metadata, datasets (in the Digital Journal of Global Change Data Repository), and
publications (in the Journal of Global Change Data & Discovery). Data
sharing policy includes: (1) Data are openly available
and can be free downloaded via the Internet; (2) End users are encouraged to
use Data subject to citation; (3) Users, who are by definition
also value-added service providers, are welcome to redistribute Data subject
to written permission from the GCdataPR Editorial Office and the issuance of
a Data redistribution license; and (4) If Data are
used to compile new datasets, the ??ten percent principal?? should be followed
such that Data records utilized should not surpass 10% of the
new dataset contents, while sources should be clearly noted in suitable
places in the new dataset[9]
|
|
Communication and searchable system
|
DOI, DCI, CSCD, WDS/ISC, GEOSS,
China GEOSS, Crossref
|
(4) Soil data was collected from China soil
dataset (v1.1) of the harmonized world soil database (HWSD)[14]. Soil types
(sand, silt, clay) content and soil organic carbon content were extracted from
the data to calculate the soil erodibility factor in RUSLE model. All the above
data was uniformly re-sampled to 1 km??1 km, and the
projection coordinate system was Albers_ WGS_ 1984.
3.2 RUSLE Model
The revised universal soil loss equation (RUSLE)
model[15-16] was adopted to estimate soil conservation in NEBZ.
According to the principle of the model, the potential soil erosion (Ap) and actual soil erosion (Ar) of various land use types
were calculated under the conditions of bare land, vegetation cover, and other
engineering measure situation. The formula of soil conservation (Ac) is as follows:
 (1)
(1)
where Ac
is the amount of soil conservation per unit area, and the units of Ac, Ap, andAr
refer to t??km‒2??a‒1; R represents the rainfall erosivity factor (MJ??mm??km‒2??h‒1??a‒1);
K marks soil erodibility factor (t??km2??h??km‒2??MJ‒1??mm‒1);
L and S stand for slope length and slope factor; C means vegetation coverage factor; P indicates conservation support practice factor. The
calculation of each factor is as follows:
(1) The empirical equation proposed by Wischmeier et al.[16] was applied to calculate rainfall erosivity
factor (R). The calculation equation
is as follows:
 (2)
(2)
where p
marks the annual rainfall (mm), and pi
refers to the average monthly rainfall (mm).
(2) According to different soil particle composition content and organic
matter content, the soil erodibility factor (K) was calculated by Williams model[17]. The
calculation equation is as follows:
 (3)
(3)
where SAN, SIL,
and CLA refer to sand, silt, and clay
content (%), respectively. TOC represents
organic matter content (%), and SNI =
1-SAN/100.
(3) The slope
length factor (L) was calculated with
the method proposed by Wischmeier
et al.[16], and the
calculation equation is defined as follows:

 (4)
(4)

where ??
marks the slope length extracted from DEM; m
represents the slope length index, and ??
stands for the slope value extracted from DEM.
The slope factor (S) was
extracted by the slope equation proposed by Zhang et al.[18], and the specific calculation equation is as
follows:
 (5)
(5)
where ??
represents the same as equation (4).
(4) C marks the vegetation
coverage factor. The calculation equation was proposed by Caiet al[19].
 (6)
(6)
where NDVI represents the
normalized vegetation index and f means the fraction of vegetation.
(5) The soil and water conservation measure factor (P) was defined as follows[20-21]:
 (7)
(7)
where ??
refers to the slope index.
4 Data Results and Validation
4.1 Dataset Composition
The NBZ_SC_1km_2000-2015
dataset is the annual soil conservation data of NEBZ in ArcGIS TIFF format from
2000 to 2015. The spatial resolution is 1 km (unit: t??km‒2??a‒1), and the
projection coordinate system is WGS_1984_Albers. The total amount of compressed
data is 168 MB. After decompressing, the data can be applied in ArcGIS software.
4.2 Data Results
The spatial
distribution of soil conservation at 1-km resolution in NEBZ from 2000 to 2015
is displayed in Figure 1. From 2000 to 2015, the average value is 2,996.49 t??km‒2??a‒1
that is higher in the southeast and lower in the northwest. That is, the
high-value areas are concentrated in the Sichuan Yunnan-loess plateau
ecological barrier and the southern hill and mountain belt, the middle value is
distributed in the northeastern forest zone and the southeast of the Qinghai
Tibet plateau ecological barrier, while the low-value areas are located in the
northwest of the Qinghai Tibet Plateau ecological barrier and the northern sand
belt.
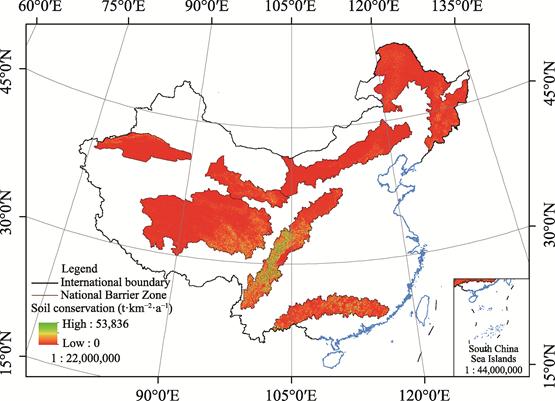
Figure 1 Spatial distribution of soil conservation
in the national ecological barrier zone (2015)
From 2000 to 2015, soil conservation increased in most of the study
area (84.7%). Apart from some parts of the ecological barrier area of the
Qinghai Tibet Plateau, the soil conservation of other sub barriers increased
significantly (p<0.05), and the
regions with higher growth rates were concentrated in the middle part of the
Sichuan Yunnan-Loess Plateau ecological barrier.
4.3 Data Validation
By consulting
literatures, we compared the similar data (annual soil conservation in different
years) in this region to verify and evaluate the accuracy of soil conservation
in NEBZ. A total of 17 relevant data (Table 2) were collected, and their
quantitative models were all based on RUSLE. No.1-13 are the annual average value of soil conservation in the Three-River
Headwaters region of the Qinghai Tibet Plateau ecological barrier from 2000 to
2012[22]. The last four are
the annual soil conservation values of the same region in 2000, 2005, 2010, and
2015[23]. The results prove
that the absolute value of relative error between the two data fluctuates from
6.98-993.32 t??km‒2??a‒1,
and the percentage of relative error is mostly less than 20%. After
calculation, the RMSE of this dataset is 431.16, and the overall accuracy is
82.74% (1 minus RMSE divided by the average value of soil conservation simulation
data). Therefore, the acquisition of soil conservation results based on this
technical process have high correlation with similar data, which can accurately
reflect the changing trend of soil conservation in NEBZ in recent years from a
macro perspective.
Table 2 Comparative analysis of data validation
for soil conservation
|
No.
|
Average annual value (t??km‒2??a‒1)
|
Dataset (t??km‒2??a‒1)
|
Relative error (t??km‒2??a‒1)
|
Relative error (%)
|
|
1
|
1,983.47
|
2,454.37
|
470.90
|
19.19
|
|
2
|
1,846.34
|
2,482.97
|
636.63
|
25.64
|
|
3
|
2,169.57
|
2,326.17
|
156.59
|
6.73
|
|
4
|
2,600.55
|
2,498.71
|
‒101.84
|
‒4.08
|
|
5
|
2,747.47
|
2,518.09
|
‒229.39
|
‒9.11
|
|
6
|
2,767.06
|
2,662.07
|
‒104.99
|
‒3.94
|
|
7
|
2,149.98
|
2,358.90
|
208.92
|
8.86
|
|
8
|
3,491.89
|
2,558.02
|
‒933.87
|
‒36.51
|
|
9
|
2,698.50
|
2,582.31
|
‒116.19
|
‒4.50
|
|
10
|
3,011.94
|
2,760.14
|
‒251.80
|
‒9.12
|
|
11
|
3,580.04
|
2,586.72
|
‒993.32
|
‒38.40
|
|
12
|
2,933.58
|
2,556.55
|
‒377.03
|
‒14.75
|
|
13
|
2,904.19
|
2,561.50
|
‒342.69
|
‒13.38
|
|
14
|
2,454.37
|
2,060.76
|
‒393.61
|
‒19.10
|
|
15
|
2,662.07
|
2,463.29
|
‒198.78
|
‒8.07
|
|
16
|
2,586.72
|
2,579.75
|
‒6.98
|
‒0.27
|
|
17
|
2,411.76
|
2,448.10
|
36.34
|
1.48
|
5 Discussion and Conclusion
The RUSLE model was used to calculate the potential
and actual soil erosion, and soil conservation modeling research was carried
out, based on remote sensing, meteorology, topography, soil type, and other
data. Compared with the existing similar products, the consistency between them
is strong, indicating that the dataset has high accuracy and can meet the
design goals. The soil conservation dataset of national ecological barrier zone
with 1-km spatial resolution from 2000 to 2015 reveals the
spatiotemporal distribution of soil conservation in ??two
barriers and three belts?? and the soil conservation benefits of the barrier
area in recent years. It can provide reliable basic data and information for
the sustainable development of ecosystem in China.
Author Contributions
Wang, Y. designed
the overall dataset development, designed the model and algorithm, did the data
validation, and wrote this data paper. Wang, X. F. collected and processed the
data, and wrote the paper. Yin, L. C. collected and processed the data.
References
[1]
Liu, Y., Zhao, W. W., Jia, L.
Z. Soil conservation service: concept, assessment, and outlook [J]. Acta Ecologica
Sinica, 2019, 39(2): 432‒440.
[2]
Reid, W. V., Mooney, H. A.,
Cropper, A., et al. Millennium ecosystem assessment synthesis report [R].
http://www.millenniumassessment.org. March 23, 2005.
[3]
Wall, D. H., Six, J. Give soils
their due [J]. Science, 2015, 347(6223): 695.
[4]
Zhen, F. L., Wang, Z. L., Yang,
Q. K. The retrospection and prospect on soil erosion research in China [J]. Chinese
Journal of Nature, 2008(1): 12-16, 63.
[5]
Sheng, L., Jin, Y., Huang, J.
F. Value estimation of conserving water and soil of ecosystem in China [J]. Journal
of Natural Resources, 2010, 25(7): 1105‒1113.
[6]
Fan,
J. Draft of major function oriented zoning of China [J]. Acta Geographica Sinica,
2015, 70(2): 186‒201.
[7]
Fu, B. J., Wang, X. F., Feng,
X. M., et al. National Barrier Zone Ecosystem Assessment [M]. Beijing:
Science Press, 2016: 271‒345.
[8]
Wang, Y., Wang, X. F., Yin, L.
C. Soil conservation grid yearly dataset in the national barrier zone of China
(2000-2015) [J/DB/OL]. Digital Journal of Global Change Data Repository, 2020. https://doi.org/
10.3974/geodb.2020.03.19.V1.
[9]
GCdataPR
Editorial Office. GCdataPR data sharing policy [OL]. https://doi.org/10.3974/dp.policy.2014.05
(Updated 2017).
[10]
NASA MODIS Data Service [DB/OL]. https://modis.gsfc.nasa.gov/data/.
[11]
ASTER Global Digital Elevation Model V002 [DB/OL]. http://gdem.ersdac.jspacesystems.or.jp/.
[12]
China Meteorological Data Service Centre [DB/OL]. http://www.nmic.cn/.
[13]
Hijmans, R. J., Cameron, S. E.,
Parra, J. L., et al. Very high resolution interpolated climate surfaces
for global land areas [J]. International Journal of Climatology, 2005,
25(2): 1965‒1978.
[14]
http://www.fao.org/home/en/.
[15]
Zhang, L. W., Fu, B. J., L??, Y.
H., et al. Balancing multiple ecosystem services in conservation priority
setting [J]. Landscape ecology, 2015, 30(3): 535‒546.
[16]
Wischmeier, W. H., Smith, D. D. Predicting rainfall-erosion losses from
cropland east of the Rocky Mountains: Guide for selection of practices for soil
and water conservation (No. 282) [Z]. Agricultural Research Service, US
Department of Agriculture. (1965).
[17]
William,
J. R., Arnold, J. G., A system of erosion??sediment yield models [J]. Soil
Technology, 1997, 11(1): 43-55.
[18]
Liu, B. Y., Nearing, M. A.,
Risse, L. M. Slope gradient effects on soil loss for steep slopes [J]. Transactions
of the ASAE, 1994, 37(6): 1835‒1840.
[19]
Cai,
C. F., Ding, S. W., Shi, Z. H., et al. Study of applying USLE and
geographical information system IDRISI to predict soil erosion in small
watershed [J]. Journal of Soil and Water Conservation, 2000(2): 19‒24.
[20]
Lufafa, A., Tenywa, M. M.,
Isabirye, M., et al. Prediction of soil erosion in a Lake Victoria basin
catchment using GIS-based universal soil loss model [J]. Agricultural
Systems, 2003, 76(3): 883‒894.
[21]
Fu, B. J., Liu, Y., L??, Y. H., et
al. Assessing the soil erosion control service of ecosystems change in the
Loess Plateau of Chin a[J]. Ecological Complexity, 2011, 8: 284‒293.
[22]
Jiang, C., Li, D., Wang, D., et
al. Quantification and assessment of changes in ecosystem service in the
Three-River Headwaters region, China as a result of climate variability and
land cover change [J]. Ecological Indicators, 2016, 66: 199‒211.
[23]
Li, F. J., Sun, Q. Y., Wang, S.
X., et al. Valuation of ecosystem services in Three-River Headwaters
Region from 2000 to 2015 [J]. Journal of Environmental Engineering
Technology, 2020, 10(5): 786‒797.