China’s
Terrestrial UNVI Multidimensional Dataset (2018–2021)
Zhao, H. Q.1 Liu, X. Q.1 Zhang, L. F. 2* Chen, J. H. 2 Fu, H. C.1 Ma, K.1
1. College
of Geoscience and Surveying Engineering, China University of Mining and
Technology (Beijing), Beijing 100083, China;
2.
Aerospace Information Research Institute, Institute of Remote Sensing and
Digital Earth, Chinese Academy of Sciences, Beijing 100101, China
Abstract: Vegetation index data products are widely used in
the inversion of physical and chemical parameters of vegetation, land cover
classification and change studies. Traditional vegetation index
products, such as AVHRR-NDVI, are sensitive to soil background changes and have
the problem of high value saturation, which easily causes a decrease in sensitivity
to vegetation detection. China’s terrestrial UNVI multidimensional dataset
(2018–2021) was developed based on the MODIS surface reflectance product
MOD09GA using the Universal Pattern Decomposition algorithm UPDM (Universal
Pattern Decomposition Method), which takes 16 days as the synthesis cycle. The
practices show that the UNVI has more advantages in reflecting the change in
vegetation cover and quantitative inversion of vegetation physical and chemical
parameters compared with traditional NDVI products. The synthesis algorithm
takes the number of days without cloud data in the synthesis period N as the
judgment condition and uses the angle normalized synthesis method, the maximum
synthesis method in a limited perspective, the direct calculation method and
the maximum synthesis method MVC as the main synthesis algorithm to calculate
the UNVI. Thus, the 2018–2021 China terrestrial UNVI products with a time
resolution of 16 d and a spatial resolution of approximately 463 m were
synthesized. The dataset includes the UNVI products of China terrestrial
vegetation indices in 23 time periods with 16 d intervals from 2018 to 2021.
UNVI vegetation index products can provide more comprehensive and convenient
long-time series vegetation index data products for scholars participating in
research on global change and human activities.
Keywords: UNVI; MODIS; vegetation index; BRDF-C; long time series
DOI: https://doi.org/10.3974/geodp.2022.04.16
CSTR: https://cstr.escience.org.cn/CSTR:20146.14.2022.04.16
Dataset Availability Statement:
The dataset supporting this paper was published and is accessible through
the Digital Journal of Global Change Data
Repository at: https://doi.org/10.3974/geodb.2022.12.01.V1 or https://cstr.escience.org.cn/CSTR:20146.11.2022.12.01.V1.
1 Introduction
Vegetation
occupies a large proportion of the land surface and is the most intuitive
information in remote sensing images. Vegetation is an important part of the
geographical environment. It adapts to landform, climate, hydrology, soil and
biological conditions and is controlled by many factors, so it has great
dependence on and sensitivity to the geographical environment[1].
Therefore, vegetation coverage and exuberance can reflect the changes and rules
of geographical conditions in a certain area to a certain extent.
Satellite remote
sensing technology has gradually become a powerful means to acquire
environmental information because of its advantages, such as a large detection
range, fast data acquisition speed, short period, less restriction by ground
and large amount of information. According to the spectral reflection and
absorption characteristics of vegetation, a series of indicators sensitive to
changes in surface vegetation and able to effectively reflect vegetation cover
and biomass are obtained by using visible and near-infrared band data of
multispectral remote sensing through analysis and operation and band
combination, which are called the vegetation index[2]. It can be
used to reflect vegetation coverage, vegetation vitality, biomass and other
vegetation growth conditions qualitatively and quantitatively[3].
The Universal
Normalized Vegetation Index (UNVI) is a new type of ground cover analysis
method proposed by Fujiwara et al.[4]
in 1996: the Pattern Decomposition Method (PDM), which is suitable for
analyzing multispectral satellite data. Various Vegetation Indices (VI) derived
from the PDM are based on the idea that the reflectance of a given surface is a
linear overlay of several standard land cover types so that multispectral data
can be used for the quantitative inversion of vegetation indices. However, the
VI algorithm derived from the PDM needs to calculate the complex coefficient
matrix, which is very inconvenient for users to use. Therefore, to popularize
these PDM-based VIs in a more user-friendly
way, Zhang et al.[5]
emphasized the concept of universality of VIs. As a result, the Universal
Pattern Decomposition algorithm (UPDM) is generated to establish a generalized
transformation matrix based on different sensors. The algorithm divides the
ground into four standard coverage types: soil, water, vegetation, and
vegetation between yellow and green. At the same time, Zhang conducted accurate
ground tests for different sensors[6] and obtained multiple
conversion matrices including MODIS, ETM+, GLI and other sensors for the
synthesis of UNVI. Therefore, PDM has universality, and VI can be calculated
only with a ready-made transformation matrix. According to the UPDM algorithm,
Zhang proposed the universal normalized vegetation index UNVI with many
advantages[7].
As a vegetation
index independent of the characteristics of sensors, the general normalized
vegetation index UNVI can better meet the needs of long-term change research
based on multisensor data. This dataset uses the multiday observation synthesis
method to complete the production of a 1:1,000,000 UNVI multidimensional
dataset for land areas of China from 2018 to 2021.
2 Metadata of the Dataset
The
metadata of China’s terrestrial UNVI multidimensional dataset (2018–2021)[8]
are summarized in Table 1. It includes the dataset full name, short name,
authors, year of the dataset, temporal resolution, spatial resolution, data
format, data size, data files, data publisher, and data sharing policy, etc.
Table
1 Metadata summary of the
China’s terrestrial UNVI multidimensional dataset (2018-2021)
|
Items
|
Description
|
|
Dataset full name
|
China’s
terrestrial UNVI multidimensional dataset (2018-2021)
|
|
Dataset short
name
|
UNVI_China_2018-2021
|
|
Authors
|
Zhao, H. Q.
DTI-1652-2022, College of Geoscience and Surveying Engineering, China
university of mining and technology (Beijing), zhaohq@cumtb.edu.cn
Liu, X. Q.
GYU-1673-2022, College of Geoscience and Surveying Engineering, China
university of mining and technology (Beijing), ZQT2100205146@student.cumtb.edu.cn
Zhang, L. F.
F-4751-2014, Aerospace Information Research Institute, Institute of Remote
Sensing and Digital Earth, Chinese Academy of Sciences, zhanglf@radi.ac.cn
Chen, J. H.
GYV-3412-2022, Aerospace Information Research Institute, Institute of Remote
Sensing and Digital Earth, Chinese Academy of Sciences,
chenjh_education@163.com
Fu, H. C.
GXG-4147-2022, College of Geoscience and Surveying Engineering, China
university of mining and technology (Beijing), fuhancong@student.cumtb.edu.cn
Ma, K.
GYU-4962-2022, College of Geoscience and Surveying Engineering, China
university of mining and technology (Beijing), make11034@163.com
|
|
Geographical
region
|
Including the
land of China (3°51′N–53°34′N, 73°E–135°5′E)
|
|
Year
|
2018-2021
|
|
Temporal resolution
|
16 days
|
|
Spatial
resolution
|
463 m
|
|
Data format
|
.mdd
|
|
|
|
Data size
|
43.5 GB
(Compressed into 4 files, 12.5 GB)
|
|
|
|
Data files
|
This dataset
includes 4 multidimensional data files in .mdd format. This dataset contains
4 UNVI products of China’s land vegetation index from 2018 to 2021, including
time dimension (23 time phases throughout the year), space dimension
(longitude and latitude coordinate system) and spectral dimension (UNVI
vegetation index) data. The spatial dimension data projection has been converted
to WGS_1984 latitude and longitude coordinates, and the spatial resolution is
approximately 463 m. The time dimension data contains 23 time phases with an
interval of 16 d. Spectral dimension data included UNVI vegetation index data
In 2018, for example,
the file is named 2018_UNVI. The data of 23 phases were named after the first
day of the synthesis period in accordance with the synthesis period of every
16 d. They were as follows: 001, 017, 033, 049, 065, 081, 097, 113, 129, 145,
161, 177, 193, 209, 225, 241, 257, 273, 289, 305, 321, 337, 350 (including
the 337th to 349th day in 2018, 2019 and 2021 is less than 16 days old,
select the data from days 337 to 349 as a group. The year 2020 is a leap
year. Select the data from days 337th to 350th as a group and name the last
image 351). The data contains the UNVI composite data and its header file
|
|
Foundation(s)
|
Ministry of
Education of P. R. China (2022JCCXDC01); China University of Mining and
Technology (Beijing) (2020QN07)
|
|
Data publisher
|
Global Change Research Data Publishing & Repository,
http://www.geodoi.ac.cn
|
|
Address
|
No. 11A, Datun
Road, Chaoyang District, Beijing 100101, China
|
|
Data sharing
policy
|
Data from the Global Change Research Data
Publishing & Repository includes metadata, datasets (in the Digital Journal of Global
Change Data Repository), and publications (in the Journal of Global
Change Data & Discovery).
Data sharing
policy includes: (1) Data are openly available and can
be free downloaded via the Internet; (2) End users are encouraged to use Data
subject to citation; (3) Users, who are by definition also value-added
service providers, are welcome to redistribute Data subject to written
permission from the GCdataPR Editorial Office and the issuance of a Data
redistribution license; and (4) If Data are used to compile new
datasets, the ‘ten per cent principal’ should be followed such that Data
records utilized should not surpass 10% of the new dataset contents, while
sources should be clearly noted in suitable places in the new dataset[9]
|
|
Communication and searchable system
|
DOI, CSTR, Crossref, DCI, CSCD, CNKI, SciEngine, WDS/ISC, GEOSS
|
3 Methods
Due to the
influence of the atmosphere, clouds and other factors, it is difficult to
obtain high-quality vegetation index products from the observation data of a
single day, so the industry usually adopts the multiday observation synthesis
method to obtain higher-quality vegetation index products[10,11].
Vegetation index synthesis refers to selecting the vegetation index that can
best represent the actual vegetation conditions on the surface by using the
appropriate vegetation index synthesis algorithm within the appropriate
synthesis period and then synthesizing a vegetation index raster image with
minimal influence on atmospheric conditions, cloud conditions, observational
geometry, geometric accuracy, etc.[12]. Selecting a suitable
vegetation index synthesis algorithm according to the above factors has become
the key to producing better quality vegetation index products.
For NASA’s official MODIS Vegetation Index
product, the VI algorithm filters the data based on quality, cloud cover, and
observational geometry. However, as MODIS is a push-sweep sensor, the size of
pixels increases with increasing observation zenith angle, and the spatial resolution
change caused by this influence can be up to four times[13,14],
which will cause a large BRDF characteristic error. Therefore, CV-MVC and MVC
synthesis methods are used instead of BRDF synthesis methods.
Zhang et
al.[15] further upgraded the synthesis algorithm of MODIS
vegetation index products by adding the discrimination of cloud cover within 16
days and designed the synthesis process of the UNVI vegetation index in a more
refined way. We added not only the BRDF algorithm for anisotropic surfaces but
also the Constrained View angle-Maximum Value Composite (CV-MVC), Vegetation
Index Computation (VI) and Maximum Value Composite (MVC). They are used as
standby algorithms when the angle normalization synthesis method is not
applicable to cope with the harsh condition that the BRDF algorithm requires at
least 5 d of high cleanliness pixels. The purpose of selecting the appropriate
synthesis method is to reduce the influence of adverse atmospheric conditions,
cloudy conditions and adverse geometric conditions and to ensure the
spatiotemporal consistency of the synthesized vegetation index products.
3.1 Principles of the UNVI Algorithm
The general
normalized vegetation index UNVI is a full-spectrum vegetation index proposed
by Zhang based on the general pattern decomposition algorithm UPDM. It assumes
that the spectrum of any ground feature on the surface is a linear combination
of the spectra of several standard ground features, namely, soil, water,
vegetation and yellow leaves between green leaves and dead leaves[7].
The expression formula of UNVI is as follows:
 (1)
(1)
where i is the band number, R(i)
is the reflectance of ground objects in band i, and Pw, Pv
and Ps represent the normalized reflectance of three standard ground
objects (water, vegetation and soil, respectively) in the spectral range of
band i. Cw, Cv and Cs represent the UPDM coefficients
of standard water bodies, vegetation, soil and yellow leaves, respectively[7].
For some studies,
only three components of UPDM are sufficient, and approximately 95.5% of the
spectral reflectance information of land cover can be converted into three
decomposition coefficients and decomposed into three standard models, with an
error of approximately 4.2% per degree of freedom[16]. However,
other studies may require more detailed analyses of vegetation change.
Therefore, Zhang[17] added a yellow leaf coefficient as a
supplementary spectral model, namely, the four-parameter UPDM. The four
standard ground features include soil, water bodies, vegetation and yellow
leaves. The expression formula of the improved UNVI is as follows:
 (2)
(2)
where P4
represents the normalized reflectance of the newly added standard ground object
yellow leaves in the spectral range of band i and C4 represents
the UPDM coefficient of standard yellow leaves.
To simplify the use of UPDM, Zhang et al.[18] deduced a simple
coefficient matrix M for different satellite sensors and optimized the
calculation of the UNVI coefficient matrix. The simplified matrix calculation
formula is as follows:
 (3)
(3)
where, R=[R1,
R2,…, Rn]T (T represents matrix transpose) is the
column vector of the reflectivity observed values of the original remote
sensing data, M=[Mw, Mv, Ms,
M4]T is a 4×n matrix, n represents
the number of bands, and the subscript of M has the same meaning as in Equation
(2). C=[Cw, Cv, Cs,
C4]T is the column vector of UPDM
coefficients. For different sensors, the band selected to calculate UNVI and
the value of coefficient matrix M are different. The M matrix
corresponding to the MODIS sensor used in this design is:
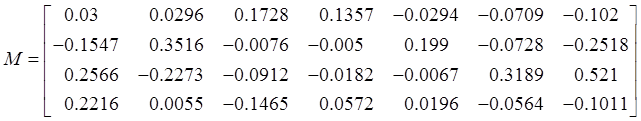 (4)
(4)
According to the above four coefficients,
UNVI can be expressed as:
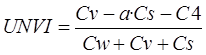 (5)
(5)
where, the UPDM
coefficient can be calculated by Equation (3), a is the standard soil model
coefficient, and its value is a=0.1. This value is obtained by setting the UNVI
value of withered yellow leaves as 0 and that of lush vegetation as 1. The
denominator 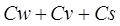 represents the
sum of the total reflectance. Since the reflectance information of soil and
dead vegetation is mixed in pixels, the approximate reflectance information of
vegetation is obtained by subtracting the UPDM coefficients of corrected soil
and withered or dead vegetation from the UPDM coefficients of vegetation in the
molecule. In areas with higher vegetation density, the molecular values are
higher because the soil and yellow leaves are covered by healthy vegetation.
Meanwhile, in areas with sparse vegetation, higher
represents the
sum of the total reflectance. Since the reflectance information of soil and
dead vegetation is mixed in pixels, the approximate reflectance information of
vegetation is obtained by subtracting the UPDM coefficients of corrected soil
and withered or dead vegetation from the UPDM coefficients of vegetation in the
molecule. In areas with higher vegetation density, the molecular values are
higher because the soil and yellow leaves are covered by healthy vegetation.
Meanwhile, in areas with sparse vegetation, higher  and
and  values will be
generated due to the scattering of light by soil and yellow leaves, leading to
a decrease in molecular values. Therefore, UNVI is more sensitive to a wider
range of vegetation dynamics than traditional VIs[18,19].
values will be
generated due to the scattering of light by soil and yellow leaves, leading to
a decrease in molecular values. Therefore, UNVI is more sensitive to a wider
range of vegetation dynamics than traditional VIs[18,19].
3.2 Principles of Composition Algorithm Selection
As the selection of
the synthesis algorithm is determined by many factors, such as the specific
application purpose, sensor characteristics, and atmospheric parameters of the
corresponding region, after the completion of screening MOD09GA data, the
appropriate synthesis algorithm is selected according to the cloudless data
days N of each group of data.
In the production process of this dataset,
although the angle normalization method BRDF-C can effectively remove the
influence of changing observation geometry, which represents the most advanced
vegetation index synthesis method at present, it is easily affected by the time
resolution of the dataset, the limitation of the number of effective
observations and the interference of thin clouds. Therefore, only when the
number of days N ≥5 without cloud data was the angle normalization synthesis
method BRDF-C selected to fit all the cloud-free observation data within the
synthesis period to the equivalent reflectance value of the substar under the
irradiation condition band by band and pixel by pixel, and then the synthesized
value was obtained by the UNVI calculation formula and recorded in UNVI_DATA.
At the same time, Q = N × 10 + 1 is calculated and recorded in QC_BAND (quality
control band). In particular, when the synthesis value of UNVI is not within
the interval [0.3–UNVIMVC, UNVIMVC +0.05] (UNVIMVC
represents the UNVI value synthesized by the maximum synthesis method) or the
reflectance of the fitting substellar point is negative, the angle
normalization synthesis method is abandoned. CV-MVC was used to synthesize UNVI
instead.
At the same
time, when there is a small amount of cloud-free data, the BRDF-C method will
obtain the wrong reflectivity fitting value and further obtain the wrong UNVI
value. Therefore, when the number of days of cloud-free data is 1 < N <
5, the UNVI value of all high-quality cloud-free data within the synthesis
cycle will be calculated first. Then, CV-MVC uses the maximum value synthesis
method in a limited view angle to select the maximum value from these several
high-quality data as the final UNVI synthesis value of the pixel and record it
in UNVI_DATA. Meanwhile, Q = N×10 + 2 is calculated and recorded in QC_BAND.
When the number of days without cloud data N =1, the direct calculation of UNVI
with the high-quality original data of this day is more accurate than the angle
normalization method. Therefore, the UNVI composite value was obtained by the
direct calculation method and recorded in UNVI_DATA. Meanwhile, Q = N×10 + 3
was calculated and recorded in QC_BAND. When the number of cloud-free data days
N =0, there are no high-quality cloud-free data in the synthesis cycle.
Compared with the other three algorithms, the MVC of the maximum synthesis
method can remove atmospheric influences, including residual clouds, and its
composite value is closer to the observed data of the substar. Therefore, the
maximum value synthesis method is used to calculate the UNVI value of all 16 d
data within this synthesis period, and the maximum value is selected as the
UNVI value of this synthesis period and recorded in UNVI_DATA. Meanwhile, Q = 4
is calculated and recorded in QC_BAND. In this process, to avoid synthesis
failure caused by low reflectance values or no effective reflectance data, data
containing –28,672 were removed, and the UNVI of all invalid values was set to
–999 to represent invalid data. Then, MVC synthesis was carried out.
3.3 Data Processing
In 2018, for
example, this dataset uses MODIS/terra surface reflectance daily L2G Global 1
km and 500 m SIN Grid V006 products with time ranges from January 1, 2018, to
December 31, 2018, as raw data. UNVI
products are produced using 7 reflectance band data from 01 to 07, sensor
zenith angle data, sensor azimuth, solar azimuth and quality control band data
of the data product.
Read classified and stored MOD09GA data. The 2018-01-01 data were
set as the initial synthetic data, and the 365 days of MOD09GA data in 2018
were divided into groups every16 days in chronological order. The data from
days 337 to 349 in 2018 were less than
16days (13 days),
and the data from days 337 to 349 were selected as one group. Then, the MOD09GA
data are read in sequence in groups. Check whether there are invalid values and
negative reflectance values in the reflectance band of each set of input
MOD09GA data. If there are invalid values, the data of this day will be
eliminated. If the pixel reflectance is negative (in the range [–100, 0]),
change this value to 1.
Determine data cloud cover. Read the
quality control band data (state_1 km_1.img) in a block, convert the data into
binary, and take the first three digits as the quality parameter of the pixel.
000 or 011 indicates high-quality data without clouds. In other cases, the data
have a cloud and are of low quality. Finally, the number of days each pixel
contains cloud-free data within this synthesis cycle is counted as N.
According to the advantages and
disadvantages of the exponential synthesis model and method of BRDF, CV-MVC, VI
and MVC as well as their applicable conditions, and according to the days N of
cloud-free data within each synthesis cycle, the UNVI synthesis method of each
pixel within the synthesis cycle is determined. The specific synthesis process
is as follows:
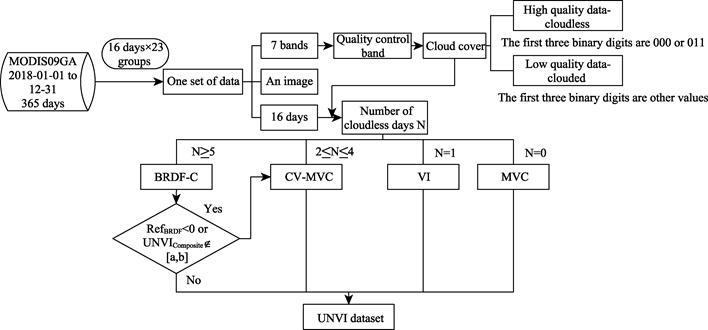
Figure
1 UNVI product
synthesis flow chart
After obtaining UNVI data through the above
four synthesis algorithms, UNVI products of 23 synthesis cycles in China’s land
area in 2018 were obtained through mosaic, coordinate transformation and data
clipping.
Finally, MARS software was used to store
the UNVI synthesis data in multidimensional data format, and the UNVI products
of 23 synthesis cycles were stored in multidimensional data format. Finally,
the UNVI dataset product of China’s land vegetation index in 2018 was obtained.
The dataset was an MDD file stored in TSB format. Its file contains the 2018
UNVI composite data and its header file.
4 Data Results and Validation
4.1 Data Composition
The UNVI dataset of
China’s land vegetation index is stored in the MDD multidimensional data
format, including 23 groups of files, and each group of files contains a UNVI
product with a synthesis period of 16 days. The composition of the dataset is
shown in Table 2.
Table
2 Composition of the UNVI
multidimensional dataset (2018-2021) (taking 2018 as an
example)
|
Name
|
Description
|
|
UNVI_2018_001
|
UNVI products synthesized using data from Day 001-016 in 2018
|
|
UNVI_2018_017
|
UNVI products synthesized using data from Day 017-032 in 2018
|
|
UNVI_2018_033
|
UNVI products synthesized using data from Day 033-048 in 2018
|
|
UNVI_2018_049
|
UNVI products synthesized using data from Day 049-064 in 2018
|
|
UNVI_2018_065
|
UNVI products synthesized using data from Day 065-080 in 2018
|
|
UNVI_2018_081
|
UNVI products synthesized using data from Day 081-096 in 2018
|
|
UNVI_2018_097
|
UNVI products synthesized using data from Day 097-112 in 2018
|
|
UNVI_2018_113
|
UNVI products synthesized using data from Day113-128 in 2018
|
|
UNVI_2018_129
|
UNVI products synthesized using data from Day 129-144 in 2018
|
|
UNVI_2018_145
|
UNVI products synthesized using data from Day 145-160 in 2018
|
|
UNVI_2018_161
|
UNVI products synthesized using data from Day 161-176 in 2018
|
|
UNVI_2018_177
|
UNVI products synthesized using data from Day 177-192 in 2018
|
|
UNVI_2018_193
|
UNVI products synthesized using data from Day 193-208 in 2018
|
|
UNVI_2018_209
|
UNVI products synthesized using data from Day 209-224 in 2018
|
|
UNVI_2018_225
|
UNVI products synthesized using data from Day 225-240 in 2018
|
|
UNVI_2018_241
|
UNVI products synthesized using data from Day 241-256 in 2018
|
|
UNVI_2018_257
|
UNVI products synthesized using data from Day 257-272 in 2018
|
|
UNVI_2018_273
|
UNVI products synthesized using data from Day 273-288 in 2018
|
|
UNVI_2018_289
|
UNVI products synthesized using data from Day 289-304 in 2018
|
|
UNVI_2018_305
|
UNVI products synthesized using data from Day 305-320 in 2018
|
|
UNVI_2018_321
|
UNVI products synthesized using data from Day 321-336 in 2018
|
|
UNVI_2018_337
|
UNVI products synthesized using data from Day 337-349 in 2018,
the data from days 337 to
349 were less than 16 days
|
|
UNVI_2018_350
|
UNVI products synthesized using data from Day 350-365 in 2018
|
4.2 Data Products
The UNVI product
covers all the land areas of China, including the UNVI data of 23 time phases
from January 1 to December 31, 2018 to 2021 in a 16-day synthesis cycle. Each
phase has a band for storing UNVI data, and the effective range is [–2, 2]. The
product of this dataset is the coordinate system GCS_WGS_1984, the tape number
is 49 N, and the spatial resolution is 463 m.
4.3 Data Validation
The spatial and
temporal changes in UNVI datasets in China during 2018–2021 were analyzed.
(1) Time change
analysis
Taking the UNVI
data in 2019 as an example, the time variation in the average UNVI in China was
analyzed. To eliminate the influence of outliers on the average value of UNVI,
only effective pixels with values of [–2, 2] in the region are selected for
average calculation. However, this operation still cannot exclude the cloud
cover area, so the average calculated value of UNVI will be smaller than the
real value. The greater the cloud cover area is, the greater the degree of
underestimation, such as the 001–016 days of 2019.
As shown in Figure
2, the average value of UNVI in one year presents the characteristics of a
maximum value in summer and an obvious peak value in summer and a minimum value
and an insignificant peak value in winter, which is consistent with the change
trend of vegetation in one year.
|
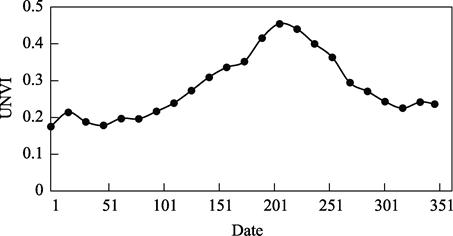
Figure 2 2019 UNVI
mean change trend
|
(2)
Spatial change analysis
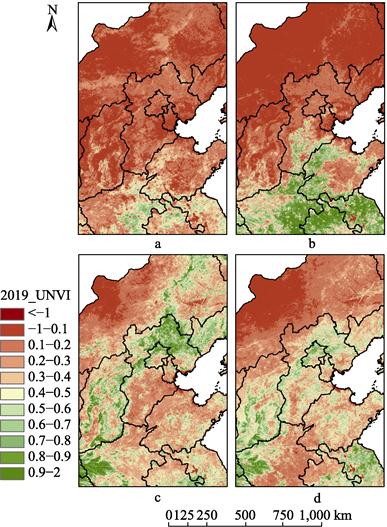
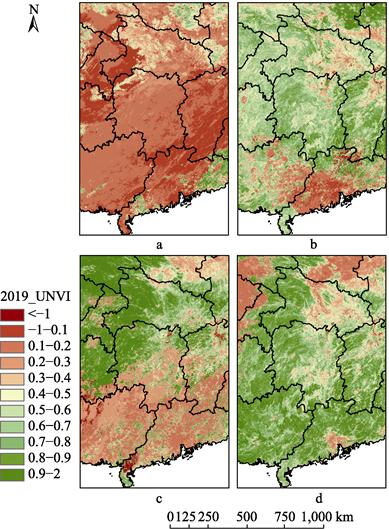
Taking
UNVI data in 2019 as an example, UNVI products on days 001–016 (Figure 3a, 4a),
097–112 (Figure 3b, 4b), 177–192 (Figure 3c, 4c) and 273–288 (Figure 3d, 4d) of
each year are selected for spatial change analysis.
Figure 3 and
Figure 4 show that the UNVI in China varies in different seasons. The spatial
distribution of UNVI was as follows: (1) in winter (days 001–016), the UNVI in
northern China was generally smaller, while that in southern China was larger;
(2) in spring (days 097–112), the UNVI in northern and southern regions
increased gradually, but the UNVI in northern Hebei and further north had no
significant change compared with that in winter; (3) in summer (days 177–192),
both the northern and southern regions reached the period of relatively large
UNVI; (4) in autumn (days 273–288), the spatial distribution of UNVI was
similar to that in summer, and the value decreased slightly. However, southern
regions are more susceptible to cloud cover than northern regions, as shown in
Figure 4a. Generally, its spatial distribution features are large in the south
and small in the north, which agrees with the growth characteristics of
vegetation in China.
|
|
|
|
Figure
3 Dynamic change
of UNVI in local region of China (Hebei and its surroundings) in 2019
|
Figure
4 Dynamic change
of UNVI in local region of China (Hunan and its surroundings) in 2019
|
5 Discussion and Conclusion
This dataset is
based on the MOD09GA product and traditional vegetation index synthesis algorithm,
and the UNVI vegetation index synthesis algorithm designed by Zhang’s team is
used to produce China land vegetation index UNVI products. In the synthesis
process of the vegetation index, due to the influence of atmospheric
conditions, cloud interference and other factors, it is difficult to produce
high-quality vegetation index products with single-day observation data.
Therefore, this design adopts a multiday observation synthesis method to
produce higher-quality UNVI products.
In this dataset, MARS software can be used
to analyze and study the phenological changes of vegetation, quantitative
inversion products of physical and chemical parameters of vegetation can be
generated, and the phenological changes of the whole year can be studied[15].
Compared with traditional vegetation indices (such as NDVI, EVI, etc.), this
dataset has more advantages in reflecting vegetation cover changes and
quantitative inversion of physical and chemical parameters[20,21].
It can be used for qualitative and quantitative inversion of physical and
chemical parameters of vegetation or classification of vegetation cover types,
as well as study of annual phenological changes[22–24]. In addition,
some scholars[20] have found that UNVI has considerable potential in
drought monitoring. The above results show that UNVI is superior to or equal to
other mainstream vegetation indices in retrieving the physicochemical
parameters of vegetation, vegetation cover change and vegetation classification
and has better application prospects. Therefore, this dataset can provide more
comprehensive and convenient long time series data products of the vegetation
index for scholars engaged in global change research.
In summary, compared with traditional
vegetation index products, this dataset has more obvious advantages and has
more universal applicability to different sensors. Although this dataset has
many advantages, it can be further deepened and expanded in terms of the
algorithm. For example, the UNVI synthesis algorithm based on this paper may
result in a discrepancy between the UNVI synthesis result and the real value
because the sensor data used in the cloud detection result are incorrect or
when the number of days N of high-quality cloud-free data is less. Although the
above two cases rarely occur, the results show that the algorithm still has
room for improvement and progress.
Author Contributions
Zhang, L. F. and Zhao, H. Q. designed the
algorithms of dataset. Zhao, H. Q., Liu, X. Q., Chen, J. H., Fu, H. C. and Ma,
K. contributed to the data processing and analysis. Liu, X. Q., and Zhao, H. Q.
wrote the data paper.
Conflicts of Interest
The authors
declare no conflicts of interest.
References
[1]
Wang, Q., Yang, Y. P., Huang,
J. Z., et al. Environmental Remote
Sensing [M]. Beijing: Science Press, 2004: 366.
[2]
Han, A. H. Study on monitoring
method of forest biomass and carton storage based on remote sensing [D].
Beijing: Beijing Forestry University, 2009.
[3]
Tian,
Q. J., Min, X. J. Advances in study on vegetation indices [J]. Advances in Earth Sciences, 1998(4): 10-16.
[4]
Noboru, F., Akiko, O.,
Motomasa, D. Pattern decomposition method for hyper-multispectral satellite
data analysis [P]. SPIE Asia-Pacific Remote Sensing, 2001.
[5]
Zhang, L. F., Mitsushita, Y.,
Furumi, S., et al. Universality of
modified pattern decomposition method for satellite sensors [R]. Asia GIS
Conference, Wuhan, 2003.
[6]
Zhang, L. F. The universal
pattern decomposition method and the vegetation index based on the UPDM [D].
Wuhan: Wuhan University, 2005.
[7]
Zhang, L. F., Zhang, L. P.,
Muramatsu, K., et al. Universal
pattern decomposition method based on hyper spectral satellite remote sensing
data [J]. Information Science of Wuhan
University, 2005(3): 264-268.
[8]
Zhao, H. Q., Liu, X. Q., Zhang,
L. F., et al. China’s terrestrial
UNVI multidimensional dataset (2018-2021)
[J/DB/OL]. Digital Journal of Global
Change Data Repository, 2022. https://doi.org/10.3974/geodb.2022.
12.01.V1.
https://cstr.escience.org.cn/CSTR:20146.11.2022.12.01.V1.
[9]
GCdataPR Editorial Office.
GCdataPR data sharing policy [OL]. https://doi.org/10.3974/dp.policy.2014.05
(Updated 2017).
[10]
De Wasseige, C., Vancutsem, C.,
Defourny, P. Sensitivity analysis of compositing strategies: modelling and
experimental investigations. Vegetation 2000 [C]. Lake Maggiore, Italy. 2000:
267-274.
[11]
Holben, B. N. Characterization
of maximum value composites from temporal AVHRR data [J]. International Journal of Remote Sensing, 1986, 7(11): 1417-1434.
[12]
Lovell, J. L., Graetz, R. D.,
King, E. A. Compositing AVHRR data for the Australian continent: seeking best
practice [J]. Canadian Journal of Remote
Sensing, 2003, 29(6): 770-782.
[13]
Duchenmin, B., Maisongrande, P.
Normalisation of directional effects in 10-day global syntheses derived from
VEGETATION/SPOT: I. Investigation of concepts based on simulation [J]. Remote Sensing of Environment, 2002,
81(1): 90-100.
[14]
Long, X., Li, J., Liu, Q. H.
Review on VI compositing algorithm [J]. Remote
Sensing Technology and Application, 2013, 28(6): 969-977.
[15]
Zhang, L. F., Zhong, T., Liu,
H. L., et al. UNVI multidimensional
dataset of 2017 China’s terrestrial at 1:1 000000 scale [J]. Journal of Remote Sensing, 24(11): 1293-1298.
[16]
Daigo, M., Ono, A., Fujiwara,
N., et al. Pattern decomposition
method for hyper-multi-spectral data analysis [J]. International Journal of Remote Sensing, 2004, 25(6): 1153-1166.
[17]
Zhang, L. F., Furumi, S.,
Muramatsu, K., et al.
Sensor-independent analysis method for hyper-multispectral data based on the
pattern decomposition method [J]. International
Journal of Remote Sensing, 2006, 27(21): 4899-4910.
[18]
Zhang, L. F., Qiao, N., Baig,
M. H. A., et al. Monitoring
vegetation dynamics using the universal normalized vegetation index (UNVI): an
optimized vegetation index-VIUPD [J]. Remote
Sensing Letters, 2019, 10(7): 629-638.
[19]
Zhang, L. F., Furumi, S.,
Muramatsu, K., et al. A new
vegetation index based on the universal pattern decomposition method [J]. International Journal of Remote Sensing,
2007, 28(1): 107-124.
[20]
Jiao, W. Z., Zhang, L. F.,
Chang, Q., et al. Evaluating an
enhanced vegetation condition index (VCI) based on VIUPD for drought monitoring
in the continental United States [J]. Remote
Sensing, 2016, 8(3): 224.
[21]
Du, H. S., Jiang, H. L., Zhang,
L. F., et al. Evaluation of spectral
scale effects in estimation of vegetation leaf area index using spectral
indices methods [J]. Chinese Geographical
Science, 2016, 26(6): 731-744.
[22]
Wang, S. H., Yang, D., Li, Z., et al. A global sensitivity analysis of
commonly used satellite-derived vegetation indices for homogeneous canopies
based on model simulation and random forest learning [J]. Remote Sensing, 2019, 11(21): 2547.
[23]
Liu, H. L., Zhang, F. Z.,
Zhang, L. F., et al. UNVI-based time
series for vegetation discrimination using separability analysis and random
forest classification [J]. Remote Sensing,
2020, 12(3): 529.
[24]
Jiang, H. L., Zhang, L. F.,
Yang, H., et al. Research on spectral
scale effect in the estimation of vegetation leaf chlorophyll content [J]. Spectroscopy and Spectral Analysis,
2016, 36(1): 169-176.