Development of a
Global Land Suitability Dataset for Cultivation Based on Physiogeographic
Factors
Zhang, C. P. Ye, Y. * Fang, X. Q.
Faculty of Geographical Science, Beijing Normal
University, Beijing 100875, China
Abstract: Land
suitability data for cultivation based on physiogeographical factors are the
basic input when studying the spatially explicit reconstruction of historical
cropland cover. The credibility of the gridded allocated results was partially
determined by the quality of land suitability data. The assumption that the
physiogeographical factor affects the cultivation intensity with the same
linear relationship was unreasonable for most previous studies at global or
continental scales. In this study, the correlation between modern cultivation
intensity and 13 physiogeographic factors (including climate, topography, soil,
etc.) was detected around the world under each 0.5?? ?? 0.5?? grid cell, and then
the 5???? 5?? global dataset of the land suitability was developed based on the
integration of all identified factors that significantly correlated with the
cultivation intensity. The results mainly aid research regarding spatially
explicit reconstruction of historical cropland cover on the global scale. The
dataset is archived in .img format and consists of 4 data files. The data size
is 38.7 MB (compressed to 3.55 MB).
Keywords: physiogeographical
factors; cropland
cover; spatial differentiation; correlation; land suitability for cultivation
DOI: https://doi.org/10.3974/geodp.2022.03.08
CSTR: https://cstr.escience.org.cn/CSTR:20146.14.2022.03.08
Dataset Availability Statement:
The dataset
supporting this paper was published and is accessible through the Digital Journal of
Global Change Data Repository at: https://doi.org/10.3974/geodb.2022.04.01.V1 or
https://cstr.escience.org.cn/CSTR:20146.11.2022.04.01.V1.
1
Introduction
Since the agricultural revolution, anthropogenic land use
and cover changes (LUCC) have deeply influenced terrestrial ecosystems and have
become one of the increasingly critical driving forces affecting global
environmental changes[1–4]. Especially for land used during the
industrial revolution, the original natural landscape has undergone
unprecedented alteration with the boom in population, which has exerted
profound impacts on the Earth??s matter and energy cycle as well as global
climate change[5].
Since the 1990s, several global historical LUCC gridded
datasets (SAGE, HYDE, PJ, KK10, etc.) has been successfully developed and
published, which relies on the integration of multiple disciplines of
paleoenvironmental science, archaeology, history, etc.[6], with the
promotion of IGBP and PAGEs, as well as the development of model simulation[5,7–10].
As input parameters of climate models, carbon cycle models, etc., these
datasets have been widely used in research to assess the impact of
anthropogenic land cover change (ALCC) on the carbon budget and climate change.
The data quality directly affects the reliability of the simulation and
assessment results of past global changes[11,12].
As
an extensive and long-lasting land use type, the quantitative reconstruction of
cropland area and its gridded spatially explicit allocation have been the main
objects of historical LUCC research[13–15]. The uncertainty of the
gridded dataset is mostly caused by the allocation algorithms when the
quantitative reconstruction of the historical cropland area is relatively
accurate[16–18]. In previous studies, most of the gridded allocation
methods subjectively select several physiogeographical factors to determine the
suitability for cultivation (assuming that there is a single linear
relationship between each factor and cultivation intensity), multiply the
normalized results of each factor with the same weights to calculate the land
suitability for cultivation (here refers to the suitability of the land for
planting crops), and then use these data as the weight to allocate the total
cropland area in the reconstructed administrative unit to generate the gridded
result[14]. For the global and continental scales, however, the
above assumptions are obviously unreasonable. On the one hand, any
physiogeographical factor has a distinct correlation with the cultivation
intensity in different spatial units; on the other hand, the combination of
physiogeographical factors that affect cultivation intensity is also different[18].
Given
the above mentioned problems, this study collected 13 physiogeographical
factors (including the climate, topography, soil, etc.), intended to generally
represent the influences on cultivation from the aspects of heat, water
availability, soil fertility, labor difficulty, etc. The global land was
divided into 0.5????0.5?? regular grids, the correlation between each factor and
the modern cultivation intensity was identified in each unit, and all the
factors significantly correlated with the cultivation intensity in each unit
were normalized. Then, the geometric averages of these normalized results were
calculated as the global land suitability for the cultivation dataset.
2 Metadata of the Dataset
The metadata of the
Global cultivation land suitability for dataset based on physiogeographic
factors[19] are summarized in Table 1.
3 Methods
3.1 Raw Data
Considering
the spatial coverage of the study and the data availability, this study
selected 13 factors based on expert knowledge of physical geography, including
climate, topography, and soil (Table 2). Among them, the climate data came from
WorldClim[21],
and the annual mean temperature and precipitation were selected. The altitude
data came from the USGS GTOPO30 DEM[22],
and the slope was calculated from DEM data. The soil data came from the World
Soil Information (ISRIC) SoilGrids dataset[23],
and 8 factors were selected, including mechanical composition, bulk density,
organic carbon density, cation exchange capacity, and pH. NDVI data came from
GIMMS[24].
The annual value was calculated from
Table
1 Metadata summary of
the Global cultivation land suitability for dataset based on physiogeographic
factors
|
Items
|
Description
|
|
Dataset full name
|
Global cultivation land suitability for dataset based on physiogeographic factors
|
|
Dataset short name
|
GlobalCultivLandSuitability
|
|
Authors
|
Zhang, C. P. HGE-4534-2022, Beijing Normal University,
cpzhang@mail.bnu.edu.cn
|
|
Ye, Y., Beijing Normal University, yeyuleaffish@bnu.edu.cn
|
|
Fang, X. Q., Beijing Normal University, xfang@bnu.edu.cn
|
|
Geographical region
|
Global land area
|
|
Year
|
Modern (approximately 2000 C.E.)
|
|
Data Format
|
.img
|
|
Data Size
|
3.55 MB (compressed)
|
|
Data files
|
The raster dataset of land suitability for cultivation
with 5????5?? resolution
|
|
Foundation
|
Ministry of Science and Technology of P. R. China
(2017YFA0603304)
|
|
Data publisher
|
Global Change Research Data Publishing & Repository,
http://www.geodoi.ac.cn
|
|
Address
|
No. 11A, Datun Road, Chaoyang District, Beijing 100101,
China
|
|
Data
sharing policy
|
Data from the Global
Change Research Data Publishing & Repository includes metadata, datasets (in the Digital Journal of Global Change Data Repository), and
publications (in the Journal of Global Change Data & Discovery). Data sharing policy
includes: (1) Data are openly
available and can be free downloaded via the Internet; (2) End users are
encouraged to use Data subject to
citation; (3) Users, who are by definition also value-added service
providers, are welcome to redistribute Data
subject to written permission from the GCdataPR Editorial Office and the
issuance of a Data redistribution
license; and (4) If Data are used
to compile new datasets, the ??ten per cent principal?? should be followed such
that Data records utilized should
not surpass 10% of the new dataset contents, while sources should be clearly
noted in suitable places in the new dataset[20]
|
|
Communication and searchable system
|
DOI, CSTR, Crossref, DCI,
CSCD, CNKI, SciEngine, WDS/ISC, GEOSS
|
Table 2 Basic information on the physiogeographic factors and cropland fraction
dataset used in this study
|
Type
|
Name
|
Unit
|
Resolution
|
Description
|
|
Physiogeo-graphic factors
|
Annual mean temperature
|
??C
|
0.5????0.5??
|
WorldClim (1970-2000 C.E.)[21]
|
|
Annual mean precipitation
|
mm
|
0.5????0.5??
|
WorldClim (1970-2000 C.E.)[21]
|
|
Altitude
|
m
|
3????3??
|
GTOPO30 DEM[22]
|
|
Slope
|
??
|
3????3??
|
Calculated from DEM data
|
|
NDVI
|
—
|
5????5??
|
Derived from GIMMS NDVI dataset[23], the
annual value was calculated from the semimonthly data from 1981 to 2015 by
using the MVC method, and the multiyear average value was calculated
|
|
Bulk density
|
kg/m3
|
10????10??
|
Derived from SoilGrids[24], calculating the
average value of 5 layers from the surface to the underground 60 cm
|
|
Organic carbon content
|
kg/m3
|
10????10??
|
|
Coarse fragment content
|
%
|
10????10??
|
|
Sand content
|
%
|
10????10??
|
|
Silt content
|
%
|
10????10??
|
|
Clay content
|
%
|
10????10??
|
|
Cation exchange capacity
|
mol/kg
|
10????10??
|
|
pH
|
-
|
10????10??
|
|
Cropland
|
Cropland Fraction
|
%
|
0.5????0.5??
|
Adopting the global synergistic cropland fraction
dataset developed by Zhang et al.[25]
|
the semimonthly values by using the MVC method, and then
multiyear averages from 1982 to 2015 C.E. The modern cropland fraction data
adopted the synergistic 0.5????0.5?? cropland dataset derived from multiple sets
of global land cover products developed by Zhang et al.[25]. Compared with the original satellite-derived
products, these data have relatively higher reliability in terms of the spatial
distribution and cultivation intensity at the pixel scale[25].
The principles of selection considered the
representativeness, hierarchy and comprehensiveness of these factors. First,
the climate determines the basic pattern of agricultural types and the
distribution of cropland on macroscales; second, the large geomorphological
structure and topography affect the farming methods and utilization intensity;
third, the distribution of waters determines the preferences of the cultivation
order in space; and on a smaller scale, humans can modify the field topography
and improve the soil fertility relatively easily. Actually, the influence of
these factors on the land suitability for cultivation is the influence of land
with different soil fertility (represented by yield) on the preference of land
cultivation by humans. With the same labor cost and economic input, it is
easier to obtain high yields on land with better soil fertility, so it is most
likely to be cultivated first. Data such as potential photosynthetic production
and potential farmland production can comprehensively indicate crop yield
conditions, considering that they are not independent of temperature,
precipitation, soil, etc. This study selected NDVI as the alternative
indicator.
3.2
Algorithms
The spatial resolution of all data was unified to 5????5??
(using the Zonal Statistics tool in ArcGIS), and 0.5????0.5?? was adopted as the
basic unit to detect the correlation of physiogeographic factors and
cultivation intensity. The basic steps of the development of land suitability
for cultivation are described as follows:
(1) In each 0.5????0.5?? grid unit, Pearson correlation
analysis (Sig = 0.001) is performed to detect the relationship between
physiogeographic factors and cultivation intensity, and the schematic is shown
in Figure 1.
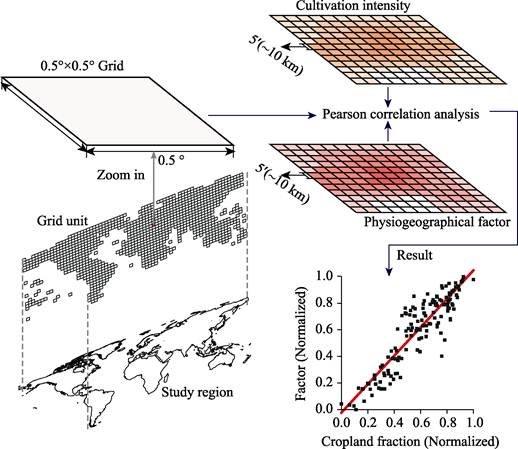
Figure
1 Schematic of the
correlation detection between physiogeographic factors and cultivation
intensity under the global 0.5?? grid
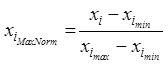
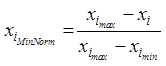
(2) In each 0.5????0.5?? grid, the factors significantly
correlated with cultivation intensity were normalized. When it is a positive
correlation, Equation 1 is adopted; when it is a negative correlation, Equation
2 is adopted.
 (1)
(1)
 (2)
(2)
where xiMaxNorm and xiMinNorm
are the normalized pixel values in spatial unit i; xi is the
5?? grid value in spatial unit i; ximax is the maximum value in
spatial unit i; and ximin is the minimum value in
spatial unit i.
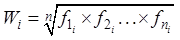
(3) Calculate the geometric average value of the
normalization results of all factors correlated to the cultivation intensity in
spatial unit i (converting the
original interval from 0–1 to 1–100) (Equation
3). The previous method directly multiplied the factors, which changed
the linear relationship between physiogeographic factors and cultivation
intensity to an exponential relationship.
 (3)
(3)
where Wi is the land suitability for cultivation in
spatial unit i; fni is the Factor n
used to construct l and suitability for cultivation in spatial unit i; and n is the number of factors engaged in constructing the land
suitability in spatial unit i.
(4) Perform the interval stretching transformation for the
results calculated in step 2 with the modern cultivation intensity interval in
spatial unit i (Equation 4) and then
obtain the dataset of land suitability for cultivation with 5????5?? resolution
(Figure 2). Before identifying the maximum and minimum values of the cropland
fraction in spatial unit i, the
cropland data were first smoothed by using the focal statistics tool with a 3??3
length in ArcGIS. For the few spatial units where there was no correlation
between physiogeographic factors and cultivation intensity, the modern
cultivation intensity was used to represent the land suitability.
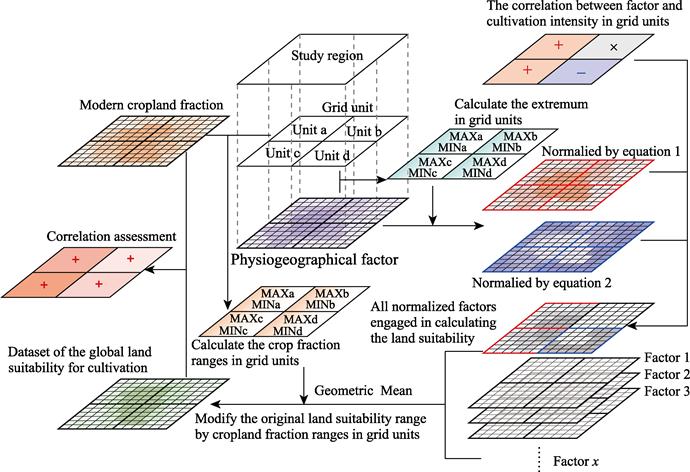
Figure 2 Schematic of the construction of global
land suitability
(??+?? indicates a significant positive correlation; ??-?? indicates a significant negative correlation; ??????
indicates no correlation.)
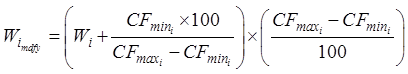 (4)
(4)
where Wimdfy
is the modified result of land suitability in spatial unit i; Wi is the
value of land suitability in spatial unit
i; CFmaxi is the
maximum cropland fraction in spatial unit
i; and CFmini is the
minimum cropland fraction in spatial unit
i.
4 Data Results and Validation
4.1
Data Composition
The global dataset of land suitability for cultivation with
5????5?? resolution based on physiogeographic factors (Figure 3) consists of 4
data files, archived in .img format, and the data size is 38.7 MB (compressed
into 1 file, 3.55 MB).
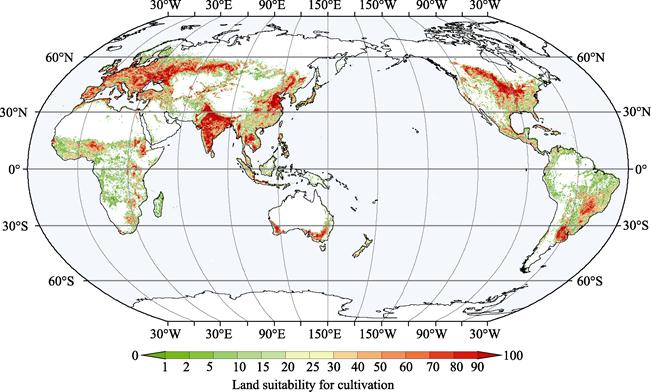
Figure 3 The global dataset of land suitability
for cultivation with 5????5?? resolution
4.2
Data Results
Overall, the spatial pattern of land suitability is very
similar to the distribution characteristic of cultivation intensity. Namely,
high intensity is generally located in major agricultural regions around the
world (such as the Eastern European Plain, the North China Plain, the Ganges
Plain, and the Central Plains of North America), while in regions with
relatively harsh cultivation conditions, the land suitability is generally low.
The land suitability result shows slight irrationality in a few regions.
Different from the cultivation intensity around space with smooth gradients,
the suitability values on both sides of the 0.5?? grid boundary show obvious
differences. More detailed information on this dataset at the regional scale
can be loaded into ArcGIS for viewing.
4.3
Data Validation
Land suitability should effectively indicate the potential
cultivation conditions. In this study, modern cultivation intensity data were
used to assess the reliability of the land suitability results. According to
calculating the correlation between two data (Sig = 0.001) under the 0.5????0.5??
grid unit, the reliability of the land suitability dataset was evaluated. As
shown in Figure 4, the land suitability results showed a good positive
correlation with the modern cultivation intensity dataset. More than 74% of the
regions have correlation coefficients above 0.7.
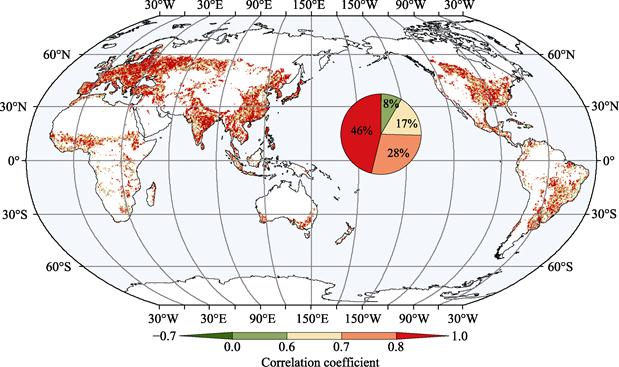
Figure 4 Correlation
between land suitability and modern cultivation intensity under a 0.5????0.5??
grid unit
5 Discussion and Conclusion
To analyze the correlation between physiogeographic factors
and modern cultivation intensity around the world, the following recognitions
were acquired: the relationship between these two varies by region. The
relationship should be identified at regional scales. First, the correlation
between almost all physiogeographic factors and cultivation intensity does not
have a uniform linear relationship on a global scale; it may be positive or
negative correlations, and the significance of the correlation coefficient also
has obvious differences. Second, the types and quantities of physiogeographic
factors that affect cultivation intensity are quite distinct in large regions.
The influence of physiogeographic factors on the cultivation intensity in the
low mountainous and hilly areas is significantly greater than that in plains
and basins.
The spatial differentiation characteristics of the
correlation between some physiogeographic factors and cultivation intensity in
China are shown in Figure 5. For precipitation, most previous studies do
sufficiently assume that the greater the precipitation is, the higher the
cultivation intensity; the two sample points in southern Anhui and the
Qiongzhou Peninsula, where rainfall is abundant, show a negative correlation
and no correlation, respectively. However, only Longdong (with precipitation
less than 600 mm) shows a fine positive correlation. NDVI shows a fine positive
correlation with the reclamation intensity at the southwestern margin of the
Tarim Basin in Xinjiang (the oasis agriculture relying on irrigation), while in
the southeastern part of the Northeast Plain, the two show a strong negative
correlation.
For the data
applicability used in the study of historical periods, the following issues
need to be emphasized. First, to indicate the historical cultivation condition
by modern land suitability, a basic assumption that should be obeyed is that
the relationship between physiogeographic factors and land suitability is
constant from ancient to modern times. Namely, the relationship of land
suitability for cultivation with climate, topography, and soil has not changed
drastically with time. Given that it is difficult to obtain historical
physiogeographic factor data (not simulation results) on a large scale, factors
such as terrain and soil in historical periods were approximately similar to
those in modern periods, the magnitude of climate change was relatively small,
and the changes were relatively consistent on a regional scale. Therefore, this
study uses modern factors to represent historical conditions.
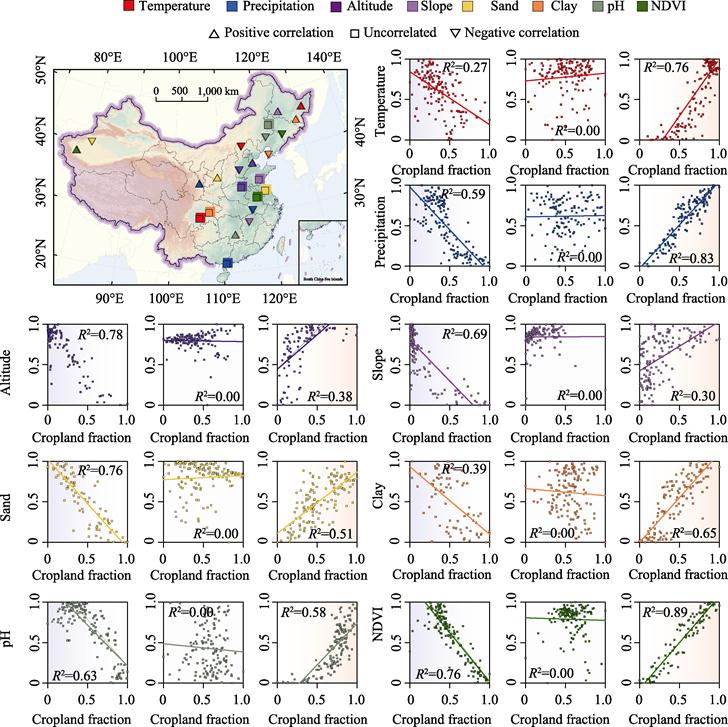
Figure
5 Example of
spatial differentiation of correlations between physiogeographic factors and
cultivation intensity in China
(Notes: The upper
left shows the coordinates of each sample point (0.5????0.5?? grid). Colors and
shapes indicate the factors and the correlation types. The x-axis indicates the
cultivation intensity, and the y-axis indicates the normalized value of the
factor.)
In this study, the correlation between physiogeographic
factors and modern cultivation intensity was identified on a global scale, and
several physiogeographic factors significantly correlated with cultivation
intensity were selected to construct a dataset of global land suitability for
cultivation. It has been verified that land suitability results can effectively
indicate cultivation intensity. The dataset can indicate the potential
cultivation capacity, and this method also provides a new vision for developing
a region-based spatially explicit allocation of historical cropland.
Author Contributions
Ye, Y. and Fang, X. Q. designed the overall dataset
development. Zhang, C. P. contributed to the data analysis, designed the
algorithms and wrote the data paper.
Conflicts of Interest
The authors declare no conflicts of interest.
References
[1]
Ellis, E., Kaplan, J., Fuller, D., et al. Used planet: a global history [J]. Proceedings of the National Academy of Sciences, 2013, 110(20):
7978–7985.
[2]
Foley, J., DeFries, R., Asner, G., et al. Global consequences of land use [J]. Science, 2005, 309(5734): 570–574.
[3]
Gaillard, M. LandCover6k: global anthropogenic land-cover change
and its role in past climate [J]. PAGES
Magazine, 2015, 23(1): 38–39.
[4]
Lambin, E., Geist, H. Land-use and Land-cover Change: Local
Processes and Global Impacts [M]. Berlin: Springer Science & Business
Media, 2008.
[5]
Klein Goldewijk, K., Beusen, A., Doelman, J., et al. Anthropogenic land use estimates for the Holocene–HYDE 3.2
[J]. Earth System Science Data, 2017,
9(2): 927–953.
[6]
Moran, E., Ojima, D., Buchmann, B., et al. Global Land Project: Science Plan and Implementation
Strategy [M]. Stockholm: IGBP Secretariat, 2005.
[7]
Ramankutty, N., Foley, J., Hall, F., et al. ISLSCP II historical croplands cover, 1700-1992 [DB/OL]. ORNL DAAC, 2010.
[8]
Ramankutty, N., Foley, J. Estimating historical changes in global
land cover: croplands from 1700 to 1992 [J]. Global Biogeochemical Cycles, 1999, 13(4): 997–1027.
[9]
Pongratz, J., Reick, C., Raddatz, T., et al. A reconstruction of global agricultural areas and land cover
for the last millennium [J]. Global
Biogeochemical Cycles, 2008, 22(6): 1–16.
[10]
Kaplan, J., Krumhardt, K., Ellis, E., et al. Holocene carbon emissions as a result of anthropogenic land
cover change [J]. The Holocene, 2011,
21(5): 775–791.
[11]
Boyle, J., Gaillard, M., Kaplan, J., et al. Modelling prehistoric land use and carbon budgets: a
critical review [J]. The Holocene,
2011, 21(5):1–8.
[12]
Pielke, R., Pitman, A., Niyogi, D., et al. Land use/land cover changes and climate: modeling analysis
and observational evidence [J]. Wiley
Interdisciplinary Reviews: Climate
Change, 2011, 2(6): 828–850.
[13]
Ge, Q. S., Dai, J. H., He, F. N., et al. Numerical changes and driving factor of provincial cropland
resources in China over the past 300 years [J]. Natural Resources Advance, 2003, 13(8): 825–832.
[14]
Lin, S. S., Zheng, J. Y., He, F. N. The approach for gridding data
derived from historical cropland records of the traditional cultivated region
in China [J]. Acta Geographica Sinica,
2008, 61(1): 83–92.
[15]
Ye, Y., Fang, X. Q., Ren, Y. Y., et al. Reconstruction of cropland cover changes in the Northeast
China over the past 300 years [J]. Science
China: D Series, 2009, 39(3): 340–350.
[16]
He, F. N., Li, S. C., Zhang, X. Z., et al. Comparisons of cropland area from multiple datasets over the
past 300 years in the traditional cultivated region of China [J]. Journal of Geographical Sciences, 2013,
23(6): 978–990.
[17]
Li, S. C., He, F. N., Zhang, X. Z. A spatially explicit
reconstruction of cropland cover in China from 1661 to 1996 [J]. Regional Environmental Change, 2016,
16(2): 417–428.
[18]
Yang, X., Jin, X., Guo, B., et
al. Research on reconstructing spatial distribution of historical cropland
over 300 years in traditional cultivated regions of China [J]. Global and Planetary Change, 2015, 128:
90–102.
[19]
Zhang, C. P., Ye, Y., Fang, X. Q. Global cultivatable land
suitability dataset based on physical-geographic factors [J/DB/OL]. Digital Journal of Global Change Data
Repository, 2022. https://doi.org/ 10.3974/geodb.2022.04.01.V1. https://cstr.escience.org.cn/CSTR:20146.11.2022.04.01.V1.
[20]
GCdataPR Editorial Office. GCdataPR data sharing policy [OL].
https://doi.org/10.3974/dp.policy.2014.05 (Updated 2017).
[21]
Fick, S., Hijmans, R. WorldClim2: new 1km spatial resolution
climate surfaces for global land areas [J]. International
Journal of Climatology, 2017, 37(12): 4302–4315.
[22]
Danielson, J., Gesch, D. Global Multi-resolution Terrain Elevation
Data 2010 (GMTED2010) [M]. Washington, DC, USA: US Department of the Interior,
US Geological Survey, 2011.
[23]
Pinzon, J., Tucker, C. A non-stationary 1981–2012 AVHRR NDVI3g
time series [J]. Remote Sensing,
2014, 6(8): 6929–6960.
[24]
Mantel, S.,
Kempen, B. SoilGrids250m: Global gridded soil information based on machine
learning [J]. PLoS ONE, 2017, 12:
e0169748.
[25]
Zhang, C.,
Ye, Y., Fang, X., et al. Synergistic
modern global 1 km cropland dataset derived from multi-sets of land cover
products [J]. Remote Sensing, 2019,
11(19): 1–18.