Middle and Primary Public
School Districts Dataset in Nanjing Urban Area (2008, 2018)
Chen, Y. R.1,2 Tu, T. Q.2,3 Song, W. X.1,4*
1. Nanjing Institute of Geography and Limnology,
Chinese Academy of Sciences, Nanjing 210008, China;
2. University of Chinese Academy of Sciences,
Beijing 100049, China;
3. Institutes of Science and Development,
Chinese Academy of Sciences, Beijing 100190, China;
4. Nanjing Institute of Geography and Limnology,
Key Laboratory of Watershed Geographic Sciences, Chinese Academy of Sciences,
Nanjing 210008, China
Abstract: Nanjing??s main
urban area consists of an inner urban area enclosed by the Ming Dynasty city
wall and the surrounding areas, namely Xuanwu district, Gulou district, Qinhuai
district, Jianye district, Yuhuatai district (northeast part), Jiangning district
(northern part), and Qixia district (west side). Relying primarily on text-based
data, specifical descriptions from education resources of the compulsory public
school district in Nanjing??s main urban area, for 2008 and 2018, the author
first confirmed the location of each school and the scope of its school
district, and then sorted and compiled the dataset according to year (2008, 2018),
by referring to the Open Street Map and Baidu Map with the support of ArcGIS
software. The final dataset includes the following: (1) Raster data of public
primary school locations (.tif); (2) School district distribution data of
public primary schools, comprising their school district scope, school name,
presence or absence of branch schools, the school area, and an admission rate
of Nanjing Foreign Language School (.shp); (3) Raster data of public middle school locations (.tif); (4)
School district distribution data of public middle schools, comprising their school
district scope, school name, school area, and average score data for the senior
high school entrance examination (.shp). The full dataset is archived in .tif,
.shp formats and consists of 56 data files. The data size is 8.08 MB (compressed
to 245 KB). The analysis and research results based on this dataset appeared in
a Geography Research (Volume 38, issue
8) published in 2019.
Keywords: compulsory education resources; middle school
and primary school; school district; spatial differences; Nanjing urban; Geography Research
1 Introduction
The development of education is related to the comprehensive
national strength and international competitiveness of the country. Compulsory
education, which is universal, obligatory, and cost-free, forms the basis for
improving national quality and achieving social equity[1]. The Chinese
government has committed to giving priority to a balanced system of education,
as fairness in education has become an important issue in modern society[2].
However, under the constraints of the school district system policy, the unreasonable,
unbalanced and unfair allocation of compulsory education resources has
gradually become apparent, which presents a serious problem[3?C4].
The
spatial pattern of educational facilities and the fair allocation of educational
resources have become significant issues for social geographers, both at home
and abroad[5?C7]. Currently, urban geographers mainly evaluate the
balance and distribution of urban educational resources from the perspectives
of space-time accessibility, the spatial distribution of educational resources,
and school clustering and spatial pattern evolution, often with the help of GIS
network analysis, the shortest time method, trend surface analysis in addition
to other technologies[8?C12]. Some scholars build equilibrium
constraint models from variables, such as house prices, population,
transportation, terrain, and the distance between schools, to analyze the
availability of educational resources[13?C17]. The National Education
Department has issued a series of policies to promote the balanced development
of educational resources. Whether or not the allocation of educational
resources directly affects the development of education[18],
especially under the ??school district system?? policy??although the phenomenon of
??school selection by score?? and ??school selection by money?? has waned??with the
sharp rise in the mean price of ??school district housing??, the phenomenon of
??school selection by housing?? has greatly affected how fair the urban education
resource allocation is in mainland China[19].
Optimizing
the allocation of educational resources and realizing substantial fairness of this
allocation is indispensable to, and plays a significant role in, the
development of education[20]. As an important base of scientific
research and education in China, Nanjing has amassed a wealth of educational
culture, which may better capture the spatial configuration of educational
resources in China??s mega-cities. This dataset explores the spatial pattern and
evolution of primary school and middle school locations and their school
district division in Nanjing, which could provide a new perspective for the
study of social problems such as class differentiation and residential space
differentiation, thereby making a contribution to advancing the fair allocation
of compulsory education resources in China, and alleviating the education gap
between different socioeconomic classes in urban internal space.
2 Metadata of the Dataset
The metadata of the dataset[21] is summarized in
Table 1. It includes full name, short name, authors, geographical region,
calendar years, temporal resolution, spatial resolution, data format, data
size, data files, data publisher, and data sharing policy, etc.
3 Data Source and Study
Areas
3.1 Data
Source
According
to the education map and the list of schools on the website of the Education Bureau
of Nanjing City and other administrative districts, data on the spatial distribution
of the primary school and middle school educational resources, their school
area, school district, and other basic education facilities in the main urban
area of Nanjing in 2018 were obtained. The corresponding data in 2008 come from the
data contained in the ??Campus land planning of primary school and middle school
in Nanjing (2006?C2020)??, ??The statistical yearbook of Nanjing?? and the 2008
edition of the map of Nanjing[23?C25]. Data on Nanjing
Foreign Language School??s admission rate and the average score of middle school
entrants were compiled from the Municipal Education Bureau as well as the
soxue.com, and the data of campus area were compiled from soxue.com[26?C28].
For some schools that could not be found,
their respective area was digitized by using Google map satellite imagery and
calculated in ArcGIS software. The spatial database of educational facilities
in Nanjing??s primary schools
Table 1 Metadata summary of ??School
districts dataset of middle and primary public school in
Nanjing urban area (2008, 2018)??
|
Items
|
Description
|
|
Dataset
full name
|
School districts dataset of middle and primary public
school in Nanjing urban area (2008, 2018)
|
|
Dataset
short name
|
Middle&PrimarySchoolDistrict_Nanjing
|
|
Authors
|
Chen, Y. R. AAA-9864-2019, Nanjing
Institute of Geography and Limnology, Chinese Academy of Sciences, chenyanru18@mails.ucas.ac.cn
Tu, T. Q. AAA-9931-2019, Institutes
of Science and Development, Chinese Academy of Sciences, sgos1101@126.com
|
|
|
Song, W. X. N-1173-2018, Nanjing Institute of Geography
and Limnology, Chinese Academy of Sciences, wxsong@niglas.ac.cn
|
|
Geographical
region
|
Nanjing main urban area (31??57'10"N-32??09'43"N,
118??39'52"E-118??54'10"E)
|
|
Year
|
2008, 2018
Temporal resolution Year
|
|
Spatial
resolution
|
30 m ´ 30 m Data
format .tif, .shp
|
|
Data
size
|
8.08 MB (before
compression), 245 KB (after
compression)
|
|
Data
files
|
1. Location raster data (.tif) of public primary schools;
2. School district distribution data (.shp) of public primary schools; 3. Location
raster data (.tif) of public middle schools; 4. School district distribution
data of public middle schools (.shp)
|
|
Foundation
|
National Natural Science Foundation of China (41771184)
|
|
Data
publisher
|
Global Change Research Data
Publishing & Repository, http://www.geodoi.ac.cn
|
|
Address
|
No. 11A, Datun Road, Chaoyang District, Beijing 100101, China
|
|
Data
sharing policy
|
Data from
the Global Change Research Data Publishing & Repository includes
metadata, datasets (data products), and publications (in this case, in the Journal of Global Change Data & Discovery). Data sharing policy include: (1) Data
are openly available and can be freely downloaded via the Internet; (2) End
users are encouraged to use Data subject to citation; (3)
Users, who are by definition also value-added service providers, are welcome
to redistribute Data subject to written permission from the GCdataPR Editorial
Office and the issuance of a Data redistribution license; and (4)
If Data
are used to compile new datasets, the ??ten percent principal?? should be
followed such that Data records utilized should not
surpass 10% of the new dataset contents, while sources should be noted in
suitable places in the new dataset[22]
|
|
Communication
and searchable system
|
DOI, DCI, CSCD, WDS/ISC, GEOSS, China
GEOSS, Crossref
|
and middle schools were established
using the Baidu Map tool, by collecting the longitude and latitude information
of the schools?? geographical position, and then arranging, compiling, and
analyzing this collected data. As a result of the 2013 administrative territorial
entity adjustment in Nanjing, this dataset has been revised for primary schools
and middle schools in 2008 based on the latest (2018) administrative
territorial entity??s location.
3.2
Study Area
Nanjing is an important regional core city of the Yangtze
River Delta integration, and also a typical representative cities in south-east
China. With its long history, profound cultural accumulation, and significant
modern urbanization features, Nanjing is apt to reflect the spatial configuration
of educational resources in China??s major cities. Therefore, as our study area,
Nanjing has the significance of representativeness, universality, and
diversity. Nanjing city is composed of 11
districts. The research scope of this dataset covers the main urban area of
Nanjing, consisting of Xuanwu district, Gulou district, Qinhuai district,
Jianye district, Yuhuatai district (northeastern part), Jiangning district
(northern part) and Qixia district (western part).
3.3 Technical Route of Data Development
Technical Route was shown in Figure 1.
Data on school distribution in the Nanjing??s main urban area, in 2008 and 2018
respectively, were collected and collated. ArcGIS, concerning, for example,
Open Street Map and Baidu Map, was used to obtain each school??s location latitude
and longitude, school area distribution, school location points for rasterizing, and school area distribution
boundaries for vector processing. First, according to the number, area, and grade of the schools, we evaluated
the spatial and temporal differences in the
|
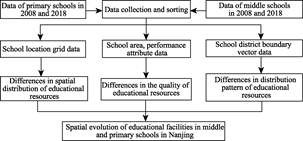
Figure 1 Technical route
|
scale and quality of compulsory education resources; then, we visualized
the spatial distribution of primary schools and middle schools, in both 2008
and 2018, from which we analyzed the growth and change in the number structure
of primary schools and middle schools from 2008 to 2018; based on those results,
we next summarize the spatial distribution differences; finally, we compared
the evolution characteristics of primary school and middle school districts from
2008 to 2018, and analyze the differences in the distribution.
4 Results and Validation
4.1 Data
Products
The dataset has four parts: (1) Raster data of public
primary school locations (.tif); (2) School district distribution data of
public primary schools, comprising their school district scope, school name,
presence or absence of branch schools, the school area, and an admission rate
of Nanjing Foreign Language School (.shp); (3) Raster data of public middle
school locations (.tif); (4) School district distribution data of public middle
schools, comprising their school district scope, school name, school area, and
average score data for the senior high school entrance examination (.shp).
4.2 Data
Results
According to the dataset compiled for Nanjing??s primary
schools and middle schools, from 2008 to 2018, the number of primary school
districts in the study area decreased from 153 to 143, the total area of
schools increased from 1.51 km2 to 1.61 km2, and the
number of middle schools increased from 47 to 50, while the total area of
school increased from 1.28 km2 to 1.42 km2 (Table 2). Despite a reduction in the number of primary schools, due to
the merger of inner-city schools and
the splitting and expansion of peripheral schools, the total area of schools
has increased, the scale of primary education facilities has expanded, and the
number of middle schools has increased by 3, but the total area of all schools
has only increased by 0.14 km2, with little change evident in their
scale.
However, the
development of primary education quality was relatively unbalanced. In terms of
the admission rate of Nanjing Foreign Language School, only six primary schools
exceeded the 10% threshold in 2008 and these were concentrated in the Gulou
District. In 2018, only seven primary schools have an admission rate surpassed
10%: those same six from the Gulou District plus a new Beijing East Road
Primary School in the Xuanwu District, and generally the high-quality schools
are relatively concentrated geographically. Middle schools with the score above
550 decreased from 14 to 9, going from 2008 to 2008. Setting aside the
difficulty of the examination paper, the schools with high scores have strong
stability and the degree of educational quality aggregation is thus relatively
balanced. Generally, the imbalance in the education quality of middle schools
is less than that of primary schools[29].
It can be seen from Figure 2 that, for
primary schools, the core-periphery spatial structure of their distribution in
Nanjing is remarkable, showing a pattern expanding from the central urban area
to the periphery. In 2008, the primary schools were mainly concentrated in the
old urban areas within the Ming Dynasty city wall and their clustering is
obvious, with the Gulou district accounted for 35.29%, while Qinhuai district
and Xuanwu district respectively accounted for 28.10% and 16.34% of them. With
the merger of inner-city primary schools and the splitting and expansion of
peripheral primary schools, the spatial distribution of primary schools became
more balanced in 2018, and the density of schools in Nanjing??s peripheral areas
increased. Yet, when compared with primary schools, the overall layout of
middle schools is more balanced and stable. From 2008 to 2018, the layout of
middle schools further expanded to the periphery, and the allocation rate of
peripheral education resources likewise increased.
Table 2 Data characteristics of
middle and primary schools in the main urban area of Nanjing
|
Item
|
2008
|
2018
|
|
Primary school
|
Middle school
|
Primary school
|
Middle school
|
|
Number
|
153
|
47
|
143
|
50
|
|
Total area (km2)
|
1.51
|
1.28
|
1.61
|
1.42
|
|
High school entrance examination results
(> 550); or Admission rate of Nanjing Foreign Language school (>10%)
|
Lhasa Road primary school (16.01); Langya
Road primary school (14.05); Lixue primary school (12.24); Jinling Huiwen primary
school (10.82); Fangcaoyuan primary school (10.24); Yincheng primary school
(10.18)
|
Shuren middle school (624.2); Xincheng middle
school (616.6); No.3 middle school (597.6); No.29 middle school (592.6); Kelihua
middle school (589.7); Jinling Huiwen middle school (581.3); No.1 middle
school (579.9); Zhonghua middle school(566.5); No.50 middle school (563.4); No.13
middle school (562.3); Bole middle school (558.2); Wenchang middle school of
No.3 middle school (554.1); No.12 middle school (553.0); No.9 middle school (552.0)
|
Langya Road primary school (17.01); Lhasa
Road primary school (16.25); Fangcaoyuan primary school (15.6); Beijing East Road primary school (13.2);
Lixue primary school (12.5); Yincheng primary school (11.34); Jinling Huiwen primary
school (10.07)
|
Shuren middle school (598.9); Huangshan
Road, Xincheng middle school(577.5); No.3 middle school (577.0); No.29 middle
school (576.8)??Xincheng middle school (572.6); Kelihua middle school (572.4);
Jiangnan middle school of the chemical plant (565.8); Jinling Huiwen middle
school (561.7); No.1 middle school (559.5)
|
Note: The
bracketed data in primary school is the admission rate of Nanjing foreign
language school, and the bracketed data in middle school is the score of the
senior high school entrance examination. Due to the reform of the Nanjing
mid-term exam scores in 2014, to facilitate data comparison, the total scores
of the 2008 and 2018 mid-term exams were standardized for 700 points.
The service scope in the inner city of the primary school
district is smaller than that in the peripheral area, and the accessibility of
the inner-city school district is higher. The middle school districts are
larger in scale and wider in the scope of their services. From a spatial
perspective, most of the residential areas are allocated to the nearest school
district according to the principle of proximity to schools. However, a small
number of residential areas are also allocated to school districts further
away, resulting in reduced accessibility of students?? getting to school and
increased transportation costs. On the whole, the service range of the
peripheral schools is wider than that of the inner-city schools, but the unbalanced
distribution of educational resources has increased due to the outdated
peripheral school facilities and the heavy load they shoulder. Changes in
school-carrying pressures may, therefore, force the education authorities to
adjust the boundaries of school districts, thus affecting the accessibility and
quality of education in residential areas, which could have a profound impact
on the allocation pattern of compulsory education[29].
5 Discussion and Conclusion
China??s
large population places a large demand on its educational resources. Based on ensuring
basic educational resources, we should further ensure the effectiveness and efficiency
of educational resources?? allocation, aim to improve the balance of educational
structure and distribution of educational resources and strive to achieve a
fair and reasonable allocation
of educational resources[30].
Using available data on the school district distribution and teaching
|
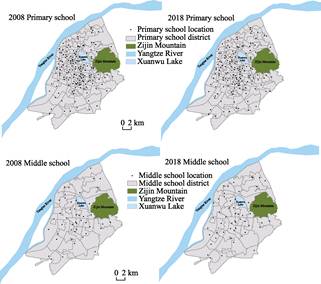
Figure 2 Distribution
of middle schools and primary schools in the main urban areas of Nanjing
|
quality of primary and middle schools in Nanjing, this compiled
dataset focused on analyzing the evolution characteristics of the spatial
pattern of compulsory education in Nanjing, to provide new research materials
and perspectives for studying the equitable allocation of urban compulsory
education resources in China. The influencing factors of education inequality
and the imbalanced allocation of educational resources are numerous and complicated.
This article only visualizes the data of primary and middle school locations
and school district ranges, expanded upon via a simple data description and spatial
analysis. This was not combined, however, with considerations of the relationships
among traffic accessibility, time accessibility, opportunity availability,
facility capacity allocation, education quality and allocation of teaching resources,
or other external factors, such as government education policies, employment
distribution, and changes in housing prices around each school. On its own, the
dataset for Nanjing is insufficient, in that it cannot fully explain the issue
of educational inequity, which many Chinese cities are facing. Nonetheless,
this dataset does provide a data basis for further research, but additional data
on internal and external factors that can affect the efficiency of educational
resource allocation need to be collected and collated. The focus of subsequent
research should be based on these data, to elucidate the mechanisms underpinning
impacts as well as spatial effects behind the imbalance in the allocation of urban
education resources; to strengthen the perspective of the social space allocation
model of urban education resources in China, and to better understand the
differentiation on the social class and living spaces caused by an unbalance in
education resources. Social issues such as differentiation provide a reference
point for the government to implement fair planning of space for educational
facilities and to promote the high-quality and balanced development of
compulsory education resources in Chinese cities.
Author Contributions
Song, W. X. was responsible for the
overall design used for the development of the dataset; Tu, T. Q. collected and
processed the data, such as the location of primary and middle schools and the
boundaries of school districts; Chen, Y. R. sorted out the attribute data, analyzed
the data, and wrote the data paper.
References
[1]
Liu, L.
Research on resource allocation efficiency of compulsory education in Anhui
Province [D]. Xuzhou: China University of Mining and Technology, 2019.
[2]
Zhang, N. M.
Research on the balanced development path of education in Henan Province [J]. Think Tank Times, 2019(34): 131-132.
[3]
Chen, H. J.
From digital transformation to big data management: research on digital integration
path of educational resources [J]. Educational
Theory & Practice, 2019,
39(16): 22-26.
[4]
Liu, Z. B.
Analysis of the allocation of primary education resources under the multiple models
[J]. Educational Watch, 2019, 8(14):
77-78.
[5]
Hall, J.
Does school district and municipality border congruence matter? [J]. Urban Studies, 2015, 54(7): 1601-1618.
[6]
Wu, Q. Y., Zhang, X. L., Waley, P.
Jiaoyufication: when gentrification goes to school in the Chinese inner city
[J]. Urban Studies, 2016, 53(12):
3510-3526.
[7]
Wu, Q. Y., Zhang, X. L., Waley, P. When
Neil Smith met Pierre Bourdieu in Nanjing, China: bringing cultural capital
into rent gap theory [J]. Housing Studies,
2017, 32(5): 659-677.
[8]
Hu, S. Q.,
Xu, J. G., Zhang, X., et al.
Equalization evaluation of educational facility layout based on time accessibility
[J]. Planner, 2012, 28(1): 70-75.
[9]
Xie, T. T., Feng, C. C., Yang, Y. C. Research on the fairness of
spatial distribution of education facilities in River Valley cities: a case
study of Lanzhou middle school [J]. Urban
Development Research, 2014, 21(8): 64-67.
[10]
Terxeira,
J. C., Antunes, A. P??A hierarchical location model for public
facility planning [J]. European Journal
of Operational Research, 2008, 185(1): 92-104.
[11]
Lu, X. X.,
Lu, Y. Q., Shang, Z. Y., et al. Measurement
and analysis of school system scale adjustment and spatial evolution
characteristics: a case study of Nanjing senior high school [J]. Geographical Sciences, 2011, 31(12):
1454-1460.
[12]
Zhao, C. X.,
Shao, J. A., Guo, Y., et al. Spatial
pattern evolution characteristics and development level of rural schools in
mountainous areas [J]. Geography Research,
2016, 35(3): 455-470.
[13]
Song, W. X., Tu, T. Q., Yin, S. G., et
al. Study on the differentiation and effects of social-spatial
accessibility to compulsory education resources in Nanjing [J]. Geography Research, 2019, 38(8): 2008-2026.
[14]
Taylor, R.
G., Vasu, M. L., Causby, J. F. Integrated planning for school and community: the
case of Johnston county, north Carolina [J]. Interfaces, 1999, 29(1): 67?C89.
[15]
Bruno, G.,
Genovese, A., Piccolo, C., et al. A location
model for the reorganization of a school system: the Italian case study [J]. Procedia-Social and Behavioral Sciences,
2014, 108(3/4): 96-105.
[16]
Zhang, X. F.
Spatial distribution analysis of rural primary and secondary schools in Gongyi city
based on GIS [D]. Zhengzhou: Henan University, 2008.
[17]
Ji, Y. S.
The role of geographic information system technology in the adjustment of the
layout of primary and middle schools [J]. Geospatial
Information, 2006, 4(6): 62-64.
[18]
Zheng, H.
H. Exploration of substantially fair allocation of educational resources [J]. Teaching and Management, 2018(30): 31-33.