Long and Short Duration Heavy Rainfall Dataset in Mainland China (1961-2015)
Kong, F.1,2,3
1. Center for Crisis Management Research, School of Public Policy and Management, Tsinghua University, Beijing 100084, China;
2. Central Asia Atmospheric Sciences Center, Urumqi 830002, China;
3. Training Center, China Meteorological Administration, Beijing 100081, China
Abstract: The frequent occurrence of heavy rainfall in many regions of the world has led to frequent occurrence of urban sea-watching phenomenon under the background of rapid urbanization and global climate change, which has caused great damage to social and economic development and many other aspects. Based on the data of 659 meteorological observation stations in China from 1961 to 2015, and on the basis of the definition of daily heavy rainfall by the Central Meteorological Observatory of the China Meteorological Administration (the daily rainfall is more than 50 mm), the heavy rainfall events lasting more than 2 days are defined as long duration heavy rainfall (LDHR) events. The heavy rainfall events lasting only 1 day are defined as short duration heavy rainfall (SDHR) events. The short and long duration heavy rainfall events are defined as total heavy rainfall (THR) events. Meanwhile, by introducing the contribution rate of heavy rainfall, the proportion of long (short) duration heavy rainfall to the total heavy rainfall is defined as the contribution rate of LDHR and SDHR to THR, and the proportion of THR to the total rainfall (TR) is defined as the contribution rate of THR to TR. The datasets of different duration heavy rainfall and its contribution rate are calculated according to the linear trend based on the least square method. Meanwhile, seven geographical regions are used to calculate the difference of the LDHR and SDHR in different zones. The dataset includes the data from 659 meteorological observation stations, which reflects spatial evolution characteristic of total rainfall (TR), THR, short and long duration heavy rainfall (SDHR, LDHR) in China (.doc and .xlsx formats). Seven geographical regions data in China is 780 KB (.shp format, compressed into a .zip file, 440 KB).
Keywords: long and short duration; heavy rainfall; contribution rate; geographical region; China; 1961-2015
1 Introduction
The frequent occurrence of heavy rainfall (HR) events in many regions of the world has caused severe impacts on production, life and economic and social development under the background of global change[1–5]. Different durations of HR events may be the result of different weather systems in different time scales, which, generally, have different physical mechanisms[6]. Because short duration heavy rainfall (SDHR) events may be closely related to solar radiation heating, SDHR events are mostly the product of severe convective weather and generally, the rainfall intensity is relatively large, but the duration is relatively short[7]. Flood disasters in urban areas are mostly closely related to extreme SDHR events[8]. However, long duration heavy rainfall (LDHR) events are generally the product of weather system processes, which change with the development of weather processes, and therefore last for a relatively long time[9–11]. Hence, diagnosis of spatial differentiation of LDHR and SDHR events is of great significance for further understanding the spatial evolution of HR. Based on the HR threshold set by the Central Meteorological Observatory of China Meteorological Administration, this study use duration of HR events to calculate the LDHR and SDHR dataset in China from 1961 to 2015. The dataset can provide important data support for the analysis of HR events with different durations and their contributions to the THR events.
2 Metadata of Dataset
The name, author, geographical region, year, dataset composition, data size, data files, data publisher, data sharing policy, and other information of the dataset of short and long duration heavy rainfall dataset of China (1961-2015)[12] are shown in Table 1.
3 Method
3.1 Definition of Long and Short Duration Heavy Rainfall and its Contribution Rate
The daily precipitation data of 1961-2015 used in this research are from the daily precipitation dataset V3.0 of China’s surface climate data in the ground meteorological data database of China Meteorological Science Data Sharing Service Network[6]. The heavy rainfall (HR) events are defined as when the total amount of precipitation in 24 hours exceeds 50 mm, according to the classification criteria of rainfall intensity issued by the Central Meteorological Observatory of China Meteorological Administration. The HR events lasting only 1 day are defined as short duration heavy rainfall (SDHR) events, and those lasting more than 2 days are defined as long duration heavy rainfall (LDHR) events. The sum of LDHR and SDHR events are defined as total heavy rainfall (THR) events. The rainfall events that 24 hour rainfall exceeding 0 mm are defined as total rainfall (TR) events. Based on the above definition, the annual TR, THR, LDHR and SDHR at 659 meteorological stations in China from 1961 to 2015 are calculated respectively. Then, the rainfall contribution rate is used, and the proportion of THR to TR is defined as THR contribution rate.
The proportion of short heavy rainfall to THR is defined as the short duration heavy rainfall contribution rate, and the proportion of long duration heavy rainfall to THR is defined as the long duration heavy rainfall contribution rate. According to the definition, this research calculates three field data in the .xlsx file of the LDHR and SDHR spatial differentiation data folder, which are the proportion of THR to TR, the proportion of SDHR to THR, and the proportion of LDHR to THR.
Table 1 Metadata summary of short and long duration heavy rainfall dataset of China (1961-2015)
|
Items
|
Description
|
|
Dataset full name
|
Short and long duration heavy rainfall dataset of China (1961-2015)
|
|
Dataset short name
|
GeographicRegionsChina
|
|
Authors
|
Kong, F. P-2607-2018, Center for Crisis Management Research, School of Public Policy and Management, Tsinghua University, kongfeng0824@foxmail.com
Fang, J. P-1535-2019, School of Resources and Environmental Science, Wuhan University, yfangjian06@whu.edu.cn
Lv, L. L. P-1203-2019, Research Centre for Strategic Development, China Meteorological Administration, lvll@cma.gov.cn
Shi, P. J. P-1601-2015, State Key Laboratory of Earth Surface Processes and Resource Ecology, Beijing Normal University, spj@bnu.edu.cn
Liu, F. P-1607-2019, State Key Laboratory of Earth Surface Processes and Resource Ecology, Beijing Normal University, liufan.bnu@foxmail.com
Wang, Z. P-2003-2019, State Key Laboratory of Earth Surface Processes and Resource Ecology, Beijing Normal University, bnuwangzhu@foxmail.com
Yang, X. P-2101-2018, State Key Laboratory of Earth Surface Processes and Resource Ecology, Beijing Normal University, yangxu8@mail.bnu.edu.cn
|
|
Geographical region
|
Geographical scope includes 4°00′N-53°31′N, 73°40'E-135°05′E. The geographical range covers the whole mainland China, but does not include Hong Kong, Macao, and Taiwan
|
|
Year
|
1961-2015 Data format .xlsx, .doc, .shp
|
|
Data size
|
780 KB (440 KB after compression)
|
|
Dataset files
|
The dataset consists of three folders, namely, the LDHR and SDHR spatial differentiation data folder, the station statistics folder, and the seven geographical regions in China folder:
1. The long and short duration heavy rainfall spatial differentiation data folder is the long and short duration heavy rainfall amounts dataset of China from 1961 to 2015 in .xlsx format. The data size is 84 KB
2. The station statistics folder include 7 files in .doc format, which are the station number of heavy rainfall in China and seven geographical regions. The data size is 368 KB
3. The seven geographical regions folder is the data of seven geographical regions in China in .shp format. The data size is 328 KB
|
|
Foundations(s)
|
National Natural Science Foundation of China (41601561); China Postdoctoral Science Foundation (2015M582263)
|
|
Data publisher
|
Global Change Research Data Publishing & Repository, http://www.geodoi.ac.cn/
|
|
Address
|
No. 11A, Datun Road, Chaoyang District, Beijing 100101, China
|
|
Data sharing policy
|
Data from the Global Change Research Data Publishing and Repository includes metadata, datasets (data products), and publications (in this case, in the Journal of Global Change Data & Discovery). Data sharing policy includes: (1) Data are openly available and can be downloaded via the Internet; (2) End users are encouraged to use Data subject to citation; (3)Users, who are by definition also value-added service providers, are welcome to redistribute Data subject to written permission from the GCdataPR Editorial Office and the issuance of a Data redistribution license; and (4) If Data are used to compile new datasets, the ‘ten percent principal’ should be followed such that Data records utilized should not surpass 10% of the new dataset contents, while sources should be clearly noted in suitable places in the new dataset[13]
|
3.2 Variation Trend Calculation
The calculating method of variation trend used in this research is as follows:
For 659 meteorological observation stations in China from 1961 to 2015, the annual TR, THR, SDHR, LDHR and their contribution rate series is stored in matrix xj with sample size n=55. Using tj to represent the corresponding time, the linear regression equation between xj and tj is established as follows:
 (1)
(1)
Where a is the regression constant and b is the regression coefficient. The least square method can be used to calculate a and b.
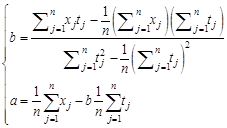 (2)
(2)
The sign of regression coefficient b represents the linear trend of annual TR, THR, SDHR, LDHR and their contribution rate. b>0 indicates an increasing trend, and b<0 indicates a decreasing trend. The size of regression coefficient b reflects the rate of increase or decrease. The regression coefficient b is called the variation trend of TR, THR, SDHR, LDHR and their contribution rate.
According to the above equations, this research calculates 7 field data in the .xlsx file of the LDHR and SDHR spatial differentiation data folder. Those are respectively the variation trend of TR, the variation trend of THR, the variation trends of SDHR and LDHR, the variation trend of the proportion of THR to TR, the proportion of SDHR and LDHR to THR.
3.3 Data of Seven Geographical Regions in China and Their Statistics of Station Number
In this research??China is divided into seven geographical regions: Northeast China (NE China), North China (N China), Central China, East China (E China), South China (S China), Northwest China (NW China), and Southwest China (SW China), excluding Hong Kong, Macao and Taiwan. Detailed description of the seven geographical regions can be found in Table 1 in the seven geographical regions folder. Seven geographical regions are used to calculate the number of stations in the whole country and in each of seven geographical regions, including the annual TR, THR, LDHR, SDHR, and their contribution rates. The data details can be found in Tables 2-7 of the station statistics folder.
4 Dataset Composition and Validation
4.1 Dataset Composition and Visualization
The dataset consists of three folders, namely, the long and short duration heavy rainfall (LDHR and SDHR) spatial differentiation data folder, the station statistics folder and the seven geographical regions in China folder. They are:
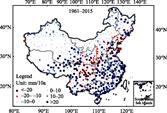
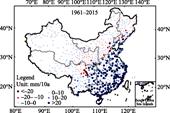
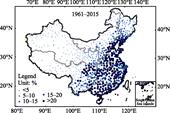
(1) The long and short duration heavy rainfall (LDHR and SDHR) spatial differentiation data folder is the LDHR and SDHR dataset of China in .xlsx format from 1961 to 2015. The data include 10 fields, namely, trend of TR, trend of THR, trend of LDHR and SDHR, proportion of THR to TR, proportion of SDHR to THR, proportion of LDHR to THR, trend of proportion of THR to TR, trend of proportion of SDHR to THR, and trend of proportion of LDHR to THR. Visualization of these data is shown in Figures 1–7[6].
|
|
|
|
Figure 1 Total rainfall trend in 1961-2015, China
Note: The base map in this study is from the National Basic Geographic Information Center of China in 2008.
|
Figure 2 Total heavy rainfall trend in 1961-2015, China
|
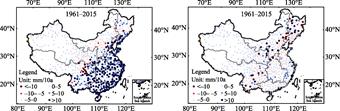
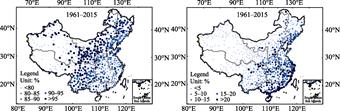
Figure 3 Short (left) and long (right) duration heavy rainfall trend in 1962-2015, China
|
|
|
|
Figure 4 Proportion of total heavy rainfall to total rainfall (in percentage) in 1961-2015, China
|
Figure 5 Proportion of short (left) and long (right) duration heavy rainfall to total heavy rainfall in 1961-2015, China
|
|
|
|
|
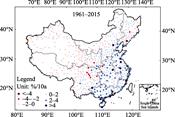
Figure 6 Trend of proportion of total heavy rainfall to total rainfall in 1961-2015, China
|
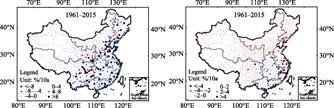
Figure 7 Trend of proportion of short (left) and long (right) duration heavy rainfall to total heavy rainfall in 1961-2015, China
|
(2) The station statistics folder contains seven .doc files.
Ÿ Table 1: Seven geographical zoning characteristics in China;
Ÿ Table 2: Station number of total rainfall, total, short and long duration heavy rainfall’s trend in China;
Ÿ Table 3: Station number of total rainfall, total, short and long duration heavy rainfall’s trend in different regions;
Ÿ Table 4: Station number of proportions of different duration heavy rainfall to total heavy rainfall in China;
Ÿ Table 5: Station number of proportions of different duration heavy rainfall to total heavy rainfall in different regions;
Ÿ Table 6: Station number of proportions of different duration heavy rainfall to total rainfall’s trend in China;
Ÿ Table 7: Station number of proportions of different duration heavy rainfall to total rainfall’s trend in different regions.
(3) The seven geographical regions folder archives the boundary data in .shp format.
4.2 Discussion
The station number with an increasing trend of the percentage of total heavy rainfall (THR) to total rainfall (TR) and station number of the trend of the percentage of LDHR and SDHR to THR is significantly larger than that with a decreasing trend in seven geographical regions (Table 2). Most of the stations in Northeast, North, East, Northwest and Southwest China showed a decreasing trend in the trend of the percentage of LDHR and SDHR to THR, while the stations in Central and South China showed an increasing trend.
Table 2 Station number of the trend of the proportion of different duration heavy rainfall in seven geographical regions of China
|
Parameter
|
Variation trend
|
Station number and the proportion to the total rainfall
|
|
NE China
|
N China
|
Central China
|
E China
|
S China
|
NW China
|
SW China
|
|
Total heavy rainfall
|
<0
|
19 (2.88%)
|
31 (4.70%)
|
5 (0.76%)
|
3 (0.46%)
|
0 (0.00%)
|
32 (4.86%)
|
33 (5.01%)
|
|
>0
|
59 (8.95%)
|
56 (8.50%)
|
70 (10.62%)
|
82 (12.44%)
|
58 (8.80%)
|
116 (17.60%)
|
95 (14.42%)
|
|
Short duration heavy rainfall
|
<0
|
17 (2.58%)
|
26 (3.95%)
|
5 (0.76%)
|
14 (2.12%)
|
0 (0.00%)
|
34 (5.16%)
|
31 (4.70%)
|
|
>0
|
61 (9.26%)
|
61 (9.26%)
|
70 (10.62%)
|
71 (10.77%)
|
58 (8.80%)
|
114 (17.30%)
|
97 (14.72%)
|
|
Long duration heavy rainfall
|
<0
|
50 (7.59%)
|
73 (11.08%)
|
24 (3.64%)
|
50 (7.59%)
|
15 (2.28%)
|
137 (20.79%)
|
84 (12.75%)
|
|
>0
|
28 (4.25%)
|
14 (2.12%)
|
51 (7.74%)
|
35 (5.31%)
|
43 (6.53%)
|
11 (1.67%)
|
44 (6.68%)
|
This research only discusses the accuracy and influencing factors of the dataset. The daily precipitation data of 1961-2015 used in this research are from the daily precipitation dataset V3.0 of China’s surface climate data in the ground meteorological data database of China Meteorological Science Data Sharing Service Network. According to the principle of keeping as many stations as possible and ensuring the continuous observation time, this research refers to the existing research results[10–11], i.e., if the station data is missing more than 5% of 55 years, the station will be excluded; For stations whose missing data is less than 5% of 55 years, the missing daily value can be obtained by using adjacent stations to fill in the missing daily value or the interdecadal mean of the station can be used to fill in the missing daily value of the station. Based on the above quality control, we get 659 qualified precipitation metrological observation stations. Although the supplement of observation stations can correct the data quality and reduce the difference with the actual data, it still has some errors compared with the real situation, and still needs to be compared with the observation data from different sources in the world. However, it is certain that the supplemented data do not affect the temporal and spatial characteristics of heavy rainfall over a long period of time and over a wide range in China. It is still irreplaceable for other data to diagnose temporal and spatial variations of long duration heavy rainfall by using supplementary observation data, and the modeling credit still largely relies on observation data for verification. The different durations of heavy rainfall data and their contribution rates are of great significance for understanding the spatial and temporal dynamics of heavy rainfall events.
5 Conclusion
Long and short duration heavy rainfall (LDHR and SDHR) dataset in mainland China from 1961 to 2015 show the spatial variation of total rainfall (TR), total heavy rainfall (THR), LDHR and SDHR and their contribution rate in China. It provides important basic data for scientifically diagnosing the disaster intensity and risk assessment of different types of heavy rainfall in Chinese cities, and provides reference for scientifically and effectively managing water resources and establishing relevant policies.
References
[1] IPCC SREX. Managing the risks of extreme events and disasters to advance climate change adaptation [R]. London: Cambridge University Press, 2012.
[2] IPCC AR5. Intergovernmental panel on climate change climate change 2013 fifth assessment report (AR5) [R]. Cambridge, UK: Cambridge University Press, 2013.
[3] Tan, C., Kong, F., Guo, J., et al. Temporal and spatial patterns of heavy rainfall in different urbanized areas of China from 1961 to 2014: a case study of Beijing-Tianjin-Hebei, Yangtze River Delta and Pearl River Delta [J]. Journal of Catastrophology, 2018, 33(3): 132-140.
[4] Kong, F., Fang, J., Lv, L. L. Diagnosis of heavy rainfall variation in China from 1961 to 2015 and its relation with various climate factors [J]. Journal of Tropical Meteorology, 2018, 34(1): 34-47.
[5] Kong, F., Lv, L. L., Fang, J., et al. Statistical analysis of heavy rainfall in 1951-2010 based on climate change regionalization in China [J]. Research on Soil and Water Conservation, 2017, 24(5): 189-196, 203.
[6] Kong, F., Fang, J., Lv, L. L., et al. Spatial difference of contribution of long and short duration heavy rainfall to total heavy rainfall in China from 1961 to 2015 [J]. Arid Land Geography, 2017, 40(2): 293-303.
[7] Kong, F., Fang, J., Lv, L. L., et al. Spatial and temporal pattern of long and short duration heavy rainfall and their contribution to total heavy rainfall in China (1951-2010) [J]. Population, Resources and Environment in China, 2016, 26(S2): 316-320.
[8] Kong, F., Lv, L. L., Fang, J., et al. Interdecadal spatial and temporal evolution characteristics of heavy rainfall with different intensities in China (1951-2010) [J]. Journal of Capital Normal University (Natural Science Edition), 2017, 38(5): 75-85.
[9] Kong, F., Lv, L. L., Fang, J., et al. Difference of spatial and spatial variation of heavy rainfall in China based on daily and hourly precipitation data from 1991 to 2010 [J]. Journal of Catastrophology, 2017, 32(1): 72-79.
[10] Shi, P. J., Kong, F. Study on the relevant factors of spatial and temporal patterns of interdecadal accumulated heavy rainfall in China from 1951 to 2010 [J]. Scientia Geographica Sinica, 2016, 36(10): 1457-1465.
[11] Shi, P. J., Kong, F., Fang, J. Y. Spatial and temporal change patterns of decadal heavy rainfall in China [J]. Scientia Geographica Sinica, 2014, 34(11): 1281-1290.
[12] Kong, F., Fang, J., Lv, L. L., et al. Short and long duration heavy rainfall dataset of China (1961-2015) [DB/OL]. Global Change Research Data Publishing & Repository, 2018. DOI: 10.3974/ geodb.2018.05.13.V1.
[13] GCdataPR Editorial Office. GCdataPR data sharing policy [OL]. DOI: 10.3974/dp.policy.2014.05 (Updated 2017).