Methodology of Dataset Development on Extreme
Precipitation Indexes in Weihe River Basin (1961-2016)
Zhou, Q.1*
Zhang, H. N.1 Ren,
Y. X.2
1. College of Geography and Environment, Baoji University
of Arts and Sciences, Baoji 721013, China;
2. College of Urban and Environmental Sciences, Northwest
University, Xi'an 710127, China
Abstract: Based on the daily precipitation
data from 25 meteorological stations during 1961-2016, this paper formed the dataset of extreme precipitation indexes of Weihe River basin
(1961?C2016) through a series of processing
methods such as unit conversion, outlier correction, meteorological data
interpolation, error correction, and linear trend method. This dataset is
composed of the following three parts: (1) Location data of the data collection
point; (2) nine extreme precipitation-related indexes, including: total annual
precipitation (PRCPTOT), continuous wetting index (CWD), precipitation
intensity (SDII), the number of days with heavy precipitation (R10mm), the
number of heavy rain days (R25mm), 1 day??s maximum precipitation (Rx1day), 5
day??s maximum precipitation (Rx5day), total heavy precipitation (R95PTOT), and
total extreme precipitation (R99PTOT); (3) years with sudden changes in
precipitation indexes. The data set is stored in .shp and .xlsx formats and
consists of 8 data files. Its data volume is 55.5 KB which has been compressed
into one data file of 39.0 KB. This dataset can provide data support for the
study of extreme precipitation in the Weihe River basin, and the temporal and
spatial differentiation rules of rainstorms and floods.
Keywords: Weihe River basin; extreme precipitation index; Mann-Kendall
nonparametric test
Dataset Availability Statement:
The
dataset supporting this paper was published and is accessible through the Digital Journal of Global Change Data Repository at:
https://doi.org/10.3974/geodb.2021.02.06.V1.
1 Introduction
The
extreme climate indexes proposed by the World Meteorological Organization at
the Climate Change Monitoring Conference have become a unified standard for
climate change research. This set of extreme climate indexes contains a total
of 27 core indexes, including 11 extreme precipitation indexes and 16 extreme
temperature indexes, which were calculated from daily temperature data and daily
precipitation data. In this paper, 9 precipitation-related extreme indexes were
selected from them according to the temporal and spatial distribution
characteristics of precipitation in the study area. Traditional methods such as
linear regression algorithm[1,2], Mann-Kendall non-parametric test[3?C7]
and Morlet wavelet analysis method[8,9] are the mostly frequently
used approaches in the research on extreme precipitation index, among which
Mann-Kendall non-parametric test[6] can analyze the change trend and
mutation point of meteorological data.
The Weihe River
basin is located in a continental monsoon climate zone, which is also a
transitional zone between arid and humid regions. As a result, it is uneven in
the spatial distribution of precipitation, and is prone to heavy rain and flood
disasters. The evolution rule of the spatial-temporal distribution
characteristics of extreme precipitation in the Weihe River basin not only
helps to improve basin??s ability to respond to extreme climate events and disasters,
but also provides basic research on the occurrence of extreme climate events in
the surrounding area.
2 Metadata of the Dataset
The metadata of the Extreme precipitation dataset of Weihe
River basin (1961-2016) is summarized in Table 1. It includes the dataset
full name, short name, authors, year of the dataset, temporal resolution,
spatial resolution, data format, data size, data files, data publisher, and
data sharing policy, etc.
Table 1 Metadata summary of the Extreme precipitation
dataset of Weihe River basin (1961-2016)
|
Item
|
Description
|
|
Dataset full name
|
Extreme precipitation
dataset of Weihe River basin (1961-2016)
|
|
Dataset short name
|
ExtremePrecipitationWeiheBasin_1961-2016
|
|
Authors
|
Zhou, Q. AAB-7588-2021, College of Geography and Environment,
Baoji University of Arts and Sciences, cbozhou@163.com,
Zhang, H. N., College of Geography and Environment, Baoji
University of Arts and Sciences, 765049056@qq.com
Ren, Y. X., College of Urban and Environment Sciences,
Northwest University, 282180595@qq.com
|
|
Geographical region
|
Weihe River basin
|
|
|
Data format
|
.xlsx
|
Year 1961?C2016
|
|
Data volume
|
55.5 KB (after compression)
|
|
Data files
|
(1) Location data of the data collection point; (2) nine extreme
precipitation-related indexes, including: total annual precipitation
(PRCPTOT), continuous wetting index (CWD), precipitation intensity (SDII),
the number of days with heavy precipitation (R10mm), the number of heavy rain
days (R25mm), 1 day??s maximum precipitation (Rx1day), 5 day??s maximum precipitation
(Rx5day), total heavy precipitation (R95PTOT), and total extreme
precipitation (R99PTOT); (3) years with sudden changes in precipitation
indexes
|
|
Foudations
|
National Natural Science Foundation of China (411771215); Shaanxi Province
(2020SF-385)
|
|
Data publisher
|
Global Change Research Data Publishing & Repository,
http://www.geodoi.ac.cn
|
|
Address
|
No. 11, Datun Road, Chaoyang District, Beijing 100101, China
|
|
Data sharing policy
|
Data from
the Global Change Research Data Publishing & Repository includes metadata, datasets (in the Digital Journal of Global Change Data Repository), and
publications (in the Journal of Global Change Data & Discovery). Data sharing policy
includes: (1) Data are openly available and can be free downloaded via the
Internet; (2) End users are encouraged to use Data subject to
citation; (3) Users, who are by definition also value-added service providers,
are welcome to redistribute Data subject to written permission
from the GCdataPR Editorial Office and the issuance of a Data redistribution
license; and (4) If Data are used to compile new
datasets, the ??ten per cent principal?? should be followed such that Data
records utilized should not surpass 10% of the new dataset contents, while
sources should be clearly noted in suitable places in the new dataset[11]
|
|
Communication and searchable system
|
DOI, DCI, CSCD, WDS/ISC, GEOSS, China GEOSS, Crossref
|
|
|
|
|
3 Data Processing
3.1 Data Source and Preprocessing
First, the daily meteorological data from 25
meteorological stations in the Weihe River basin with complete climate
elements, uniform spatial distribution and relatively complete time series were
selected for pre-processing and quality inspection. Specifically, unit
conversion and outlier correction were performed on the daily meteorological
data. The missing data within three days were replaced by the mean
precipitation of the two days before and after, and the missing data in 3 or
more days were replaced by 99.99 as specified in the program[12].
The daily weather data period is 1961‒2016. Then, based on the R ClimDex software,
the extreme precipitation index of each meteorological station was calculated
and a time series was established[13]. By calculating the weighted
average of the extreme precipitation indexes of various meteorological stations
in different regions, the 1961?C2016 extreme precipitation index sequences for
the upper, middle and lower reaches of the Weihe River basin and the whole basin
were obtained. These sequences contain a total of 36 sets of data. The division
of meteorological stations in the basin is shown in Table 2 and Figure 1.
Table 2 Distribution
of meteorological stations in different regions of Weihe River basin
|
Basin
|
Meteorological station
|
|
Upper reaches
|
Qin??an, Qingshui, Tianshui, Weiyuan, Wushan,
Zhangjiachuan
|
|
Middle reaches
|
Baoji, Fufeng, Huxian, Meixian, Qishan, Qianyang,
Wugong, Xingping, Chang??an
|
|
Lower reaches
|
Dali, Fuping, Lantian, Lintong, Luochuan, Qianxian,
Tongguan, Weinan, Changwu, Zhidan
|
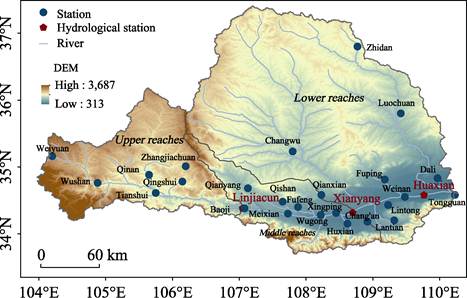
Figure
1 Distribution Map of
water systems and meteorological stations in the Weihe River basin
3.2 Technical route
The
linear trend method and Mann-Kendall non-parametric test were used to analyze
the variation trend and abrupt changes of the nine extreme precipitation
indices in the upper, middle, and lower reaches as well as the Weihe River basin,
so as to study the spatial differences of each index among different regions. The
technical route of dataset development was shown in Figure 2.
4 Data Results and Validation
4.1 Data Composition
The adopted dataset
contains the following information: (1) Location data of the data collection
point; (2) nine extreme precipitation-related indexes, including: total annual
precipitation (PRCPTOT), continuous wetting index (CWD), precipitation intensity
(SDII), the number of days with heavy precipitation (R10mm), the number of
heavy rain days (R25mm), 1 day??s maximum precipitation (Rx1day), 5 day??s
maximum precipitation (Rx5day), total heavy precipitation (R95PTOT), and total
extreme precipitation (R99PTOT); (3) years with sudden changes in precipitation
indexes.
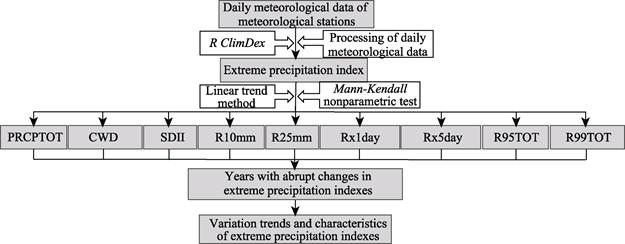
Figure 2 The technical route of dataset development
4.2 Data Results
Through processing and
analyzing the extreme precipitation indexes in different regions of the Weihe
River basin, it is found that there are spatial differences in extreme precipitation
indexes in the upper, middle and lower reaches (Tables 3 and 4). The average
value of total precipitation in the middle reaches of the Weihe River basin is
601.70 mm at its maximum, the upstream minimum average is 495.50 mm, and the
average value of the whole basin is 560.15 mm. The
years of extreme precipitation events in the Weihe River basin are concentrated
in the 1990s and the early 21st century[14]. And the inter-annual
differences in precipitation are large, with the most obvious changes in the
middle reaches.
Table 3 Examples
of total annual precipitation data of the Weihe River basin (1961-2016)
(mm)
|
Year
|
Upper reaches
|
Middle reaches
|
Lower reaches
|
Weihe River basin
|
|
1961
|
690.80
|
643.10
|
663.78
|
662.82
|
|
1962
|
522.17
|
592.02
|
521.98
|
547.24
|
|
??
|
??
|
??
|
??
|
??
|
|
2015
|
403.02
|
583.46
|
575.85
|
537.11
|
|
2016
|
389.75
|
517.70
|
505.68
|
482.18
|
Table 4 Years with abrupt changes in the extreme
precipitation indexes of the Weihe River basin (excerpt)
|
Index
|
Upper reaches
|
Middle reaches
|
Lower reaches
|
Weihe River basin
|
|
Total annual precipitation
|
1969, 1985
|
2010
|
1985
|
1985
|
|
Continuous wetting
index
|
1976
|
1969
|
1974
|
1976
|
|
??
|
??
|
??
|
??
|
??
|
|
Total extreme
precipitation
|
1982, 2005
|
1998
|
1999
|
1998
|
4.3 Data Validation
The data error results from
the lack of daily meteorological data from meteorological stations, but the
data quality of this dataset has been tested to minimize the data errors.
5 Discussion and Conclusion
The overall extreme
precipitation index (1961?C2016) of the entire Weihe River basin cannot clearly
reflect the spatial difference of extreme precipitation conditions in the
upper, middle and lower reaches. The data of the nine extreme precipitation
indexes and mutation years of the upper, middle and lower reaches of the Weihe
River basin and the whole basin were calculated. This data set provides data
support for the analysis of the differences in characteristics of extreme
precipitation in different regions of the Weihe River basin, and for the research
on the occurrence of extreme climate events in the basin. Furthermore, research
on the trend analysis and future prediction of extreme precipitation in the basin
can be carried out based on this dataset.
Author Contributions
Zhou, Q. was responsible for the overall design for the development of the
data set; Zhang, H. N. collected and processed extreme precipitation data; Ren,
Y. X. designed the algorithm; Zhang, H. N. wrote the paper.
Conflicts of Interest
The authors
declare no conflicts of interest.
References
[1]
Ji, Q., Yang, J. P., Chen, H.
J. Comprehensive analysis of precipitation changes on the Qinghai-Tibet Plateau
from 1961 to 2015 [J]. Journal of
Glaciology and Geocryology, 2018, 40(6): 1‒10.
[2]
Hu, D. X., Li, L., Zhang, Y.
Water quality changes and trends before and after comprehensive treatment of
the Shaanxi section of the main stream of the Weihe River [J]. Bulletin of Soil and Water Conservation,
2018, 38(5): 91‒96.
[3]
Cui, F. Q., Tang, H. P., Zhang, Q.
Spatiotemporal changes of extreme climate events in Hulunbuir Grassland during
1960?C2017
[J]. Arid Zone Research, 2018, 35(6):
1382‒1391.
[4]
Li, B., Xie, J. C., Hu, Y. H., et al. Variation characteristics of
precipitation and runoff in the Weihe River basin from 1961 to 2013 [J]. South-to-North Water Transfers and Water
Science Technology, 2017, 15(2): 29‒36.
[5]
Yao, Z. X., Yang, J., Liu, D.
Variation characteristics of precipitation and runoff in the Weihe River basin
from 1956 to 2005 [J]. Yellow River,
2016, 38(1): 12‒18.
[6]
Lu, X. M., Lu, B. H., Deng, S. Analysis
of precipitation characteristics and trend forecast in Hangzhou city in the
past 63 years [J]. Water
Power, 2015, 41(11): 17‒20.
[7]
Zhao, C. P., Chen, Y., Wang, W.
G., et al. Temporal and spatial
changes of extreme precipitation indexes in the Yellow River Basin over the
past 50 years [J]. Yellow River,
2015, 37(1): 18‒22.
[8]
Du, H. B., Wu, Z. F., Zhang, N.,
et al. Variation characteristics of
extreme temperature and precipitation events in Dandong during the past 60
years [J]. Geographical
Science, 2013, 33(4): 473‒479.
[9]
Cai, X. L., He, H., Wang, F. Q., et al. Analysis of precipitation changes in Shaanxi province
over the past 47 years [J]. China Desert,
2010, 30(2): 446‒451.
[10]
Zhou,
Q., Zhang, H. N., Ren, Y. X. Extreme precipitation dataset of
Weihe River basin (1961?C2016) [J/DB/OL]. Digital Journal of Global Change Data Repository, 2021. https://doi.org/ 10.3974/geodb.2021.02.06.V1.
[11]
GCdataPR Editorial Office.
GCdataPR Data Sharing Policy [OL]. https://doi.org/10.3974/dp.policy.2014.05
(Updated 2017).
[12]
The
R Project for Statistical Computing. https://www.r-project.org/.
[13]
Zhang,
X. B., Yang, F. RClimDex (1.0), User manual [Z]. Canada: ClimDex Research
Branch Environment, 2004.
[14]
Zhou, Q., Zhang, H. N., Ren, Y. X.
Extreme precipitation events in the Weihe River basin during 1961?C2016 [J]. Geographical Science, 2020, 40(5):
833‒841.