Dataset of Biological Abundance Index of China in 1985 and 2005 at 1 km Resolution
Guo, C. X.1 Zhu, Y. Q.2,3,4* Sun, W.5 Song, J.2,3,4
1. Information Center, Ministry of Environmental Protection of P. R. China, Beijing 100035, China;
2. State Key Laboratory of Resources and Environment Information System, Institute of Geographic Sciences and Natural Resources Research, Chinese Academy of Sciences, Beijing 100101, China;
3. Jiangsu Center for Collaborative Innovation in Geographical Information Resources Development and
Application, Nanjing 210023, China;
4. Collaborative Innovation Center for Eco-Protection and Sustainable Development of Beijing-Tianjin-Hebei Region, Baoding 071002, China;
5. Institute of Agricultural Information, Chinese Academy of Agricultural Sciences, Beijing 100081, China
Abstract: The biological abundance index is an important indicator for assessment of eco-environmental quality. Based on the national land cover data for 1985 (before and after normalization) and 2005, and in accordance with the “Technical Specifications for Assessment of the Eco-environmental Conditions (Trial) HJ/T192-2006” issued by the former State Environmental Protection Administration, the biological abundance indices for 1985 (before and after normalization) and 2005 have been calculated with ArcGIS spatial analysis tools, and a comparative analysis has been performed. Based on this, statistics on the biological abundance indices of various provinces, and comparative analysis of the biological abundance indices of the various provinces in 1985 (before and after normalization) and in 2005 are compiled.
Keywords: biological abundance index; km grid; standard of the environmental protection industry;ecological environmental quality
1 Introduction
The eco-environment provides the basis for human reproduction, life and sustainable deve-
lopment [1]. With the rapid development of China’s industry and economy, the eco-environment has been seriously damaged. As a consequence, there is a pressing need to carry out effective monitoring and real-time evaluation of the nation`s eco-environmental quality. Many methods have been used to evaluate eco-environmental quality. However, due to differences in each region and the lack of sustainable access to environmental data, the assessment of eco-environment quality in China at present is based mainly on the “Technical Specifications for Assessment of the Eco-environmental Conditions (HJ/T192-2006)” issued in 2006 by the former State Environmental Protection Administration[2]. In this document, calculation of the eco-environmental quality involves five indices, namely, biological abundance, vegetation coverage, water network density, land degradation and environmental quality. Clearly, the biological abundance index is an important index[3–5].
Based on the data for 1??250,000 land coverage in China and the calculation model of the biological abundance index in the “Technical Specifications for Assessment of the Eco-environmental Conditions (Trial)”, the Dataset of Biological Abundance Index in China in 1985 (before and after normalization) and 2005[6] has been calculated by using the ArcGIS spatial analysis function. Based on this dataset, we have compiled statistics for the biological abundance indices of various provinces during the two periods and carried out a comparative analysis. These datasets may reflect the spatial pattern and the variation of biological abundance in the 1980s and 2005 in China, thus providing the basic data parameters for assessment of eco-environmental quality.
2 Metadata of Dataset
The descriptions of the BioIndex_China_1985&2005 dataset are recorded here. Table 1 summarizes the main metadata elements of the BioIndex_China_1985&2005 dataset.
Table 1 Metadata summary of the BioIndex_China_1985&2005 dataset
|
Items
|
Description
|
|
Dataset full name
|
Dataset of biological abundance index of China in 1985 and 2005 at 1 km resolution
|
|
Dataset short name
|
BioIndex_China_1985&2005
|
|
Authors
|
Guo, C. X. A-6440-2017, Institute of Geographic Sciences and Natural Resources Research, Chinese Academy of Sciences, guochunxia1991@163.com
Zhu, Y. Q., L-6116-2016, Institute of Geographic Sciences and Natural Resources Research, Chinese Academy of Sciences, zhuyq@lreis.ac.cn
Sun, W. L-6849-2016, Institute of Agricultural Information, Chinese Academy of Agricultural Sciences, sunwei1028@126.com
|
|
Geographic region
|
3°52¢–53°33¢ N, 73°30¢–135°2¢30² E, Year of data: 1985, 2005
|
|
Spatial resolution
|
1 km
|
Data format: GRID
|
Data size: 34.1 MB
|
|
Data files
|
The dataset consists of three data files:
1. bio_abun2005.zip is the data of the biological abundance index of 2005 (12.8 MB)
2. bio_abun1985.zip is the data of the biological abundance index of 1985(21.2 MB)
3. biochange_1985-2005.xls is the data on the rate of change of the biological index from 1985 to 2005 in various provinces in China (28 KB)
|
|
Foundation(s)
|
Ministry of Science and Technology of P. R. China (2013FY110900)
|
|
Data publisher
|
Global Change Research Data Publishing & Repository, http://www. geodoi.ac.cn
|
|
Address
|
No. 11A, Datun Road, Chaoyang District, Beijing 100101, China
|
|
Data sharing policy
|
Data from the Global Change Research Data Publishing & Repository includes metadata, datasets (data products), and publications (in this case, in the Journal of Global Change Data & Discovery). Data sharing policy includes: (1) Data are openly available and can be free downloaded via the Internet; (2) End users are encouraged to use Data subject to citation; (3) Users, who are by definition also value-added service providers, are welcome to redistribute Data subject to written permission from the GCdataPR Editorial Office and the issuance of a Data redistribution license; and (4) If Data are used to compile new datasets, the ‘ten per cent principal’ should be followed such that Data records utilized should not surpass 10% of the new dataset contents, while sources should be clearly noted in suitable places in the new dataset[7]
|
3 Calculation of the Biological Abundance Index
3.1 Definition and Calculation of the Biological Abundance Index
The biological abundance index refers to the difference of different ecosystem types in the number of species per unit area, and indirectly reflects the degree of biological abundance in the evaluated area. In this paper, the calculation model of the biological abundance index is based on the standard in the “Technical Specifications for Assessment of the Eco-environmental Conditions (Trial) HJ/T192-2006” issued by the former State Environmental Protection Administration, namely:
 (1)
(1)
 (2)
(2)
where  is the normalized difference index of the biological abundance and
  is the maximum value of the biological abundance index before the normalization process. The weight distribution of each land cover type is shown in Table 2.
Table 2 Land cover types and weightings in the calculation of biological abundance and their relationship with the original mapping[2]
|
The classification system of land cover and their weightings
in the calculation of the biological abundance index according
to the Technical Specifications for Assessment of the
Eco-environmental Conditions (Trial) HJ/T192-2006
|
The classification system of land cover data in 1985 (before and after normalization) and 2005 on the Earth System Science Data Sharing Platform (code)
|
|
Land cover class-1
|
Weighting
|
Land cover class-2
|
Weighting
|
Land cover class-2 (code)
|
|
Woodland
|
0.35
|
Land with forest
|
0.6
|
Land with forest (21)
|
|
Shrub land
|
0.25
|
Shrub wood (22)
|
|
Open forest land and other woodland
|
0.15
|
Open forest land (23)
|
|
Other woodland (24)
|
|
Grassland
|
0.21
|
High coverage grassland
|
0.6
|
High coverage grassland (31)
|
|
Medium coverage grassland
|
0.3
|
Medium coverage grassland (32)
|
|
Low coverage grassland
|
0.1
|
Low coverage grassland (33)
|
|
Water wetland
|
0.28
|
Rivers
|
0.1
|
Rivers and canals (41)
|
|
Lakes (reservoir)
|
0.3
|
Lakes (42)
|
|
Reservoir and pit ponds (43)
|
|
Tidal-flat wetland
|
0.6
|
Mudflat (45)
|
|
Beaches (46)
|
|
Marsh (64)
|
|
Cultivated land
|
0.11
|
Paddy field
|
0.6
|
Paddy fields (11)
|
|
Dry land
|
0.4
|
Dry land (12)
|
|
Construction land
|
0.04
|
Land for urban construction
|
0.3
|
Land for urban construction (51)
|
|
Rural settlements
|
0.4
|
Rural settlements (52)
|
|
Other construction land
|
0.3
|
Other construction land (53)
|
|
Used land
|
0.01
|
Sandy land
|
0.2
|
Sandy land (61)
|
|
Saline land
|
0.3
|
Saline land (63)
|
|
Bare land
|
0.3
|
Bare land (65)
|
|
Bare rock and gravel
|
0.2
|
Bare rock and gravel (66)
|
3.2 Description of Data Sources
The basic land cover data are from the National Earth System Science Data Sharing Platform (http://www.geodata.cn)[8].
Liao, S. B., Bai, Y., et al. selected the eastern Inner Mongolia, Poyang Lake, and the Qinling-Daba mountain region as samples to assess the accuracy of the land cover dataset of 2005 with the overall accuracy of the mapping up to 84.21% in the eastern part of the Inner Mongolia Autonomous Region, 75.08% in the Qinling-Daba mountain area and 61.67% in the Poyang Lake region. The mapping accuracy of various land cover types in different research areas were different. Farmland mapping accuracy for the Qinling-Daba mountain area and the eastern part of the Inner Mongolia Autonomous Region was 97.37% and 92.54%, respectively. The forest mapping accuracy of the eastern part of the Inner Mongolia Autonomous Region was 66.18%[9–11]. With the subdivision of land cover types, the mapping precisions were reduced.
3.3 Calculation Process
|
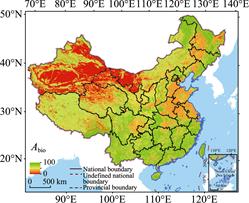
Figure 2 National biological abundance
index distribution around 1985
|
|
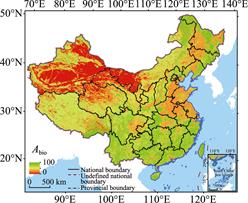
Figure 1 National biological abundance
index distribution in 2005
|
According to the calculation model for the biological abundance index and based on the land cover data of 1985 and 2005, the biological abundance index before normalization during the two periods, respectively, was calculated using the Raster Calculator tool of ArcGIS. Then the biological abundance index was calculated with the Raster Calculator according to the normalized coefficient formula, as shown in Figures 1 and 2. It can be seen from the figures that the biological abundance index was lowest in Northwest China and in the middle of the eastern coastal area, and highest in the southern region.
4 Results and Discussion
Based on the biological abundance index dataset at 1 km resolution, statistics for the average biological abundance index for the various provinces of China in 1985 (before and after normalization) and in 2005, respectively, (as shown in Table 3) were calculated using the Zonal Statistics function in ArcGIS. Table 3 shows the changes in the biological abundance index for various provinces from the 1980s to 2005. Overall, the biological abundance index of all provinces showed a declining trend. The rate of decline for the Hong Kong Special Administrative Region was the lowest, while those for the Macao Special Administrative Region, Shanghai and Tianjin were higher than that of the other provinces.
Table 3 The Biological Abundance Index for various provinces in China in 1985
(before and after normalization) and 2005 and the rate of change
|
Province
|
Biological Abundance Index in 1985
(before and after)
|
Biological Abundance
Index in 2005
(before and after)
|
Rate of
change
|
|
Xinjiang Uygur Autonomous Region
|
24.687,2
|
23.338,0
|
–5.47%
|
|
Heilongjiang Province
|
64.439,2
|
58.081,5
|
–9.87%
|
|
Jilin Province
|
61.163,8
|
57.364,0
|
–6.21%
|
|
Hebei Province
|
48.621,6
|
46.060,2
|
–5.27%
|
|
Inner Mongolia Autonomous Region
|
46.555,4
|
42.575,4
|
–8.55%
|
|
Beijing
|
62.499,8
|
58.696,4
|
–6.09%
|
|
Tianjin
|
38.040,1
|
33.532,5
|
–11.85%
|
|
Liaoning Province
|
59.851,6
|
57.171,8
|
–4.48%
|
|
Ningxia Hui Autonomous Region
|
45.700,5
|
42.604,7
|
–6.77%
|
|
Shandong Province
|
36.298,4
|
34.246,6
|
–5.65%
|
|
Shaanxi Province
|
55.725,1
|
53.724,1
|
–3.59%
|
|
Shanxi Province
|
57.865,0
|
54.755,7
|
–5.37%
|
|
Qinghai Province
|
39.364,9
|
37.767,4
|
–4.06%
|
|
Gansu Province
|
36.296,9
|
34.638,6
|
–4.57%
|
|
Henan Province
|
42.704,4
|
40.585,0
|
–4.96%
|
|
Jiangsu Province
|
36.571,3
|
34.568,8
|
–5.48%
|
|
The Tibet Autonomous Region
|
55.364,2
|
52.934,5
|
–4.39%
|
|
Shanghai
|
30.587,2
|
26.839,2
|
–12.25%
|
|
Anhui Province
|
48.964,9
|
46.713,6
|
–4.60%
|
|
Chongqing
|
59.783,7
|
58.330,2
|
–2.43%
|
|
Hubei Province
|
67.592,0
|
64.818,6
|
–4.10%
|
|
Hubei Province
|
74.959,7
|
71.012,6
|
–5.27%
|
|
Sichuan Province
|
63.236,1
|
60.554,7
|
–4.24%
|
|
Jiangxi Province
|
75.247,1
|
71.700,0
|
–4.71%
|
|
Guizhou Province
|
71.751,7
|
68.642,5
|
–4.33%
|
|
Hunan Province
|
75.022,0
|
71.606,0
|
–4.55%
|
|
Fujian Province
|
77.194,5
|
74.176,9
|
–3.91%
|
|
Yunnan Province
|
75.844,7
|
72.427,8
|
–4.51%
|
|
Guangxi Zhuang Autonomous Region
|
77.954,5
|
74.383,6
|
–4.58%
|
|
Taiwan
|
78.694,5
|
74.630,3
|
–5.20%
|
|
Hong Kong Special Administrative Region
|
71.725,6
|
71.670,4
|
–0.08%
|
|
Macao Special Administrative Region
|
47.164,7
|
36.518,4
|
–22.57%
|
|
Guangdong Province
|
74.272,8
|
70.900,0
|
–4.54%
|
|
Hainan Province
|
75.724,2
|
72.125,0
|
–4.75%
|
5 Conclusion
The biological abundance index is an indicator for assessment of eco-environmental quality. Based on the land cover data of 1985, 2005, and the assessment standard of the “Technical Specifications for Assessment of the Eco-environmental Conditions (Trial) HJ/T192-2006”, the biological abundance indices in 1985 and 2005 were calculated. On this basis, the average biological abundance indices for provinces in China were calculated also. The results showed that the biological abundance indices were lowest in Northwest China and in the middle of the eastern coastal area, and highest in the southern region. Overall, China’s biological abundance has been declining for nearly 20 years. Given the decline in eco-environment quality, there is an urgent need to perform real-time continuous monitoring together with effective evaluation of the eco-environmental quality. To this end and going forward, we plan to compile on a five year cycle biological abundance indices and other indices pertinent to the calculation of eco-environmental quality so as to lay the statistical foundation for assessment of China’s eco-environmental quality.
Author Contributions
Guo, C. X. was mainly responsible for the data processing, data analysis, writing and revision. Zhu, Y. Q. was mainly responsible for the dataset design, data coordination, data ana-
lysis methods and guidance on paper revision. Sun, W. was mainly responsible data analysis and guidance on writing and revision.
References
[1] Xu, Y., Zhou, H. R. A preliminary study on advances in assessment of the eco-environment quality in China [J]. Arid Land Geography, 2003, 26 (2): 166-172.
[2] State Environmental Protection Administration of China. Technical specifications for assessment of the eco-environmental conditions (trial): HJ/T192-2006 [S]. 2006.
[3] Liu, J. H, Xu, J. J., Li, C., et al. Study on normalized coefficient of the province-level biological abundance based on rs data updating: with Hubei province as an example [J]. Journal of Jianghan University (Natural Sciences), 2007, 35(4): 46-50.
[4] Zhang, Y., Wang, J. F., Huang, Y. L., et al. Discussion of the calculation of eco-environmental assessment indicators [J]. Hebei Journal of Industrial Science and Technology, 2008, 25 (6): 363-365.
[5] Yao, Y., Wang, S. X, Zhou, Y., et al. The application of the eco-environment index model in assessment of the national eco-environmental quality [J]. Remote Sensing Information, 2012, 27(3): 93-98.
[6] Guo, C. X., Zhu, Y. Q., Sun, W., et al. Dataset of biological abundance Index in 1985 and 2005 with 1km resolution [DB/OL]. Global Change Research Data Publishing & Repository, 2015. DOI: 10.3974/geodb.2015.01.03.V1.
[7] GCdataPR Editorial Office. GCdataPR data sharing policy [OL]. DOI: 10.3974/dp.policy.2014.05 (Updated 2017).
[8] National 1??250,000 land cover dataset (1980s, 2005) [OL]. National Earth System Science Data Sharing Platform. http://www.geodata.cn/Portal/metadata/viewMetadata.jsp?id=100101-11860.
[9] Liao, S. B., Liu, R., Yin, F. Validation for the Accuracy of land cover remote sensing mapping of China at scale of 1: 250000 in East Inner Mongolia [J]. Geographical Research, 2011, 30(3): 555-563.
[10] Bai, Y., Wang, J. L., Song, J. Accuracy evaluation of land cover remote sensing mapping at the scale of 1?? 250000 in the Poyang Lake Area of China [J]. Journal of Geo-information Science, 2012, 14 (4): 497-506.
[11] Liao, S. B., Zhu, H. Z., Bai, Y., et al. Field validation of the accuracy of land cover in remote sensing map at scale of 1 to 250000 in Qinling-Daba Mountain Area [J]. China Land Science, 2011, 25 (10): 58-62.