Dataset of a Drought Disaster and its Impacts on the Vegetation in the North China Plain, 2001
Yang, J. H. Wu, J. J.*
Faculty of Geographical Science, Beijing Normal University, Beijing 100875, China
Abstract: In order to study the impacts of drought disasters on vegetation, we selected the drought event in the North China Plain (NCP) that occurred during April-November 2001 based on the Standardized Precipitation Evapotranspiration Index (SPEI). And then we got the datasets by analyzing the Global Land Surface Satellite (GLASS) Leaf Area Index (LAI) and the Fraction of Absorbed Photosynthetically Active Radiation (FAPAR) data. The datasets included the followings: (1) the drought extent data, LAI anomalies, FAPAR anomalies from April to November in 2001 in the NCP and the drought severity index, the accumulation of LAI anomalies, the accumulation of the FAPAR anomalies during the drought periods. The data has a spatial resolution of 0.01° and a temporal resolution of 1 month; (2) the monthly LAI anomalies, FAPAR anomalies at different land cover and the 3-month scale SPEI from 2001 to 2014 in the area; (3) the multi-year (2001-2014) monthly average data of LAI anomalies, FAPAR anomalies of different vegetation and 3-month scale SPEI in the region; (4) the border file of this region. The datasets were stored in .tif, .xlsx, and .shp formats. The results showed that the area with minus LAI and FAPAR anomalies experienced severe drought. And compared with the croplands, the LAI anomalies and FAPAR anomalies of grasslands were much smaller, suggesting that the response of different vegetation to the drought was also different. Irrigation can mitigate the effects of drought on the croplands in the area.
Keywords: drought; vegetation; LAI anomalies; FAPAR anomalies; SPEI; the North China Plain
1 Introduction
There are great impacts on vegetation when drought disasters occur, and the response of different vegetation to drought is different[1–2]. We analyzed the influences of one drought disaster on different vegetation occurred in the North China Plain (NCP) in 2001 based on the SPEI[3], emergency events database (EM-DAT, https://www.emdat.be/) and the LAI and FAPAR products of GLASS[4] and got the dataset of a drought disaster and its impacts on vegetation.
The NCP (32°N-43°N, 110°E-122°E) belongs to the temperate monsoon climate zone. It is hot and rainy in summer, cold and dry in winter, with the average annual precipitation of about 600 mm[5]. The NCP with flat terrain and dense population is an important food production base because its main land cover type is croplands. However, the drought trend in this region has intensified with the climate change[6–7].
2 Metadata of Dataset
The metadata of the drought degree and its impacts on the vegetation dataset in North China (2001)[8] are summarized in Table 1.
Table 1 Metadata summary of the drought degree and its impacts on the vegetation dataset in North China (2001)
|
Items
|
Description
|
|
Dataset full name
|
The drought degree and its impacts on the vegetation dataset in North China (2001)
|
|
Dataset short name
|
DroughtVegNorthChina2001
|
|
Authors
|
Wu, J. J. Q-1391-2017, Faculty of Geographical Science, Beijing Normal University, jjwu@mail.bnu.edu.cn
Yang, J. H. N-3427-2018, Faculty of Geographical Science, Beijing Normal University, yangjh15@mail.bnu.edu.cn
|
|
Geographical region
|
the North China Plain Year
|
2001-2014
|
|
Temporal resolution
|
1 month Spatial resolution
|
0.01°
|
|
Data format
|
.tif, .shp, .xlsx
|
Data size
|
34.5 MB (after compression)
|
|
Data files
|
The dataset includes: (1) boundary SHP folder: store the vector border file of the study area, the data format is .shp; (2) drought extent folder: store the drought extent data during April-November 2001 of the study area, the data format is .tif, the temporal resolution is 1 month, the spatial resolution is 0.01°, the invalid value is -99, and the numbers 1-5 represent extreme drought, severe drought, mild drought, moderate drought and no drought respectively; (3) LAI anomaly folder: store the monthly LAI anomaly data during April-November 2001 of the study area, the data format is .tif, the temporal resolution is 1 month, the spatial resolution is 0.01°, the invalid value is 255, and the scale factor is 0.1; (4) LAI anomaly accumulative value folder: store the accumulation of the LAI anomalies at the drought period in this region, the data format is .tif, the spatial resolution is 0.01°, the invalid value is 255, and the scale factor is 0.1; (5) FAPAR anomaly folder: store the monthly FAPAR anomaly data during April-November 2001 of the study area, the data format is .tif, the temporal resolution is 1 month, the spatial resolution is 0.01°, the invalid value is 255, and the scale factor is 0.1; (6) FAPAR anomaly accumulative value folder: store the accumulation of the FAPAR anomalies at the drought period in this region, the data format is .tif, the spatial resolution is 0.01°, the invalid value is 255, and the scale factor is 0.1; (7) .xlsx file: store the statistic information of different land cover’s response to the drought disaster, and the data format is .xlsx
|
|
Foundation(s)
|
Ministry of Science and Technology of P. R. China (2016ST0010)
|
|
Data publisher
|
Global Change Research Data Publishing & Repository, http://www.geodoi.ac.cn
|
|
Address
|
No. 11A, Datun Road, Chaoyang District, Beijing 100101, China
|
|
Data sharing policy
|
Data from the Global Change Research Data Publishing & Repository includes metadata, datasets (data products), and publications (in this case, in the Journal of Global Change Data & Discovery). Data sharing policy includes: (1) Data are openly available and can be free downloaded via the Internet; (2) End users are encouraged to use Data subject to citation; (3) Users, who are by definition also value-added service providers, are welcome to redistribute Data subject to written permission from the GCdataPR Editorial Office and the issuance of a Data redistribution license, and; (4) If Data are used to compile new datasets, the ‘ten percent principal’ should be followed such that Data records utilized should not surpass 10% of the new dataset contents, while sources should be clearly noted in suitable places in the new dataset[9]
|
3 Methods
3.1 Algorithm
We identified the drought event based on the SPEI, and calculated the LAI anomalies and FAPAR anomalies to study the impacts of drought on vegetation by the following equations:
 (1)
(1)
 (2)
(2)
Since drought is a continuous process, the drought severity index (DSI) can reflect the overall severity of drought. Learning from the calculation methods of the DSI[10–11], the accumulation of LAI anomalies and the accumulation of FAPAR anomalies are defined and calculated as indicators of the cumulative effects of drought on vegetation by equation (3):
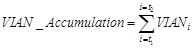 (3)
(3)
|
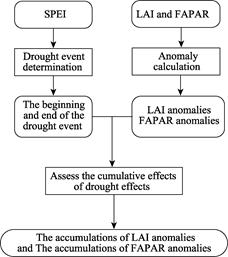
Figure 1 Workflow of the dataset development
|
3.2 Technical Routine
First of all, we identified the drought event based on the SPEI, then the LAI anomalies and FAPAR anomalies were calculated, and lastly we calculated the accumulations of LAI anomalies and the accumulations of FAPAR anomalies during the drought periods (Figure 1).
4 Results and Validation
4.1 Data Products
The datasets included six sub-folders and one file with the format of .xlsx. We can analyze the trend of LAI and FAPAR anomalies through the drought disaster information datasets of this region (Figure 2, Figure 3). The sub-folders named “the LAI anomalies” and “the FAPAR anomalies” were used to store the LAI and FAPAR anomalies files, they can be displayed in space by ArcMap (Figure 4, Figure 5). The other three sub-folders named “drought severity”, “the accumulations of LAI anomalies” and “the accumulations of FAPAR anomalies” were used to store the drought severity index file, the accumulations of LAI anomalies file and the accumulations of FAPAR anomalies file, the above three files can be showed in space by ArcMap as well (Figure 6).
4.2 Validation
The existing research suggest that our conclusions drawn from the present datasets are consistent with the their results[12–13]. In addition, the method used to calculate the accumulations of LAI and FAPAR anomalies provides a reference to study the cumulative effects of drought events on terrestrial vegetation.
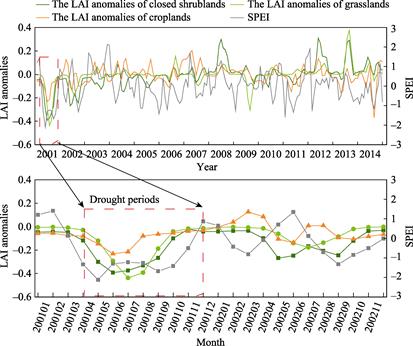
Figure 2 LAI anomalies of different vegetation in the North China Plain from 2001 to 2014
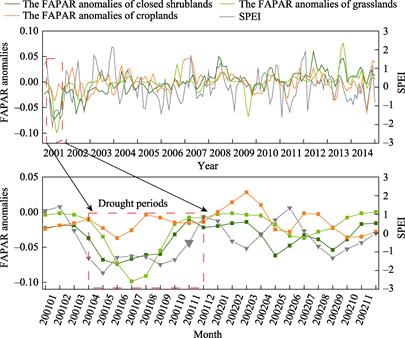
Figure 3 FAPAR anomalies of different vegetation in the North China Plain from 2001 to 2014
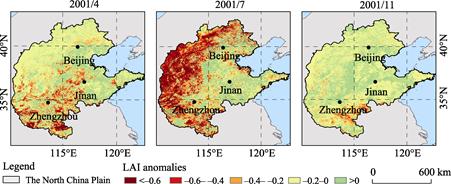
Figure 4 Spatial characteristics of LAI anomalies at different months in the North China Plain
5 Discussion and Conclusion
The study region of the dataset is the NCP. It was produced based on the LAI and FAPAR of GLASS, the spatial resolution of the dataset was 1 km, and the temporal resolution of the dataset was 1 month. The conditions of different vegetation influenced by the drought were analyzed combined with the MODIS land cover product[14–15].
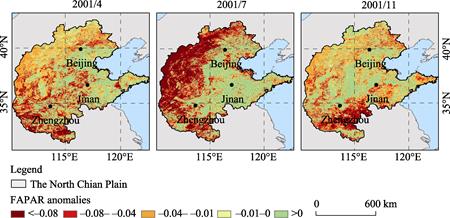
Figure 5 Spatial characteristics of FAPAR anomalies at different months in the North China Plain
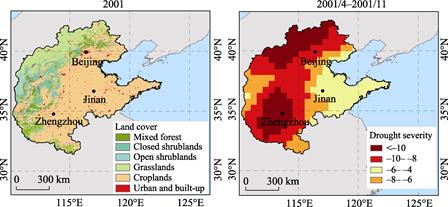
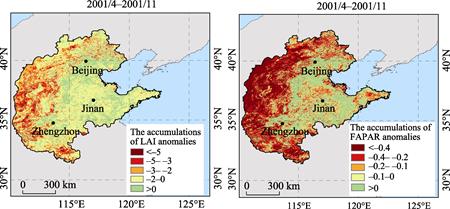
Figure 6 Spatial distribution of vegetation type, drought severity, and the accumulations of LAI and FAPAR anomalies in the North China Plain
References
[1] Kong, D. D., Zhang, Q., Gu, X. H., et al. Vegetation responses to drought at different time scales in China [J]. Acta Ecologia Sinica, 2016, 36(24): 7908-7918.
[2] Abbas, S., Nichol, J., Qamer, F., et al. Characterization of drought development through remote sensing: a case study in Central Yunnan, China [J]. Remote Sensing, 2014, 6(6): 4998-5018.
[3] Vicente-Serrano, S. M., Beguería, S., Lópezmoreno, J. I. A multiscalar drought index sensitive to global warming: The standardized precipitation evapotranspiration index [J]. Journal of Climate, 2010, 23(7): 1696-1718.
[4] Liang, S. L., Zhang, X. T., Xiao Z. Q., et al. Global Land Surface Satellite (GLASS) Products Algorithms, Verification and Analysis [M]. Switzerland: Springer International Publishing, 2014.
[5] Zhang, H., Feng, L. P. Characteristics of spatial-temporal variation of precipitation in North China in recent 50 Years [J]. Journal of Natural Resources, 2010, 25(2): 270-279.
[6] Wu, D. L., Wang, C. Y., Xue, H. X., et al. Temporal and spatial distribution of drought for winter wheat in North China [J]. Journal of Natural Disasters, 2012, 21(1): 18-25.
[7] Zhang, Y. J., Wang, C. Y., Zhang, J. Q. Analysis of the spatial and temporal characteristics of drought in the North China Plain based on standardized precipitation evapotranspiration index [J]. Acta Ecologia Sinica, 2015, 35(21): 7097-7107.
[8] Wu, J. J. Yang, J. H. The drought degree and its impacts on vegetation in the North China (2001) [DB/OL]. Global Change Research Data Publishing & Repository, 2017. DOI: 10.3974/geodb.2017.03.18.V1.
[9] GCdataPR Editorial Office. GCdataPR data sharing policy [OL]. DOI: 10.3974/dp.policy. 2014.05 (Updated 2017).
[10] Yang, H. Z., Liang, Z. M., Hu, Y. M., et al. Application of run-length theory to drought return period analysis of Yunnan Province [J]. Water Resources and Power, 2013, 31(12): 8-12.
[11] Zuo, D. D., Hou, W., Yan, P. C., et al. Research of drought in southwest China based on the theory of run and two-dimensional joint distribution theory [J]. Acta Physica Sinica, 2014, 63(23): 45-56.
[12] Liu, D. C., Zhou, L., Wu, J. J. Drought impacts on vegetation changes in North China [J]. Journal of Beijing Normal University (Natural Science), 2017, 53(2): 222-228.
[13] Zhao, S. Y., Gong, Z. N., Liu, X. Y. Correlation analysis between vegetation coverage and climate drought conditions in North China during 2001-2013 [J]. Acta Geographica Sinica, 2017, 70(2): 717-729.
[14] Friedl, M. A., Mciver, D. K., Hodges, J. C. F., et al. Global land cover mapping from MODIS: algorithms and early results [J]. Remote Sensing of Environment, 2002, 83(1): 287-302.
[15] Friedl, M. A., Sulla-Menashe, D., Tan, B., et al. MODIS Collection 5 global land cover: Algorithm refinements and characterization of new datasets [J]. Remote Sensing of Environment, 2010, 114(1): 168-182.