Methodology of Time Series of Soil Erosion Dataset in
Water Erosion Area of China in Five-year Increments (2000?C2015)
Li, J. L.1, 2 Sun, R. H.1, 2* Xiong, M. Q.3 Chen, L. D.1, 2
1. State Key Laboratory of Urban and Regional Ecology,
Research Center for Eco-Environmental Sciences, Chinese Academy of Sciences,
Beijing 100085, China;
2. University of Chinese Academy of Sciences, Beijing
100049, China;
3. Institute of Geographic Sciences and Natural Resources
Research, Chinese Academy of Sciences, Beijing 100101, China
Abstract: With the change of
global climate and the increase of human activities, soil erosion has become a
national even a global issue, which can limit the sustainable development of
economy and society. By using the Universal
Soil Loss Equation (USLE), we estimated the
reference values of the annual soil erosion in China in 2000, 2005, 2010 and
2015 respectively. We calibrated the rainfall erosivity factor (R) based
on climate zones and the cover-management factor (C) based on land-cover
types and agricultural crops. The support practice factor (P) was also
revised based on crop types and crop land slope. The results indicate that: (1)
The hotspots with major erosion rates are predicted to occur in Yunnan-Guizhou
Plateau, Loess Plateau and the foothill area of Kunlun Mountains, accounting
for 9.65% of the statistical area. (2) The hotspots with a rapid increase
during the study period are in the arable area of Xinjiang, Sichuan Basin,
southeastern Yunnan-Guizhou Plateau, Yangtze Plain and Northeast Plain, and the
erosion areas with a significant decrease are distributed in the southern and
eastern Loess Plateau, Qinling Mountains and Southeast Coast of China. This
dataset includes soil erosion values of China in 2000, 2005, 2010 and 2015 respectively,
of which unit is t∙ hm?C2∙a?C1, cell size is 1 km, and
format is .tif. These data are expected to provide a basis for making soil
conservation measures in different regions in China.
Keywords: Soil erosion; USLE
model; Rainfall erosivity; Soil conservation
DOI: https://doi.org/10.3974/geodp.2021.02.13
CSTR: https://cstr.escience.org.cn/CSTR:20146.14.2021.02.13
Dataset Availability Statement:
The dataset supporting this paper was published and
is accessible through the Digital Journal
of Global Change Data Repository at: https://doi.org/10.3974/geodb.2021.05.03.V1
or https://cstr.escience.org.cn/CSTR:20146.11.2021.05.03.V1.
1 Introduction
Soil erosion can lead to soil nutrient
loss, water siltation and eutrophication, carbon storage reduction, biodiversity decline, and even
population poverty. It has become one of the most serious threats to the
environment and economy in China and even the world[1?C4].
Quantitative assessment and change analysis of long-term soil erosion
can provide a certain theoretical basis and reference for researchers and
decision-makers related to agriculture and geo- biochemical cycles[5].
The USLE (Universal Soil Loss Equation) model is an
empirical model developed by the United States Department of Agriculture
(USDA). This model predicts the long-term average annual soil loss caused by
the processes of thin layer and rill erosion[6,7], describing the relationship between the soil loss rate
and control factors, such as rainfall, soil properties, topography, vegetation
coverage, and land management[8]. With the development of computing
technology, the advancement of geographic information systems (GIS) and the
availability of high-resolution images, the use of the USLE model in assessing large-scale water erosion has become
a reasonable and feasible method[9,10].
At present, most of the studies estimating soil erosion on a large scale or
even a global scale are based on the USLE equation and its revised versions[2,11?C15]. There have been a lot of
studies in China based on USLE and related models to carry out watershed-scale
soil erosion assessment[16?C18].
Currently, some studies have proposed optimization
methods of the input factors for the USLE
model[19?C24]. For example, based on the climate zone and land use
type on the regional scale, the rainfall erosivity (R) factor and vegetation coverage and management (C) factor in the USLE model are
calibrated[19,20].
However, the calculation method of other factors is relatively less optimized,
such as the soil and water conservation measure (P) factor. In addition, there are relatively few optimizations of
soil erosion factors and soil erosion assessments on a national scale. In order
to clarify the distribution pattern and trend of soil erosion in water erosion
areas in China, this study uses the newly published quantification and
optimization methods of factors in USLE model. The factors concerned are updated according to the
geographic and climatic features in China, which aims to improve the accuracy of the estimation
of soil erosion calculated by the USLE model.
2 Metadata of the Dataset
The metadata of the Time series of soil erosion dataset in
water erosion area of China in five-year increments (2000-2015)[25]
is summarized in Table 1. It includes the dataset full name, short name,
authors, year of the dataset, temporal resolution, spatial resolution, data
format, data size, data files, data publisher, and data sharing policy, etc.
3 Methods
3.1 Data Source and Processing
The rainfall data used in the calculation of this dataset are the daily precipitation data
from 1981 to 2015, recorded at 839 national-level stations
across China. They are downloaded from the China
Meteorological Data Network and the SPSS software is employed to obtain the annual precipitation,
latitude, longitude, and altitude of each station. The climate zone is based on the Köppen-Geiger climate classificaion[27]
. The original source of the Digital Elevation Model (DEM) data is from the US
Geological Survey??s ASTER GDEM data. The filling processing is performed before
the calculation. China??s annual vegetation index (Normalized Vegetation Index,
NDVI) data is based on SPOT/VEGETATION NDVI, generated by the maximum value
composite method. The resolution of the NDVI data is 1 km ??
1 km and the format is .tif. The land cover data are the CCI LC (Climate
Change Initiative Land Cover) data of the European Space Agency (ESA)[28],
of which the resolution is 300 m ?? 300 m and the format is converted to .tif
before calculation. China??s crop data (crop types and sown area) are downloaded
from the National Data of the National Bureau of Statistics in .csv format. The
soil composition data are downloaded from the International Soil Reference and
Information Centre (ISRIC). The content of clay, silt, sand, and organic carbon
in the soil data is used, of which the resolutions are 250 m ?? 250 m and the
format is .tif. For precipitation data, NDVI, land cover, and crop data, the
data in 2000, 2005, 2010, and 2015 are selected.
Table 1 Metadata summary of the Time
series of soil erosion dataset in water erosion area of China in five-year increments
(2000-2015)
|
Items
|
Description
|
|
Dataset
full name
|
Time
series of soil erosion dataset in water erosion area of China in five-year increments
(2000-2015)
|
|
Dataset
short name
|
SoilErasionChina_2000-2015
|
|
Authors
|
Li,
J. L. Research Center for Eco-Environmental Sciences, Chinese Academy of
Sciences, lijialei97@163.com
Sun,
R. H. AAM-6837-2021, Research Center for Eco-Environmental Sciences, Chinese
Academy of Sciences, rhsun@rcees.ac.cn
|
|
|
Xiong,
M. Q. Institute of Geographic Sciences and Natural Resources Research,
Chinese Academy of Sciences, xiongmq@igsnrr.ac.cn
Chen,
L. D. Research Center for Eco-Environmental Sciences, Chinese Academy of
Sciences, liding@rcees.ac.cn
|
|
Geographical
region
|
Water
erosion area of China
|
|
Year
|
2000,
2005, 2010, 2015
|
|
Temporal
resolution
|
Annual
|
|
Spatial
resolution
|
1 km ´ 1 km
|
|
Data
format
|
.tif
|
|
|
Data
size
|
The
data volume is 1.91 GB (compressed into a file, 95.9 MB)
|
|
|
Data
files
|
12
data files for soil erosion values of China in 2000, 2005, 2010 and 2015
|
|
Foundation
|
Ministry
of Science and Technology of P. R. China (2017YFA0604704)
|
|
Data
publisher
|
Global Change Research Data Publishing &
Repository, http://www.geodoi.ac.cn
|
|
Address
|
No.
11A, Datun Road, Chaoyang District, Beijing 100101, China
|
|
Data
sharing policy
|
Data from the Global
Change Research Data Publishing & Repository includes metadata, datasets (in the Digital Journal of Global Change Data Repository), and
publications (in the Journal of Global Change Data & Discovery). Data sharing policy
includes: (1) Data are openly
available and can be free downloaded via the Internet; (2) End users are
encouraged to use Data subject to
citation; (3) Users, who are by definition also value-added service
providers, are welcome to redistribute Data
subject to written permission from the GCdataPR Editorial Office and the
issuance of a Data redistribution
license; and (4) If Data are used
to compile new datasets, the ??ten per cent principal?? should be followed such
that Data records utilized should
not surpass 10% of the new dataset contents, while sources should be clearly
noted in suitable places in the new dataset[26]
|
|
Communication and searchable system
|
DOI, CSTR, Crossref, DCI, CSCD,
CNKI, SciEngine, WDS/ISC, GEOSS
|
3.2 Algorithm Principle
We use the USLE (Universal Soil Loss Equation) model to estimate the soil
erosion rate in water erosion areas in 2000, 2005, 2010, and 2015 and make certain adjustments in the newly
published methods
of factor calculation according to the actual
backgrounds in China. The model equation is as
follows:
A
= R ∙ L ∙ S ∙ K ∙ C ∙ P (1)
where A is the annual soil erosion
rate predicted by the model (t??hm?C2??a?C1); R is the
rainfall erosivity factor (MJ??mm??hm2??h?C1??a?C1)[29];
LS, with L being the slope length factor and S being the slope factor, is the
terrain factor[30],
dimensionless and is calculated in this study by using DEM data; K is the soil erodibility factor (t??hm2??h??hm?C2??MJ?C1??mm?C1)[31,32]; C is the vegetation
cover and management factor (dimensionless)[33]; P factor is
the water and soil conservation measure factor (dimensionless)[34].
After each factor was calculated according to the minimum resolution of the
input data, all the factors were resampled to a resolution of 1 km ?? 1 km by
bilinear interpolation and multiplied to obtain the soil erosion rate in each
year[35].
3.2.1 Calibration of the R-factor
Based on Climate Zone
The traditional calculation method of R-factor
requires 30-minute rainfall intensity data as input data[7], which
is difficult to complete in a large-scale and long-term serial study. This study used annual precipitation combined
with multi-parameter input to calculate the R-factor according to
different climatic zones. Naipal[20] fitted the regression between R-factor
value and annual precipitation (P, mm), elevation (Z, m), and simple
precipitation intensity index (SDII, mm??day?C1) on the basis of the measured data from rainfall stations in different
climate zones in the United States:
R = (P, Z, SDII) (2)
Different calculation equations
were used in accordance with different climatic zones, which are classified based on the
Koppen-Geiger climate zoning method[27,36]. Naipal??s method was used
in 6 of these climatic zones[35]. In this study, the following steps were taken to calculate the R-factor. Firstly, the annual precipitation of each
rainfall station was calculated
based on the daily
precipitation data. Secondly, the average annual rainfall erosivity was calculated by this method. Lastly,
the spatial interpolation of R-factor values was predicted by means of the
ordinary Kriging interpolation method to achieve its accuracy[37].
3.2.2 Calibration of C-factor Based on Land Cover
The C-factor is closely related
to the types of vegetation and crops[38,39], so Borrelli??s method[12] was
used in this study to adjust and calculate the C-factor of arable and non-arable land
in China separately. The C-factor of arable land is calculated according to the main crop types and sown areas of
arable land in each province issued by the National Bureau of Statistics. Some adjustments were made according to the
actual agricultural conditions in China before the classification of the
released crops into 10 categories, and the C value of the national arable land was
calculated by the following equation[35]:
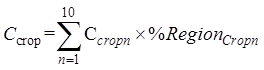 (3)
(3)
where Ccropn represents the C-factor
of the n-crop, and % RegionCropn represents the share
of this crop in the agricultural land of the given province.
For
non-arable land, C-factor depends on vegetation coverage and land cover
types. This study estimated the C value in non-arable land by following both the
empirical C values of various vegetation coverage types in the
literatures[12, 19]and land use data and NDVI data [35]:
CNonArable
= Min(CNA) + Range(CNA)
?? (1-Fcover) (4)
Fcover =VFC = (NDVI - NDVImin)/(NDVImax
-NDVImin) (5)
where Min(CNA) is
the minimum value of CNA, Range(CNA)
is the difference between the maximum and minimum CNA, and
Fcover is the vegetation coverage.
3.2.3 Calibration of P-factor Based on Topographic
Features
The P-factor of the USLE/RUSLE
model is rarely taken into
consideration in
large-scale modeling of soil erosion risk[40]. Xiong et al. summarizes the differences in P
values of arable land with different slopes and different soil and water
conservation measures on the basis
of numerous
literatures[41?C43]. In this study, based on Xiong et al.??s[43]
assignment method of P-factor
and the land use
types, different P values
were assigned.
The horizontal paddy field was assigned a value of 0.2, and P-factor
values in other arable areas were assigned according to the slope. The P
value for arable land with a slope of 10?? or less than 10?? was taken as 0.5,
the P value for arable land with a slope of greater than 10?? and less
than or equal to 25?? was taken as 0.6, the P value for arable land with
a slope greater than 25?? and less than or equal to 45?? was taken as 0.8, and P
value for arable land with a slope greater than 45?? was taken as 1. For other
non-arable land, the P value is 1.
3.2.4 Calculation Methods of Other Factors
This study used the DEM data with a resolution of 30 m ?? 30 m to calculate the L-
factor[7,44?C45]. The S-factor
was calculated by following the method in the CSLE model
proposed by Liu et al.[46]
according to the different slope degrees[35]. The soil erodibility
factor K was calculated by following the EPIC model[47]. The
input data included the percentage
content of sand, silt, clay, and organic carbon in soil[35].
3.3 Technical Route
The technical
route of the dataset development is shown
in Figure 1.
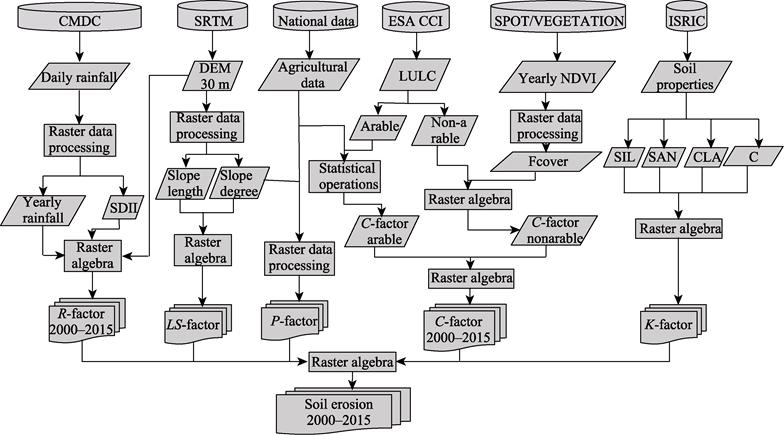
Figure 1 The technical route of the dataset
development
4 Data Results and Validation
4.1 Data Composition
The dataset contains 12 files, including 4 soil erosion
data and 8 process data (C-factor and R-factor). The format is
.tif. The dataset covers water erosion areas in China in 2000, 2005, 2010, and
2015. The spatial resolution is 1 km ?? 1 km. The unit of soil erosion data is
t??hm?C2??a?C1, which is the amount of soil erosion per unit
area; the C-factor data is dimensionless; the unit of R-factor
data is MJ??mm??hm2??h?C1??a?C1. The file is named
SEyyyy.tif, Cyyyy.tif, and Ryyyy.tif.
4.2 Data Products
The average annual soil erosion in China in 2000, 2005,
2010, and 2015 are 38.63, 37.35, 49.03, 47.84 t??hm?C2??a?C1,
respectively. The range of soil erosion rate is between 0?C2,880 t??hm?C2??a?C1.
The spatial distribution of soil erosion is shown in Figure 2. According to the
Soil Erosion Classification and Grading Standards[48] issued by the
Ministry of Water Resources of the People??s Republic of China, soil erosion in
China is divided into 6 degrees, which are micro, slight, moderate, intense,
extremely strong, and severe. Most of the areas in China (over 60%) are
characterized by water erosion of micro degree. The areas with strong water
erosion in China are mostly distributed in southern China dispersedly. For
example, water erosion of severe degree can be found in the areas between the
Yunnan-Guizhou Plateau and the Sichuan Basin, especially in Guizhou province.
The areas with severe water erosion in northern China are mostly concentrated
in the Loess Plateau, the Shandong hills, the Greater Khingan Range, and the
junction of the Kunlun Mountains and the Tarim Basin.
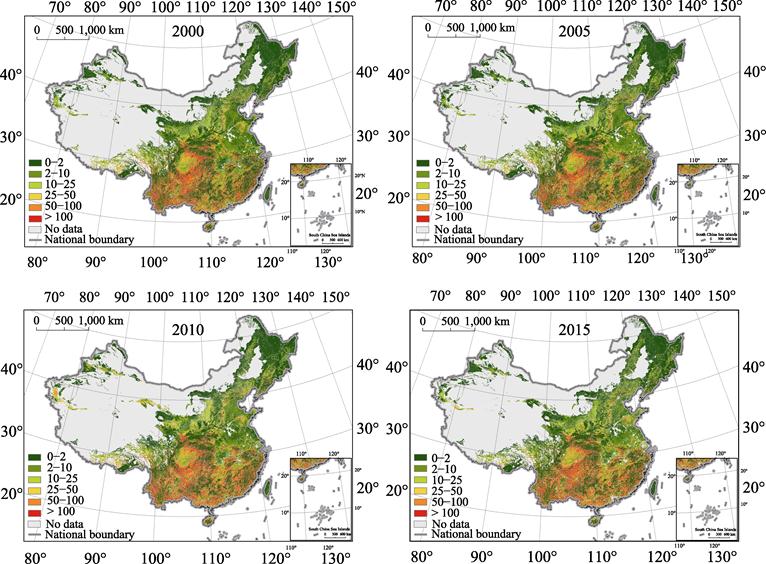
Figure 2 Distribution of soil erosion in China
4.3 Data Validation
It is difficult
to obtain runoff data for large-scale plot experiments. Based on the literatures[49], this study collects global runoff plot data which contributes to the selection of the plot data in
China. The comparison between the modeled data (average of 4 years) and the plot data (Figure 3) shows that the errors in the tropic zone are the largest in all climatic zones. Although the modeled values are
different from the measured values in other climatic regions, the trend differences between the climatic regions are
generally similar.
Although the simulation results have
been improved by collecting high-resolution data and improving factors, there are
errors in large-scale model estimation compared with small-scale measured data.
The reason may be that the estimation of soil erosion has a spatial scale
effect on the large scale[50]. The other reason that causes the
different results may be that the differences of the precision of the input
data and the method of large-scale models (Table 4). For example, the average annual soil erosion in Jiangxi province calculated
by the USLE model on different scales has a large gap. In general, different
research scales, calculation methods, and data sources can lead to
uncertainties and different results in many studies. Moreover, this research is
mainly devoted to water erosion areas. Generally, other large-scale studies
would include non-water erosion areas, such as wind erosion areas. This dataset
can be regarded as a source of change trend analysis of soil erosion in China
and a comparison of large-scale soil erosion
for future research.
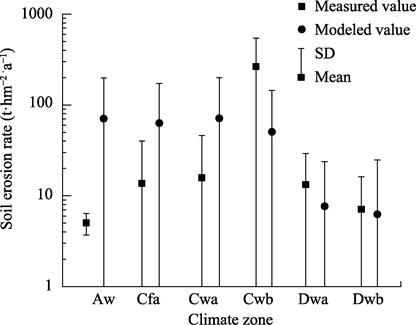
Figure 3 Comparison of the soil erosion
rate simulated by the model and the experimental measurement
(Note: The naming method of the climate zone is a
combination of letter abbreviations. The meaning of the letter abbreviations is
A: Tropical, B: Arid, C: Temperate, D: Cold, a: Hot Summer, b: Warm Summer, k:
Cold, f: Without dry season, w: Dry Winter.)
Table 2 Average
annual soil erosion rate in different regions (t??hm?C2??a?C1)
|
Research
area
|
Other
study
|
This
study
|
|
Jiangxi Province
|
63.75[17]
|
90.60
|
|
0.92[51]
|
|
3.54[52]
|
|
Guangdong Province
|
22.94[53]
|
115.19
|
|
1.88[51]
|
|
Yanhe River
basin
|
144.58[54]
|
2.20
|
|
Loess Plateau
|
24.05[18]
|
8.27
|
|
The southern
hill region of China
|
4.22[52]
|
108.20
|
|
South of Gansu
and northwest of Sichuan
|
13.39[55]
|
11.53
|
5 Discussion and Conclusion
This dataset is the distribution
pattern of soil erosion in China calculated based on the empirical model USLE. The USLE model is
normally applied
to the field scale, thus it is
difficult to apply it directly to the large scale. This dataset can simulate the
intensity and dynamics of soil erosion on a national scale by calibrating the
factors. Specifically, based on the characteristics of natural and social
conditions in China, this dataset improves the accuracy of some specific
factors. For example, the C-factor is assigned according to the
agricultural background and natural vegetation of different provinces, the R-factor
is calibrated according to different climatic zones, and P-factor is
improved according to management measures in farmland.
Among the original data in this dataset, the resolution
of the terrain data is 30 m ?? 30 m and the resolution of the NDVI data is 1 km
?? 1 km. The results are resampled to 1 km ?? 1 km. Compared with related
national-scale studies[51], the resolution of our terrain data has
been increased from 90 m ?? 90 m to 30 m ?? 30 m, and the C- and P-factors
of arable land have been optimized more detailedly according to the actual conditions of crop planting in
each province; therefore, the precision of the simulation has been improved. In
addition, a more complete dataset has been formed in the time series including
the years of 2000, 2005, 2010 and 2015.
There are certain difficulties in the quantitative
estimation of large-scale soil erosion, especially the trade-off between the
feasibility of calculation and the accuracy of the results. The mechanism of
the empirical model ignores the process and dynamics of soil erosion[56],
The subsequent verification of model lacks a lot of measurement data for
comparison. The main goal of making this dataset is to analyze the variation of
soil erosion in China and provide a basis for the identification of potential
hot-spots of soil erosion. Moreover, this dataset also aims to provide a comparison for other soil erosion studies in
the future, as well as provide a reference for further studies on improving
parameters and mechanisms for USLE model. It is also expected to lay a
foundation for the identification of driving factors of soil erosion changes in
the future researches.
Author Contributions
Sun, R. H. made
the overall design for the development of the dataset; Li, J. L. contributed to the data
processing and analysis, did data verification, and wrote the data paper;
Xiong, M. Q. designed
the algorithms of dataset; Chen, L. D. provided modification ideas and
opinion.
Conflicts
of Interest
The authors declare no
conflicts of interest.
References
[1]
Lal, R.
Soil Erosion Impact on agronomic productivity and environment quality [J]. Critical Reviews in Plant Sciences,
1998, 17(4): 319?C464.
[2]
Pham, T. N.,
Yang, D., Kanae, S., et al.
Application of RUSLE model on global soil erosion estimate [J]. Annual Journal of Hydraulic Engineering,
2001, 45: 811?C816.
[3]
Pimentel, D.,
Harvey, C., Resosudarmo, P., et al.
Environmental and economic costs of soil erosion and conservation benefits [J]. Science, 1995, 267(5201): 1117?C1123.
[4] Lal, R. Soils and world food security [J]. Soil and Tillage Research, 2009, 102(1):
1?C4.
[5] Zhang,
W. B., Liu, B. Y. Development of Chinese soil loss equation information system
based on GIS [J]. Journal of Soil and Water Conservation, 2003, 17(2):
89?C92.
[6]
Renard, K.
G., Foster, G. R., Weesies, G. A., et al.
RUSLE: revised universal soil loss equation [J]. Journal of Soil and Water Conservation, 1991, 46(1): 30?C33.
[7]
Wischmeier,
W., Smith, D. Predicting Rainfall Erosion Losses: A Guide to Conservation
Planning. Agricultural Handbook No. 537 [M]. Washington DC: U.S. Department of
Agriculture, 1978.
[8]
Montgomery,
D. R. Soil erosion and agricultural sustainability [J]. Proceedings of the National Academy of Sciences of USA,
2007, 104(33): 13268?C13272.
[9]
de Vente,
J., Poesen, J. Predicting soil erosion and sediment yield at the basin scale:
scale issues and semi-quantitative models [J]. Earth-Science Reviews, 2005, 71(1/2): 95?C125.
[10]
Karydas, C.
G., Panagos, P., Gitas, I. Z. A classification of water erosion models
according to their geospatial characteristics [J]. International Journal of Digital Earth, 2014, 7(3): 229?C250.
[11]
Borrelli, P.,
Robinson, D. A., Panagos, P., et al.
Land use and climate change impacts on global soil erosion by water (2015-2070) [J]. Proceedings of the National Academy of
Sciences of the United States of America, 2020, 117(36): 21994?C22001.
[12]
Borrelli, P.,
Robinson, D. A., Fleischer, L. R., et al.
An assessment of the global impact of 21st century land use change
on soil erosion [J]. Nature
Communications, 2017, 8(1): 2013.
[13]
Guerra, C.
A., Rosa, I. M. D., Valentini, E., et al.
Global vulnerability of soil ecosystems to erosion [J]. Landscape Ecology, 2020, 35(4): 823?C842.
[14]
Ito, A.
Simulated impacts of climate and land-cover change on soil erosion and
implication for the carbon cycle, 1901 to 2100 [J]. Geophysical Research Letters, 2007, 34(9): L09403.
[15] Yang, D. W., Kanae, S., Oki, T., et al. Global potential soil erosion
with reference to land use and climate changes [J]. Hydrological Processes, 2003, 17(14): 2913?C2928.
[16] Hu, X.
P. , Zeng, C., Qian, Q. H., et al. Using RUSLE model to analyze temporal and spatial
characteristics of soil erosion in Tongren area from 1987 to 2015 [J]. Journal
of Ecology and Rural Environment, 2019, 35(2): 158?C166.
[17] Zhou,
X. F., Ma, G. X., Cao, G. Z., et al. Soil erosion changes in Jiangxi
Province from 2001to 2015 based on USLE model [J]. Bulletin of Soil and
Water Conservation, 2018, 38(1): 8?C11.
[18] Fu,
B., Liu, Y., Lu Y., et al. Assessing
the soil erosion control service of ecosystems change in the Loess Plateau of
China [J]. Ecological Complexity,
2011, 8(4): 284?C293.
[19]
Panagos, P.,
Borrelli, P., Meusburger, K., et al.
Estimating the soil erosion cover-management factor at the European scale [J]. Land Use Policy, 2015, 48: 38?C50.
[20]
Naipal, V.,
Reick, C., Pongratz, J., et al.
Improving the global applicability of the RUSLE model??adjustment of the
topographical and rainfall erosivity factors [J]. Geoscientific Model Development, 2015, 8(9): 2893?C2913.
[21]
Panagos, P.,
Ballabio, C., Borrelli, P., et al.
Rainfall erosivity in Europe [J]. Science
of the Total Environment, 2015, 511: 801?C814.
[22]
Lufafa, A.,
Tenywa, M. M., Isabirye, M., et al.
Prediction of soil erosion in a Lake Victoria basin catchment using a GIS-based
Universal Soil Loss model [J]. Agricultural
Systems, 2003, 76(3): 883?C894.
[23]
Barao, L.,
Alaoui, A., Ferreira, C., et al.
Assessment of promising agricultural management practices [J]. Science of the Total Environment, 2019,
649: 610?C619.
[24]
Panagos, P.,
Borrelli, P., Meusburger, K. A new European slope length and steepness factor
(LS-factor) for modeling soil erosion by water [J]. Geosciences, 2015, 5(2): 117?C126.
[25] Li, J.
L., Sun, R. H., Xiong, M. Q., et al. Time series of soil erosion dataset
in water erosion area of China in five-year increments (2000-2015)
[J/DB/OL]. Digital Journal of Global
Change Data Repository, 2021. https://doi.org/10.3974/geodb.2021.05.03.V1.
https://cstr.escience.org.cn/CSTR:20146.11.2021.05.03.V1.
[26] GCdataPR
Editorial Office. GCdataPR data sharing policy [OL].
https://doi.org/10.3974/dp.policy.2014.05 (Updated 2017).
[27]
Beck, H. E.,
Zimmermann, N. E., McVicar, T. R., et al.
Present and future Koppen-Geiger climate classification maps at 1-km resolution
[J]. Scientific Data, 2018, 5: 12.
[28] ESA. Land cover CCI product user guide version 2
[Z]. Tech. Rep. (2017).
[29] Zha,
L. S., Deng, G. H., Gu, J. C. Dynamic changes of soil erosion in the Chaohu watershed
from 1992 to 2013 [J]. Acta
Geographica Sinica, 2015, 70(11): 1708?C1719.
[30] Kong,
Y. P., Zhang, K. L., Cao, L. X. Appraise slope length factors in soil erosion
study [J]. Research of Soil and Water
Conser vation, 2008(4): 43?C47, 52.
[31]
Bouyoucos,
G. J. The clay ratio as a criterion of susceptibility of soils to erosion [J]. Journal of the American Society of Agronomy,
1935(9): 738?C741.
[32] Liu,
B. Y., Zhang, K. L. , Jiao, J. Y. Soil erodibility and its use in soil eros ion
predict ion mode [J]. Journal of Natural Resources, 1999(04): 345?C350.
[33] Feng,
Q., Zhao, W. W. The study on cover-management factor in USLE and RUSLE: a
review [J]. Acta Ecologica Sinica, 2014, 34(16): 4461?C4472.
[34] Renard, K. G., Foster, G. R., Weesies, G. A., et al. Predicting soil erosion by water:
a guide to conservation planning with the Revised Universal Soil Loss Equation
(RUSLE) [M]. In Agricultural Handbook
No.703. Washington, DC: US Department of Agriculture,
1997.
[35] Li, J.
L., Sun, R. H., Xiong, M. Q., et al.
Estimation of soil erosion based on the RUSLE model in China [J]. Acta
Ecologica Sinica, 2020, 40(10): 3473?C3485.
[36] Rubel, F., Markus, K. Observed and projected
climate shifts 1901-2100 depicted by world maps of the Köppen-Geiger
climate classification [J]. Meteorologische
Zeitschrift, 2010, 19: 135?C141.
[37] Li, L.,
Jiang, X. S., Sun, Y. Y. Geostatistics-based spatial interpolation method for
study of rainfall erosivity ??a case study of Jiangsu [J]. Journal of Ecology and Rural Environment, 2011, 27(01): 88?C92.
[38]
Panagos, P.,
Borrelli, P., Poesen, J., et al. The
new assessment of soil loss by water erosion in Europe [J]. Environmental Science & Policy, 2015, 54: 438?C447.
[39]
Borrelli, P.,
Panagos, P., Maerker, M., et al.
Assessment of the impacts of clear-cutting on soil loss by water erosion in
Italian forests: first comprehensive monitoring and modelling approach [J]. Catena, 2017, 149: 770?C781.
[40]
Panagos, P.,
Borrelli, P., Meusburger, K., et al.
Modelling the effect of support practices (P-factor) on the reduction of soil
erosion by water at European scale [J]. Environmental
Science & Policy, 2015, 51:
23?C34.
[41]
Xiong, M,
Sun, R., Chen, L. Effects of soil conservation techniques on water erosion
control: a global analysis [J]. Science
of the Total Environment, 2018, 645: 753?C760.
[42]
Teng, H.,
Rossel, R. A. V., Shi, Z., et al.
Assimilating satellite imagery and visible-near infrared spectroscopy to model
and map soil loss by water erosion in Australia [J]. Environmental Modelling & Software,
2016, 77: 156?C167.
[43]
Xiong, M.,
Sun, R., Chen, L. Global analysis of support practices in USLE-based soil
erosion modeling [J]. Progress in
Physical Geography: Earth and
Environment, 2019, 43(3): 391?C409.
[44]
McCool, D.
K., Brown, L. C., Foster, G. R., et al.
Revised slope steepness factor for the universal soil loss equation [J]. Transactions of the ASAE, 1987, 30(5):
1387?C1396.
[45]
Desmet, P.
J. J., Govers, G. A GIS procedure for automatically calculating the USLE LS
factor on topographically complex landscape units [J]. Journal of Soil & Water
Conservation, 1996, 51(5): 427?C433.
[46]
Liu, B,
Zhang, K., Yun, X. An Empirical Soil Loss
Equation [A]. In: Process of soil erosion and its environment effect volume
II 12th ISCO [C]. Beijing: Tsinghua press, 2002: 21-25.
[47] Sharpley, A. N., Williams, J. R.
EPIC-erosion/productivity impact calculator: 1. model determination [Z]. US Department of Agriculture, 1990.
[48] People??s
Republic of China Ministry of Water Resources. Standards of Classification of
Soil Erosion: SL190??2007 [S]. Beijing: China Water Power Press,
2008.
[49] Xiong,
M., Sun, R., Chen, L. A global comparison of soil erosion associated with land
use and climate type [J]. Geoderma,
2019, 343: 31?C39.
[50]
Ni, J. P., Wei, C. F., Xie, D. T. Effects of spatial scale on the
quantitative est imation of soil erosion [J]. Acta Ecologica Sinica,
2005(8): 2061?C2067.
[51]
Teng, H. F., Hu, J., Zhou, Y.,
et al. Modelling and mapping soil erosion potential in China [J]. Journal of Integrative Agriculture,
2019, 18(2): 251?C264.
[52] Chen,
S. X., Yang, X. H., Xiao, L. L., et al.
Study of soil erosion in the southern hillside area of China Based on RUSLE
model [J]. Resources Science, 2014,
36(6): 1288?C1297.
[53] Gao, F., Wang, Y. P., Yang, J. X., Assessing
soil erosion using USLE model and MODIS data in the Guangdong, China [C].
Bristol: Iop Publishing Ltd, 2017.
[54] Fu, B.
J., Zhao, W. W., Chen, L. D., et al.
Assessment of soil erosion at large watershed scale using RUSLE and GIS: A case
study in the Loess
Plateau of China [J]. Land Degradation & Development, 2005, 16(1): 73?C85.
[55] Wei,
J. M., Li, C. B., Wu, L, et al. Study
on soil erosion in northwestern Sichuan and southern Gansu (NSSG) based on USLE
[J]. Journal of Soil and Water
Conservation, 2021, 35(2): 31?C37, 46.
[56]
Quine, T. A.,van Oost, K. Insights into the
future of soil erosion [J]. Proceedings
of the National Academy of Sciences of the
United States of America, 2020, 117(38): 23205?C23207.